Free Statistics

of Irreproducible Research!

Author's title

Author*Unverified author*
R Software Modulerwasp_centraltendency.wasp
Title produced by softwareCentral Tendency
Date of computationSun, 12 Oct 2014 10:55:38 +0100
Cite this page as followsStatistical Computations at FreeStatistics.org, Office for Research Development and Education, URL https://freestatistics.org/blog/index.php?v=date/2014/Oct/12/t1413107760r1mb7ugk1h5wu26.htm/, Retrieved Wed, 15 May 2024 22:17:48 +0000
Statistical Computations at FreeStatistics.org, Office for Research Development and Education, URL https://freestatistics.org/blog/index.php?pk=240530, Retrieved Wed, 15 May 2024 22:17:48 +0000
QR Codes:

Original text written by user:
IsPrivate?No (this computation is public)
User-defined keywords
Estimated Impact117
Family? (F = Feedback message, R = changed R code, M = changed R Module, P = changed Parameters, D = changed Data)
-       [Central Tendency] [Asielverzoeken] [2014-10-12 09:55:38] [db747b603bff859876183158e28e8010] [Current]
Feedback Forum

Post a new message
Dataseries X:
1060
1050
1025
1085
1160
1310
1445
1445
1615
1650
1255
1175
1300
1280
1390
1340
1110
1325
1265
1150
1430
1655
1570
1345
1430
1260
1495
1125
895
1085
870
1185
1455
1540
1615
1200
1260
1095
1160
1095
1300
1215
1245
1350
1300
1280
1270
1065
1340
1265
1155
930
880
925
980
1015
1040
1365
1160
1115
1630
1225
1200
1265
1140
1270
1445
1305
1665
1830
1690
1520


Summary of computational transaction
Raw Inputview raw input (R code)
Raw Outputview raw output of R engine
Computing time2 seconds
R Server'Gertrude Mary Cox' @ cox.wessa.net

\begin{tabular}{lllllllll}
\hline
Summary of computational transaction \tabularnewline
Raw Input & view raw input (R code)  \tabularnewline
Raw Output & view raw output of R engine  \tabularnewline
Computing time & 2 seconds \tabularnewline
R Server & 'Gertrude Mary Cox' @ cox.wessa.net \tabularnewline
\hline
\end{tabular}
%Source: https://freestatistics.org/blog/index.php?pk=240530&T=0

[TABLE]
[ROW][C]Summary of computational transaction[/C][/ROW]
[ROW][C]Raw Input[/C][C]view raw input (R code) [/C][/ROW]
[ROW][C]Raw Output[/C][C]view raw output of R engine [/C][/ROW]
[ROW][C]Computing time[/C][C]2 seconds[/C][/ROW]
[ROW][C]R Server[/C][C]'Gertrude Mary Cox' @ cox.wessa.net[/C][/ROW]
[/TABLE]
Source: https://freestatistics.org/blog/index.php?pk=240530&T=0

Globally Unique Identifier (entire table): ba.freestatistics.org/blog/index.php?pk=240530&T=0

As an alternative you can also use a QR Code:  

The GUIDs for individual cells are displayed in the table below:

Summary of computational transaction
Raw Inputview raw input (R code)
Raw Outputview raw output of R engine
Computing time2 seconds
R Server'Gertrude Mary Cox' @ cox.wessa.net


Central Tendency - Ungrouped Data
MeasureValueS.E.Value/S.E.
Arithmetic Mean1271.9444444444425.061262097862350.7534073694133
Geometric Mean1254.59981996304
Harmonic Mean1237.4059340454
Quadratic Mean1289.35465123707
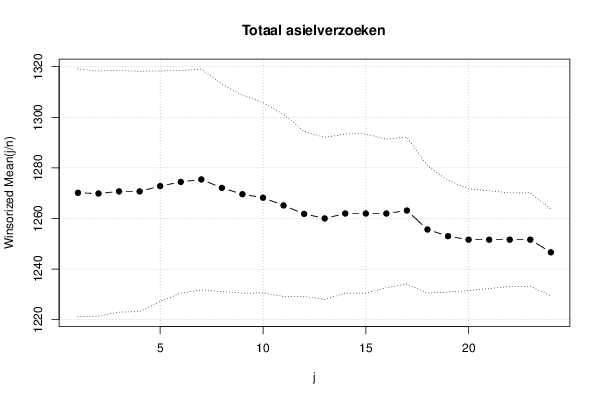
Winsorized Mean ( 1 / 24 )1270.1388888888924.489500685009451.8646298765237
Winsorized Mean ( 2 / 24 )1269.8611111111124.233752648563352.4005146675619
Winsorized Mean ( 3 / 24 )1270.6944444444423.874981166482253.2228459400152
Winsorized Mean ( 4 / 24 )1270.6944444444423.75587925656153.4896827316337
Winsorized Mean ( 5 / 24 )1272.7777777777822.780568743855255.8712028698183
Winsorized Mean ( 6 / 24 )1274.4444444444421.999643339768757.9302320842917
Winsorized Mean ( 7 / 24 )1275.4166666666721.840390125752658.3971558805989
Winsorized Mean ( 8 / 24 )1272.0833333333320.512971105329362.0136072342462
Winsorized Mean ( 9 / 24 )1269.5833333333319.565594803123264.8885631184939
Winsorized Mean ( 10 / 24 )1268.1944444444418.815237462085167.402521334105
Winsorized Mean ( 11 / 24 )1265.1388888888917.991905082450770.3171166750378
Winsorized Mean ( 12 / 24 )1261.8055555555616.318339372567477.3243849601981
Winsorized Mean ( 13 / 24 )126016.020941889593678.6470613702454
Winsorized Mean ( 14 / 24 )1261.9444444444415.725962715241480.2459262618871
Winsorized Mean ( 15 / 24 )1261.9444444444415.725962715241480.2459262618871
Winsorized Mean ( 16 / 24 )1261.9444444444414.691851628032885.8941729330151
Winsorized Mean ( 17 / 24 )1263.12514.521056664679886.9857496715341
Winsorized Mean ( 18 / 24 )1255.62512.594299041589599.6978867862048
Winsorized Mean ( 19 / 24 )1252.9861111111111.0517259618283113.374699611519
Winsorized Mean ( 20 / 24 )1251.5972222222210.0696063340286124.294553402018
Winsorized Mean ( 21 / 24 )1251.597222222229.66366433305853129.515800537548
Winsorized Mean ( 22 / 24 )1251.597222222229.24255102772427135.416858231877
Winsorized Mean ( 23 / 24 )1251.597222222229.24255102772427135.416858231877
Winsorized Mean ( 24 / 24 )1246.597222222228.58358196736891145.23042093164
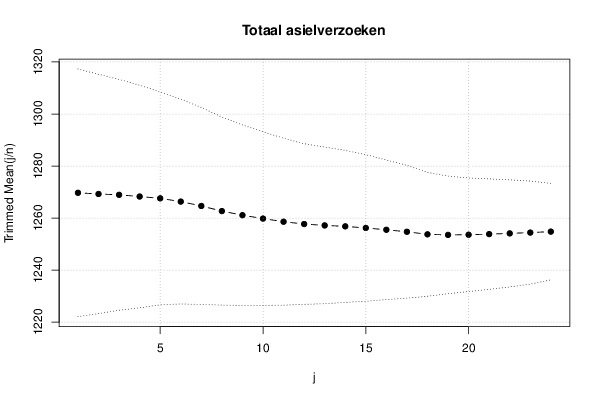
Trimmed Mean ( 1 / 24 )1269.7142857142923.80625857527553.3353143964
Trimmed Mean ( 2 / 24 )1269.2647058823522.993744784842955.2004346294663
Trimmed Mean ( 3 / 24 )1268.9393939393922.188668423948257.1886230256986
Trimmed Mean ( 4 / 24 )1268.2812521.389950781141259.2933225034908
Trimmed Mean ( 5 / 24 )1267.5806451612920.469031546514261.9267522393924
Trimmed Mean ( 6 / 24 )1266.3333333333319.67564192402464.3604583892705
Trimmed Mean ( 7 / 24 )1264.6551724137918.936828656534166.7828386342518
Trimmed Mean ( 8 / 24 )1262.6785714285718.065071901878469.8961276371824
Trimmed Mean ( 9 / 24 )1261.1111111111117.344530866817572.7094391191517
Trimmed Mean ( 10 / 24 )1259.8076923076916.687936016561975.4921214377499
Trimmed Mean ( 11 / 24 )1258.616.046514021584278.4344810534584
Trimmed Mean ( 12 / 24 )1257.7083333333315.434716049068381.4856800303271
Trimmed Mean ( 13 / 24 )1257.1739130434815.047149868883683.5489726624723
Trimmed Mean ( 14 / 24 )1256.8181818181814.60824844205186.0348307193579
Trimmed Mean ( 15 / 24 )1256.1904761904814.09566774308389.1189051194056
Trimmed Mean ( 16 / 24 )1255.513.409000039200693.6311429882617
Trimmed Mean ( 17 / 24 )1254.7368421052612.757932528616598.3495436498697
Trimmed Mean ( 18 / 24 )1253.7511.9046726187128105.315789871386
Trimmed Mean ( 19 / 24 )1253.5294117647111.3062407083719110.870575295333
Trimmed Mean ( 20 / 24 )1253.5937510.9116558143522114.885748902667
Trimmed Mean ( 21 / 24 )1253.8333333333310.6179292451937118.086427624379
Trimmed Mean ( 22 / 24 )1254.1071428571410.2870622095915121.911107107706
Trimmed Mean ( 23 / 24 )1254.423076923089.90464895924723126.649927936307
Trimmed Mean ( 24 / 24 )1254.791666666679.27869211772106135.233678491194
Median1265
Midrange1350
Midmean - Weighted Average at Xnp1250
Midmean - Weighted Average at X(n+1)p1253.75
Midmean - Empirical Distribution Function1250
Midmean - Empirical Distribution Function - Averaging1253.75
Midmean - Empirical Distribution Function - Interpolation1253.75
Midmean - Closest Observation1250
Midmean - True Basic - Statistics Graphics Toolkit1253.75
Midmean - MS Excel (old versions)1259.23076923077
Number of observations72

\begin{tabular}{lllllllll}
\hline
Central Tendency - Ungrouped Data \tabularnewline
Measure & Value & S.E. & Value/S.E. \tabularnewline
Arithmetic Mean & 1271.94444444444 & 25.0612620978623 & 50.7534073694133 \tabularnewline
Geometric Mean & 1254.59981996304 &  &  \tabularnewline
Harmonic Mean & 1237.4059340454 &  &  \tabularnewline
Quadratic Mean & 1289.35465123707 &  &  \tabularnewline
Winsorized Mean ( 1 / 24 ) & 1270.13888888889 & 24.4895006850094 & 51.8646298765237 \tabularnewline
Winsorized Mean ( 2 / 24 ) & 1269.86111111111 & 24.2337526485633 & 52.4005146675619 \tabularnewline
Winsorized Mean ( 3 / 24 ) & 1270.69444444444 & 23.8749811664822 & 53.2228459400152 \tabularnewline
Winsorized Mean ( 4 / 24 ) & 1270.69444444444 & 23.755879256561 & 53.4896827316337 \tabularnewline
Winsorized Mean ( 5 / 24 ) & 1272.77777777778 & 22.7805687438552 & 55.8712028698183 \tabularnewline
Winsorized Mean ( 6 / 24 ) & 1274.44444444444 & 21.9996433397687 & 57.9302320842917 \tabularnewline
Winsorized Mean ( 7 / 24 ) & 1275.41666666667 & 21.8403901257526 & 58.3971558805989 \tabularnewline
Winsorized Mean ( 8 / 24 ) & 1272.08333333333 & 20.5129711053293 & 62.0136072342462 \tabularnewline
Winsorized Mean ( 9 / 24 ) & 1269.58333333333 & 19.5655948031232 & 64.8885631184939 \tabularnewline
Winsorized Mean ( 10 / 24 ) & 1268.19444444444 & 18.8152374620851 & 67.402521334105 \tabularnewline
Winsorized Mean ( 11 / 24 ) & 1265.13888888889 & 17.9919050824507 & 70.3171166750378 \tabularnewline
Winsorized Mean ( 12 / 24 ) & 1261.80555555556 & 16.3183393725674 & 77.3243849601981 \tabularnewline
Winsorized Mean ( 13 / 24 ) & 1260 & 16.0209418895936 & 78.6470613702454 \tabularnewline
Winsorized Mean ( 14 / 24 ) & 1261.94444444444 & 15.7259627152414 & 80.2459262618871 \tabularnewline
Winsorized Mean ( 15 / 24 ) & 1261.94444444444 & 15.7259627152414 & 80.2459262618871 \tabularnewline
Winsorized Mean ( 16 / 24 ) & 1261.94444444444 & 14.6918516280328 & 85.8941729330151 \tabularnewline
Winsorized Mean ( 17 / 24 ) & 1263.125 & 14.5210566646798 & 86.9857496715341 \tabularnewline
Winsorized Mean ( 18 / 24 ) & 1255.625 & 12.5942990415895 & 99.6978867862048 \tabularnewline
Winsorized Mean ( 19 / 24 ) & 1252.98611111111 & 11.0517259618283 & 113.374699611519 \tabularnewline
Winsorized Mean ( 20 / 24 ) & 1251.59722222222 & 10.0696063340286 & 124.294553402018 \tabularnewline
Winsorized Mean ( 21 / 24 ) & 1251.59722222222 & 9.66366433305853 & 129.515800537548 \tabularnewline
Winsorized Mean ( 22 / 24 ) & 1251.59722222222 & 9.24255102772427 & 135.416858231877 \tabularnewline
Winsorized Mean ( 23 / 24 ) & 1251.59722222222 & 9.24255102772427 & 135.416858231877 \tabularnewline
Winsorized Mean ( 24 / 24 ) & 1246.59722222222 & 8.58358196736891 & 145.23042093164 \tabularnewline
Trimmed Mean ( 1 / 24 ) & 1269.71428571429 & 23.806258575275 & 53.3353143964 \tabularnewline
Trimmed Mean ( 2 / 24 ) & 1269.26470588235 & 22.9937447848429 & 55.2004346294663 \tabularnewline
Trimmed Mean ( 3 / 24 ) & 1268.93939393939 & 22.1886684239482 & 57.1886230256986 \tabularnewline
Trimmed Mean ( 4 / 24 ) & 1268.28125 & 21.3899507811412 & 59.2933225034908 \tabularnewline
Trimmed Mean ( 5 / 24 ) & 1267.58064516129 & 20.4690315465142 & 61.9267522393924 \tabularnewline
Trimmed Mean ( 6 / 24 ) & 1266.33333333333 & 19.675641924024 & 64.3604583892705 \tabularnewline
Trimmed Mean ( 7 / 24 ) & 1264.65517241379 & 18.9368286565341 & 66.7828386342518 \tabularnewline
Trimmed Mean ( 8 / 24 ) & 1262.67857142857 & 18.0650719018784 & 69.8961276371824 \tabularnewline
Trimmed Mean ( 9 / 24 ) & 1261.11111111111 & 17.3445308668175 & 72.7094391191517 \tabularnewline
Trimmed Mean ( 10 / 24 ) & 1259.80769230769 & 16.6879360165619 & 75.4921214377499 \tabularnewline
Trimmed Mean ( 11 / 24 ) & 1258.6 & 16.0465140215842 & 78.4344810534584 \tabularnewline
Trimmed Mean ( 12 / 24 ) & 1257.70833333333 & 15.4347160490683 & 81.4856800303271 \tabularnewline
Trimmed Mean ( 13 / 24 ) & 1257.17391304348 & 15.0471498688836 & 83.5489726624723 \tabularnewline
Trimmed Mean ( 14 / 24 ) & 1256.81818181818 & 14.608248442051 & 86.0348307193579 \tabularnewline
Trimmed Mean ( 15 / 24 ) & 1256.19047619048 & 14.095667743083 & 89.1189051194056 \tabularnewline
Trimmed Mean ( 16 / 24 ) & 1255.5 & 13.4090000392006 & 93.6311429882617 \tabularnewline
Trimmed Mean ( 17 / 24 ) & 1254.73684210526 & 12.7579325286165 & 98.3495436498697 \tabularnewline
Trimmed Mean ( 18 / 24 ) & 1253.75 & 11.9046726187128 & 105.315789871386 \tabularnewline
Trimmed Mean ( 19 / 24 ) & 1253.52941176471 & 11.3062407083719 & 110.870575295333 \tabularnewline
Trimmed Mean ( 20 / 24 ) & 1253.59375 & 10.9116558143522 & 114.885748902667 \tabularnewline
Trimmed Mean ( 21 / 24 ) & 1253.83333333333 & 10.6179292451937 & 118.086427624379 \tabularnewline
Trimmed Mean ( 22 / 24 ) & 1254.10714285714 & 10.2870622095915 & 121.911107107706 \tabularnewline
Trimmed Mean ( 23 / 24 ) & 1254.42307692308 & 9.90464895924723 & 126.649927936307 \tabularnewline
Trimmed Mean ( 24 / 24 ) & 1254.79166666667 & 9.27869211772106 & 135.233678491194 \tabularnewline
Median & 1265 &  &  \tabularnewline
Midrange & 1350 &  &  \tabularnewline
Midmean - Weighted Average at Xnp & 1250 &  &  \tabularnewline
Midmean - Weighted Average at X(n+1)p & 1253.75 &  &  \tabularnewline
Midmean - Empirical Distribution Function & 1250 &  &  \tabularnewline
Midmean - Empirical Distribution Function - Averaging & 1253.75 &  &  \tabularnewline
Midmean - Empirical Distribution Function - Interpolation & 1253.75 &  &  \tabularnewline
Midmean - Closest Observation & 1250 &  &  \tabularnewline
Midmean - True Basic - Statistics Graphics Toolkit & 1253.75 &  &  \tabularnewline
Midmean - MS Excel (old versions) & 1259.23076923077 &  &  \tabularnewline
Number of observations & 72 &  &  \tabularnewline
\hline
\end{tabular}
%Source: https://freestatistics.org/blog/index.php?pk=240530&T=1

[TABLE]
[ROW][C]Central Tendency - Ungrouped Data[/C][/ROW]
[ROW][C]Measure[/C][C]Value[/C][C]S.E.[/C][C]Value/S.E.[/C][/ROW]
[ROW][C]Arithmetic Mean[/C][C]1271.94444444444[/C][C]25.0612620978623[/C][C]50.7534073694133[/C][/ROW]
[ROW][C]Geometric Mean[/C][C]1254.59981996304[/C][C][/C][C][/C][/ROW]
[ROW][C]Harmonic Mean[/C][C]1237.4059340454[/C][C][/C][C][/C][/ROW]
[ROW][C]Quadratic Mean[/C][C]1289.35465123707[/C][C][/C][C][/C][/ROW]
[ROW][C]Winsorized Mean ( 1 / 24 )[/C][C]1270.13888888889[/C][C]24.4895006850094[/C][C]51.8646298765237[/C][/ROW]
[ROW][C]Winsorized Mean ( 2 / 24 )[/C][C]1269.86111111111[/C][C]24.2337526485633[/C][C]52.4005146675619[/C][/ROW]
[ROW][C]Winsorized Mean ( 3 / 24 )[/C][C]1270.69444444444[/C][C]23.8749811664822[/C][C]53.2228459400152[/C][/ROW]
[ROW][C]Winsorized Mean ( 4 / 24 )[/C][C]1270.69444444444[/C][C]23.755879256561[/C][C]53.4896827316337[/C][/ROW]
[ROW][C]Winsorized Mean ( 5 / 24 )[/C][C]1272.77777777778[/C][C]22.7805687438552[/C][C]55.8712028698183[/C][/ROW]
[ROW][C]Winsorized Mean ( 6 / 24 )[/C][C]1274.44444444444[/C][C]21.9996433397687[/C][C]57.9302320842917[/C][/ROW]
[ROW][C]Winsorized Mean ( 7 / 24 )[/C][C]1275.41666666667[/C][C]21.8403901257526[/C][C]58.3971558805989[/C][/ROW]
[ROW][C]Winsorized Mean ( 8 / 24 )[/C][C]1272.08333333333[/C][C]20.5129711053293[/C][C]62.0136072342462[/C][/ROW]
[ROW][C]Winsorized Mean ( 9 / 24 )[/C][C]1269.58333333333[/C][C]19.5655948031232[/C][C]64.8885631184939[/C][/ROW]
[ROW][C]Winsorized Mean ( 10 / 24 )[/C][C]1268.19444444444[/C][C]18.8152374620851[/C][C]67.402521334105[/C][/ROW]
[ROW][C]Winsorized Mean ( 11 / 24 )[/C][C]1265.13888888889[/C][C]17.9919050824507[/C][C]70.3171166750378[/C][/ROW]
[ROW][C]Winsorized Mean ( 12 / 24 )[/C][C]1261.80555555556[/C][C]16.3183393725674[/C][C]77.3243849601981[/C][/ROW]
[ROW][C]Winsorized Mean ( 13 / 24 )[/C][C]1260[/C][C]16.0209418895936[/C][C]78.6470613702454[/C][/ROW]
[ROW][C]Winsorized Mean ( 14 / 24 )[/C][C]1261.94444444444[/C][C]15.7259627152414[/C][C]80.2459262618871[/C][/ROW]
[ROW][C]Winsorized Mean ( 15 / 24 )[/C][C]1261.94444444444[/C][C]15.7259627152414[/C][C]80.2459262618871[/C][/ROW]
[ROW][C]Winsorized Mean ( 16 / 24 )[/C][C]1261.94444444444[/C][C]14.6918516280328[/C][C]85.8941729330151[/C][/ROW]
[ROW][C]Winsorized Mean ( 17 / 24 )[/C][C]1263.125[/C][C]14.5210566646798[/C][C]86.9857496715341[/C][/ROW]
[ROW][C]Winsorized Mean ( 18 / 24 )[/C][C]1255.625[/C][C]12.5942990415895[/C][C]99.6978867862048[/C][/ROW]
[ROW][C]Winsorized Mean ( 19 / 24 )[/C][C]1252.98611111111[/C][C]11.0517259618283[/C][C]113.374699611519[/C][/ROW]
[ROW][C]Winsorized Mean ( 20 / 24 )[/C][C]1251.59722222222[/C][C]10.0696063340286[/C][C]124.294553402018[/C][/ROW]
[ROW][C]Winsorized Mean ( 21 / 24 )[/C][C]1251.59722222222[/C][C]9.66366433305853[/C][C]129.515800537548[/C][/ROW]
[ROW][C]Winsorized Mean ( 22 / 24 )[/C][C]1251.59722222222[/C][C]9.24255102772427[/C][C]135.416858231877[/C][/ROW]
[ROW][C]Winsorized Mean ( 23 / 24 )[/C][C]1251.59722222222[/C][C]9.24255102772427[/C][C]135.416858231877[/C][/ROW]
[ROW][C]Winsorized Mean ( 24 / 24 )[/C][C]1246.59722222222[/C][C]8.58358196736891[/C][C]145.23042093164[/C][/ROW]
[ROW][C]Trimmed Mean ( 1 / 24 )[/C][C]1269.71428571429[/C][C]23.806258575275[/C][C]53.3353143964[/C][/ROW]
[ROW][C]Trimmed Mean ( 2 / 24 )[/C][C]1269.26470588235[/C][C]22.9937447848429[/C][C]55.2004346294663[/C][/ROW]
[ROW][C]Trimmed Mean ( 3 / 24 )[/C][C]1268.93939393939[/C][C]22.1886684239482[/C][C]57.1886230256986[/C][/ROW]
[ROW][C]Trimmed Mean ( 4 / 24 )[/C][C]1268.28125[/C][C]21.3899507811412[/C][C]59.2933225034908[/C][/ROW]
[ROW][C]Trimmed Mean ( 5 / 24 )[/C][C]1267.58064516129[/C][C]20.4690315465142[/C][C]61.9267522393924[/C][/ROW]
[ROW][C]Trimmed Mean ( 6 / 24 )[/C][C]1266.33333333333[/C][C]19.675641924024[/C][C]64.3604583892705[/C][/ROW]
[ROW][C]Trimmed Mean ( 7 / 24 )[/C][C]1264.65517241379[/C][C]18.9368286565341[/C][C]66.7828386342518[/C][/ROW]
[ROW][C]Trimmed Mean ( 8 / 24 )[/C][C]1262.67857142857[/C][C]18.0650719018784[/C][C]69.8961276371824[/C][/ROW]
[ROW][C]Trimmed Mean ( 9 / 24 )[/C][C]1261.11111111111[/C][C]17.3445308668175[/C][C]72.7094391191517[/C][/ROW]
[ROW][C]Trimmed Mean ( 10 / 24 )[/C][C]1259.80769230769[/C][C]16.6879360165619[/C][C]75.4921214377499[/C][/ROW]
[ROW][C]Trimmed Mean ( 11 / 24 )[/C][C]1258.6[/C][C]16.0465140215842[/C][C]78.4344810534584[/C][/ROW]
[ROW][C]Trimmed Mean ( 12 / 24 )[/C][C]1257.70833333333[/C][C]15.4347160490683[/C][C]81.4856800303271[/C][/ROW]
[ROW][C]Trimmed Mean ( 13 / 24 )[/C][C]1257.17391304348[/C][C]15.0471498688836[/C][C]83.5489726624723[/C][/ROW]
[ROW][C]Trimmed Mean ( 14 / 24 )[/C][C]1256.81818181818[/C][C]14.608248442051[/C][C]86.0348307193579[/C][/ROW]
[ROW][C]Trimmed Mean ( 15 / 24 )[/C][C]1256.19047619048[/C][C]14.095667743083[/C][C]89.1189051194056[/C][/ROW]
[ROW][C]Trimmed Mean ( 16 / 24 )[/C][C]1255.5[/C][C]13.4090000392006[/C][C]93.6311429882617[/C][/ROW]
[ROW][C]Trimmed Mean ( 17 / 24 )[/C][C]1254.73684210526[/C][C]12.7579325286165[/C][C]98.3495436498697[/C][/ROW]
[ROW][C]Trimmed Mean ( 18 / 24 )[/C][C]1253.75[/C][C]11.9046726187128[/C][C]105.315789871386[/C][/ROW]
[ROW][C]Trimmed Mean ( 19 / 24 )[/C][C]1253.52941176471[/C][C]11.3062407083719[/C][C]110.870575295333[/C][/ROW]
[ROW][C]Trimmed Mean ( 20 / 24 )[/C][C]1253.59375[/C][C]10.9116558143522[/C][C]114.885748902667[/C][/ROW]
[ROW][C]Trimmed Mean ( 21 / 24 )[/C][C]1253.83333333333[/C][C]10.6179292451937[/C][C]118.086427624379[/C][/ROW]
[ROW][C]Trimmed Mean ( 22 / 24 )[/C][C]1254.10714285714[/C][C]10.2870622095915[/C][C]121.911107107706[/C][/ROW]
[ROW][C]Trimmed Mean ( 23 / 24 )[/C][C]1254.42307692308[/C][C]9.90464895924723[/C][C]126.649927936307[/C][/ROW]
[ROW][C]Trimmed Mean ( 24 / 24 )[/C][C]1254.79166666667[/C][C]9.27869211772106[/C][C]135.233678491194[/C][/ROW]
[ROW][C]Median[/C][C]1265[/C][C][/C][C][/C][/ROW]
[ROW][C]Midrange[/C][C]1350[/C][C][/C][C][/C][/ROW]
[ROW][C]Midmean - Weighted Average at Xnp[/C][C]1250[/C][C][/C][C][/C][/ROW]
[ROW][C]Midmean - Weighted Average at X(n+1)p[/C][C]1253.75[/C][C][/C][C][/C][/ROW]
[ROW][C]Midmean - Empirical Distribution Function[/C][C]1250[/C][C][/C][C][/C][/ROW]
[ROW][C]Midmean - Empirical Distribution Function - Averaging[/C][C]1253.75[/C][C][/C][C][/C][/ROW]
[ROW][C]Midmean - Empirical Distribution Function - Interpolation[/C][C]1253.75[/C][C][/C][C][/C][/ROW]
[ROW][C]Midmean - Closest Observation[/C][C]1250[/C][C][/C][C][/C][/ROW]
[ROW][C]Midmean - True Basic - Statistics Graphics Toolkit[/C][C]1253.75[/C][C][/C][C][/C][/ROW]
[ROW][C]Midmean - MS Excel (old versions)[/C][C]1259.23076923077[/C][C][/C][C][/C][/ROW]
[ROW][C]Number of observations[/C][C]72[/C][C][/C][C][/C][/ROW]
[/TABLE]
Source: https://freestatistics.org/blog/index.php?pk=240530&T=1

Globally Unique Identifier (entire table): ba.freestatistics.org/blog/index.php?pk=240530&T=1

As an alternative you can also use a QR Code:  

The GUIDs for individual cells are displayed in the table below:

Central Tendency - Ungrouped Data
MeasureValueS.E.Value/S.E.
Arithmetic Mean1271.9444444444425.061262097862350.7534073694133
Geometric Mean1254.59981996304
Harmonic Mean1237.4059340454
Quadratic Mean1289.35465123707
Winsorized Mean ( 1 / 24 )1270.1388888888924.489500685009451.8646298765237
Winsorized Mean ( 2 / 24 )1269.8611111111124.233752648563352.4005146675619
Winsorized Mean ( 3 / 24 )1270.6944444444423.874981166482253.2228459400152
Winsorized Mean ( 4 / 24 )1270.6944444444423.75587925656153.4896827316337
Winsorized Mean ( 5 / 24 )1272.7777777777822.780568743855255.8712028698183
Winsorized Mean ( 6 / 24 )1274.4444444444421.999643339768757.9302320842917
Winsorized Mean ( 7 / 24 )1275.4166666666721.840390125752658.3971558805989
Winsorized Mean ( 8 / 24 )1272.0833333333320.512971105329362.0136072342462
Winsorized Mean ( 9 / 24 )1269.5833333333319.565594803123264.8885631184939
Winsorized Mean ( 10 / 24 )1268.1944444444418.815237462085167.402521334105
Winsorized Mean ( 11 / 24 )1265.1388888888917.991905082450770.3171166750378
Winsorized Mean ( 12 / 24 )1261.8055555555616.318339372567477.3243849601981
Winsorized Mean ( 13 / 24 )126016.020941889593678.6470613702454
Winsorized Mean ( 14 / 24 )1261.9444444444415.725962715241480.2459262618871
Winsorized Mean ( 15 / 24 )1261.9444444444415.725962715241480.2459262618871
Winsorized Mean ( 16 / 24 )1261.9444444444414.691851628032885.8941729330151
Winsorized Mean ( 17 / 24 )1263.12514.521056664679886.9857496715341
Winsorized Mean ( 18 / 24 )1255.62512.594299041589599.6978867862048
Winsorized Mean ( 19 / 24 )1252.9861111111111.0517259618283113.374699611519
Winsorized Mean ( 20 / 24 )1251.5972222222210.0696063340286124.294553402018
Winsorized Mean ( 21 / 24 )1251.597222222229.66366433305853129.515800537548
Winsorized Mean ( 22 / 24 )1251.597222222229.24255102772427135.416858231877
Winsorized Mean ( 23 / 24 )1251.597222222229.24255102772427135.416858231877
Winsorized Mean ( 24 / 24 )1246.597222222228.58358196736891145.23042093164
Trimmed Mean ( 1 / 24 )1269.7142857142923.80625857527553.3353143964
Trimmed Mean ( 2 / 24 )1269.2647058823522.993744784842955.2004346294663
Trimmed Mean ( 3 / 24 )1268.9393939393922.188668423948257.1886230256986
Trimmed Mean ( 4 / 24 )1268.2812521.389950781141259.2933225034908
Trimmed Mean ( 5 / 24 )1267.5806451612920.469031546514261.9267522393924
Trimmed Mean ( 6 / 24 )1266.3333333333319.67564192402464.3604583892705
Trimmed Mean ( 7 / 24 )1264.6551724137918.936828656534166.7828386342518
Trimmed Mean ( 8 / 24 )1262.6785714285718.065071901878469.8961276371824
Trimmed Mean ( 9 / 24 )1261.1111111111117.344530866817572.7094391191517
Trimmed Mean ( 10 / 24 )1259.8076923076916.687936016561975.4921214377499
Trimmed Mean ( 11 / 24 )1258.616.046514021584278.4344810534584
Trimmed Mean ( 12 / 24 )1257.7083333333315.434716049068381.4856800303271
Trimmed Mean ( 13 / 24 )1257.1739130434815.047149868883683.5489726624723
Trimmed Mean ( 14 / 24 )1256.8181818181814.60824844205186.0348307193579
Trimmed Mean ( 15 / 24 )1256.1904761904814.09566774308389.1189051194056
Trimmed Mean ( 16 / 24 )1255.513.409000039200693.6311429882617
Trimmed Mean ( 17 / 24 )1254.7368421052612.757932528616598.3495436498697
Trimmed Mean ( 18 / 24 )1253.7511.9046726187128105.315789871386
Trimmed Mean ( 19 / 24 )1253.5294117647111.3062407083719110.870575295333
Trimmed Mean ( 20 / 24 )1253.5937510.9116558143522114.885748902667
Trimmed Mean ( 21 / 24 )1253.8333333333310.6179292451937118.086427624379
Trimmed Mean ( 22 / 24 )1254.1071428571410.2870622095915121.911107107706
Trimmed Mean ( 23 / 24 )1254.423076923089.90464895924723126.649927936307
Trimmed Mean ( 24 / 24 )1254.791666666679.27869211772106135.233678491194
Median1265
Midrange1350
Midmean - Weighted Average at Xnp1250
Midmean - Weighted Average at X(n+1)p1253.75
Midmean - Empirical Distribution Function1250
Midmean - Empirical Distribution Function - Averaging1253.75
Midmean - Empirical Distribution Function - Interpolation1253.75
Midmean - Closest Observation1250
Midmean - True Basic - Statistics Graphics Toolkit1253.75
Midmean - MS Excel (old versions)1259.23076923077
Number of observations72


Parameters (Session):
Parameters (R input):
R code (references can be found in the software module):
geomean <- function(x) {
return(exp(mean(log(x))))
}
harmean <- function(x) {
return(1/mean(1/x))
}
quamean <- function(x) {
return(sqrt(mean(x*x)))
}
winmean <- function(x) {
x <-sort(x[!is.na(x)])
n<-length(x)
denom <- 3
nodenom <- n/denom
if (nodenom>40) denom <- n/40
sqrtn = sqrt(n)
roundnodenom = floor(nodenom)
win <- array(NA,dim=c(roundnodenom,2))
for (j in 1:roundnodenom) {
win[j,1] <- (j*x[j+1]+sum(x[(j+1):(n-j)])+j*x[n-j])/n
win[j,2] <- sd(c(rep(x[j+1],j),x[(j+1):(n-j)],rep(x[n-j],j)))/sqrtn
}
return(win)
}
trimean <- function(x) {
x <-sort(x[!is.na(x)])
n<-length(x)
denom <- 3
nodenom <- n/denom
if (nodenom>40) denom <- n/40
sqrtn = sqrt(n)
roundnodenom = floor(nodenom)
tri <- array(NA,dim=c(roundnodenom,2))
for (j in 1:roundnodenom) {
tri[j,1] <- mean(x,trim=j/n)
tri[j,2] <- sd(x[(j+1):(n-j)]) / sqrt(n-j*2)
}
return(tri)
}
midrange <- function(x) {
return((max(x)+min(x))/2)
}
q1 <- function(data,n,p,i,f) {
np <- n*p;
i <<- floor(np)
f <<- np - i
qvalue <- (1-f)*data[i] + f*data[i+1]
}
q2 <- function(data,n,p,i,f) {
np <- (n+1)*p
i <<- floor(np)
f <<- np - i
qvalue <- (1-f)*data[i] + f*data[i+1]
}
q3 <- function(data,n,p,i,f) {
np <- n*p
i <<- floor(np)
f <<- np - i
if (f==0) {
qvalue <- data[i]
} else {
qvalue <- data[i+1]
}
}
q4 <- function(data,n,p,i,f) {
np <- n*p
i <<- floor(np)
f <<- np - i
if (f==0) {
qvalue <- (data[i]+data[i+1])/2
} else {
qvalue <- data[i+1]
}
}
q5 <- function(data,n,p,i,f) {
np <- (n-1)*p
i <<- floor(np)
f <<- np - i
if (f==0) {
qvalue <- data[i+1]
} else {
qvalue <- data[i+1] + f*(data[i+2]-data[i+1])
}
}
q6 <- function(data,n,p,i,f) {
np <- n*p+0.5
i <<- floor(np)
f <<- np - i
qvalue <- data[i]
}
q7 <- function(data,n,p,i,f) {
np <- (n+1)*p
i <<- floor(np)
f <<- np - i
if (f==0) {
qvalue <- data[i]
} else {
qvalue <- f*data[i] + (1-f)*data[i+1]
}
}
q8 <- function(data,n,p,i,f) {
np <- (n+1)*p
i <<- floor(np)
f <<- np - i
if (f==0) {
qvalue <- data[i]
} else {
if (f == 0.5) {
qvalue <- (data[i]+data[i+1])/2
} else {
if (f < 0.5) {
qvalue <- data[i]
} else {
qvalue <- data[i+1]
}
}
}
}
midmean <- function(x,def) {
x <-sort(x[!is.na(x)])
n<-length(x)
if (def==1) {
qvalue1 <- q1(x,n,0.25,i,f)
qvalue3 <- q1(x,n,0.75,i,f)
}
if (def==2) {
qvalue1 <- q2(x,n,0.25,i,f)
qvalue3 <- q2(x,n,0.75,i,f)
}
if (def==3) {
qvalue1 <- q3(x,n,0.25,i,f)
qvalue3 <- q3(x,n,0.75,i,f)
}
if (def==4) {
qvalue1 <- q4(x,n,0.25,i,f)
qvalue3 <- q4(x,n,0.75,i,f)
}
if (def==5) {
qvalue1 <- q5(x,n,0.25,i,f)
qvalue3 <- q5(x,n,0.75,i,f)
}
if (def==6) {
qvalue1 <- q6(x,n,0.25,i,f)
qvalue3 <- q6(x,n,0.75,i,f)
}
if (def==7) {
qvalue1 <- q7(x,n,0.25,i,f)
qvalue3 <- q7(x,n,0.75,i,f)
}
if (def==8) {
qvalue1 <- q8(x,n,0.25,i,f)
qvalue3 <- q8(x,n,0.75,i,f)
}
midm <- 0
myn <- 0
roundno4 <- round(n/4)
round3no4 <- round(3*n/4)
for (i in 1:n) {
if ((x[i]>=qvalue1) & (x[i]<=qvalue3)){
midm = midm + x[i]
myn = myn + 1
}
}
midm = midm / myn
return(midm)
}
(arm <- mean(x))
sqrtn <- sqrt(length(x))
(armse <- sd(x) / sqrtn)
(armose <- arm / armse)
(geo <- geomean(x))
(har <- harmean(x))
(qua <- quamean(x))
(win <- winmean(x))
(tri <- trimean(x))
(midr <- midrange(x))
midm <- array(NA,dim=8)
for (j in 1:8) midm[j] <- midmean(x,j)
midm
bitmap(file='test1.png')
lb <- win[,1] - 2*win[,2]
ub <- win[,1] + 2*win[,2]
if ((ylimmin == '') | (ylimmax == '')) plot(win[,1],type='b',main=main, xlab='j', pch=19, ylab='Winsorized Mean(j/n)', ylim=c(min(lb),max(ub))) else plot(win[,1],type='l',main=main, xlab='j', pch=19, ylab='Winsorized Mean(j/n)', ylim=c(ylimmin,ylimmax))
lines(ub,lty=3)
lines(lb,lty=3)
grid()
dev.off()
bitmap(file='test2.png')
lb <- tri[,1] - 2*tri[,2]
ub <- tri[,1] + 2*tri[,2]
if ((ylimmin == '') | (ylimmax == '')) plot(tri[,1],type='b',main=main, xlab='j', pch=19, ylab='Trimmed Mean(j/n)', ylim=c(min(lb),max(ub))) else plot(tri[,1],type='l',main=main, xlab='j', pch=19, ylab='Trimmed Mean(j/n)', ylim=c(ylimmin,ylimmax))
lines(ub,lty=3)
lines(lb,lty=3)
grid()
dev.off()
load(file='createtable')
a<-table.start()
a<-table.row.start(a)
a<-table.element(a,'Central Tendency - Ungrouped Data',4,TRUE)
a<-table.row.end(a)
a<-table.row.start(a)
a<-table.element(a,'Measure',header=TRUE)
a<-table.element(a,'Value',header=TRUE)
a<-table.element(a,'S.E.',header=TRUE)
a<-table.element(a,'Value/S.E.',header=TRUE)
a<-table.row.end(a)
a<-table.row.start(a)
a<-table.element(a,hyperlink('arithmetic_mean.htm', 'Arithmetic Mean', 'click to view the definition of the Arithmetic Mean'),header=TRUE)
a<-table.element(a,arm)
a<-table.element(a,hyperlink('arithmetic_mean_standard_error.htm', armse, 'click to view the definition of the Standard Error of the Arithmetic Mean'))
a<-table.element(a,armose)
a<-table.row.end(a)
a<-table.row.start(a)
a<-table.element(a,hyperlink('geometric_mean.htm', 'Geometric Mean', 'click to view the definition of the Geometric Mean'),header=TRUE)
a<-table.element(a,geo)
a<-table.element(a,'')
a<-table.row.end(a)
a<-table.row.start(a)
a<-table.element(a,hyperlink('harmonic_mean.htm', 'Harmonic Mean', 'click to view the definition of the Harmonic Mean'),header=TRUE)
a<-table.element(a,har)
a<-table.element(a,'')
a<-table.row.end(a)
a<-table.row.start(a)
a<-table.element(a,hyperlink('quadratic_mean.htm', 'Quadratic Mean', 'click to view the definition of the Quadratic Mean'),header=TRUE)
a<-table.element(a,qua)
a<-table.element(a,'')
a<-table.row.end(a)
for (j in 1:length(win[,1])) {
a<-table.row.start(a)
mylabel <- paste('Winsorized Mean (',j)
mylabel <- paste(mylabel,'/')
mylabel <- paste(mylabel,length(win[,1]))
mylabel <- paste(mylabel,')')
a<-table.element(a,hyperlink('winsorized_mean.htm', mylabel, 'click to view the definition of the Winsorized Mean'),header=TRUE)
a<-table.element(a,win[j,1])
a<-table.element(a,win[j,2])
a<-table.element(a,win[j,1]/win[j,2])
a<-table.row.end(a)
}
for (j in 1:length(tri[,1])) {
a<-table.row.start(a)
mylabel <- paste('Trimmed Mean (',j)
mylabel <- paste(mylabel,'/')
mylabel <- paste(mylabel,length(tri[,1]))
mylabel <- paste(mylabel,')')
a<-table.element(a,hyperlink('arithmetic_mean.htm', mylabel, 'click to view the definition of the Trimmed Mean'),header=TRUE)
a<-table.element(a,tri[j,1])
a<-table.element(a,tri[j,2])
a<-table.element(a,tri[j,1]/tri[j,2])
a<-table.row.end(a)
}
a<-table.row.start(a)
a<-table.element(a,hyperlink('median_1.htm', 'Median', 'click to view the definition of the Median'),header=TRUE)
a<-table.element(a,median(x))
a<-table.element(a,'')
a<-table.row.end(a)
a<-table.row.start(a)
a<-table.element(a,hyperlink('midrange.htm', 'Midrange', 'click to view the definition of the Midrange'),header=TRUE)
a<-table.element(a,midr)
a<-table.element(a,'')
a<-table.row.end(a)
a<-table.row.start(a)
mymid <- hyperlink('midmean.htm', 'Midmean', 'click to view the definition of the Midmean')
mylabel <- paste(mymid,hyperlink('method_1.htm','Weighted Average at Xnp',''),sep=' - ')
a<-table.element(a,mylabel,header=TRUE)
a<-table.element(a,midm[1])
a<-table.element(a,'')
a<-table.row.end(a)
a<-table.row.start(a)
mymid <- hyperlink('midmean.htm', 'Midmean', 'click to view the definition of the Midmean')
mylabel <- paste(mymid,hyperlink('method_2.htm','Weighted Average at X(n+1)p',''),sep=' - ')
a<-table.element(a,mylabel,header=TRUE)
a<-table.element(a,midm[2])
a<-table.element(a,'')
a<-table.row.end(a)
a<-table.row.start(a)
mymid <- hyperlink('midmean.htm', 'Midmean', 'click to view the definition of the Midmean')
mylabel <- paste(mymid,hyperlink('method_3.htm','Empirical Distribution Function',''),sep=' - ')
a<-table.element(a,mylabel,header=TRUE)
a<-table.element(a,midm[3])
a<-table.element(a,'')
a<-table.row.end(a)
a<-table.row.start(a)
mymid <- hyperlink('midmean.htm', 'Midmean', 'click to view the definition of the Midmean')
mylabel <- paste(mymid,hyperlink('method_4.htm','Empirical Distribution Function - Averaging',''),sep=' - ')
a<-table.element(a,mylabel,header=TRUE)
a<-table.element(a,midm[4])
a<-table.element(a,'')
a<-table.row.end(a)
a<-table.row.start(a)
mymid <- hyperlink('midmean.htm', 'Midmean', 'click to view the definition of the Midmean')
mylabel <- paste(mymid,hyperlink('method_5.htm','Empirical Distribution Function - Interpolation',''),sep=' - ')
a<-table.element(a,mylabel,header=TRUE)
a<-table.element(a,midm[5])
a<-table.element(a,'')
a<-table.row.end(a)
a<-table.row.start(a)
mymid <- hyperlink('midmean.htm', 'Midmean', 'click to view the definition of the Midmean')
mylabel <- paste(mymid,hyperlink('method_6.htm','Closest Observation',''),sep=' - ')
a<-table.element(a,mylabel,header=TRUE)
a<-table.element(a,midm[6])
a<-table.element(a,'')
a<-table.row.end(a)
a<-table.row.start(a)
mymid <- hyperlink('midmean.htm', 'Midmean', 'click to view the definition of the Midmean')
mylabel <- paste(mymid,hyperlink('method_7.htm','True Basic - Statistics Graphics Toolkit',''),sep=' - ')
a<-table.element(a,mylabel,header=TRUE)
a<-table.element(a,midm[7])
a<-table.element(a,'')
a<-table.row.end(a)
a<-table.row.start(a)
mymid <- hyperlink('midmean.htm', 'Midmean', 'click to view the definition of the Midmean')
mylabel <- paste(mymid,hyperlink('method_8.htm','MS Excel (old versions)',''),sep=' - ')
a<-table.element(a,mylabel,header=TRUE)
a<-table.element(a,midm[8])
a<-table.element(a,'')
a<-table.row.end(a)
a<-table.row.start(a)
a<-table.element(a,'Number of observations',header=TRUE)
a<-table.element(a,length(x))
a<-table.element(a,'')
a<-table.row.end(a)
a<-table.end(a)
table.save(a,file='mytable.tab')