Free Statistics

of Irreproducible Research!

Author's title

Author*Unverified author*
R Software Modulerwasp_centraltendency.wasp
Title produced by softwareCentral Tendency
Date of computationSat, 11 Oct 2014 18:49:33 +0100
Cite this page as followsStatistical Computations at FreeStatistics.org, Office for Research Development and Education, URL https://freestatistics.org/blog/index.php?v=date/2014/Oct/11/t1413050044hnqq6raewrcq352.htm/, Retrieved Mon, 13 May 2024 21:13:25 +0000
Statistical Computations at FreeStatistics.org, Office for Research Development and Education, URL https://freestatistics.org/blog/index.php?pk=240507, Retrieved Mon, 13 May 2024 21:13:25 +0000
QR Codes:

Original text written by user:
IsPrivate?No (this computation is public)
User-defined keywords
Estimated Impact85
Family? (F = Feedback message, R = changed R code, M = changed R Module, P = changed Parameters, D = changed Data)
-       [Central Tendency] [] [2014-10-11 17:49:33] [09c39f9cdae305b47e6b113e2a46d5a6] [Current]
Feedback Forum

Post a new message
Dataseries X:
517
508
493
490
469
478
528
534
518
506
502
516
528
533
536
537
524
536
587
597
581
564
558
575
580
575
563
552
537
545
601
604
586
564
549
551
556
548
540
531
521
519
572
581
563
548
539
541
562
559
546
536
528
530
582
599
584
571
563
565
578
572
565
561
551
553
611
622
613
599
591
596


Summary of computational transaction
Raw Inputview raw input (R code)
Raw Outputview raw output of R engine
Computing time2 seconds
R Server'Sir Maurice George Kendall' @ kendall.wessa.net

\begin{tabular}{lllllllll}
\hline
Summary of computational transaction \tabularnewline
Raw Input & view raw input (R code)  \tabularnewline
Raw Output & view raw output of R engine  \tabularnewline
Computing time & 2 seconds \tabularnewline
R Server & 'Sir Maurice George Kendall' @ kendall.wessa.net \tabularnewline
\hline
\end{tabular}
%Source: https://freestatistics.org/blog/index.php?pk=240507&T=0

[TABLE]
[ROW][C]Summary of computational transaction[/C][/ROW]
[ROW][C]Raw Input[/C][C]view raw input (R code) [/C][/ROW]
[ROW][C]Raw Output[/C][C]view raw output of R engine [/C][/ROW]
[ROW][C]Computing time[/C][C]2 seconds[/C][/ROW]
[ROW][C]R Server[/C][C]'Sir Maurice George Kendall' @ kendall.wessa.net[/C][/ROW]
[/TABLE]
Source: https://freestatistics.org/blog/index.php?pk=240507&T=0

Globally Unique Identifier (entire table): ba.freestatistics.org/blog/index.php?pk=240507&T=0

As an alternative you can also use a QR Code:  

The GUIDs for individual cells are displayed in the table below:

Summary of computational transaction
Raw Inputview raw input (R code)
Raw Outputview raw output of R engine
Computing time2 seconds
R Server'Sir Maurice George Kendall' @ kendall.wessa.net


Central Tendency - Ungrouped Data
MeasureValueS.E.Value/S.E.
Arithmetic Mean553.0277777777783.85170999472942143.579807029742
Geometric Mean552.063851438833
Harmonic Mean551.087672692683
Quadratic Mean553.979291630613
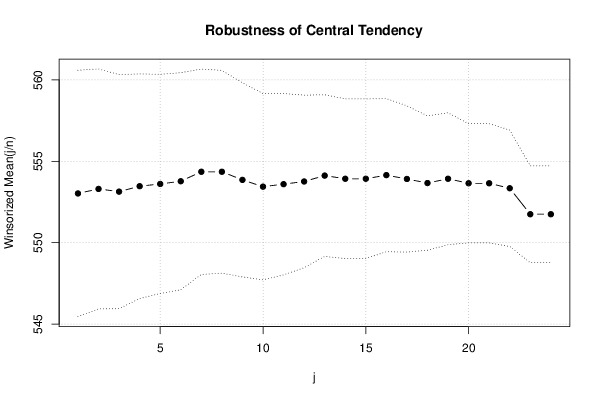
Winsorized Mean ( 1 / 24 )553.0277777777783.78531737506611146.09812678339
Winsorized Mean ( 2 / 24 )553.3055555555563.68606896525597150.107217409898
Winsorized Mean ( 3 / 24 )553.1388888888893.59497266535016153.86456042358
Winsorized Mean ( 4 / 24 )553.4722222222223.45063398396921160.397255922684
Winsorized Mean ( 5 / 24 )553.6111111111113.36711494456372164.417051459716
Winsorized Mean ( 6 / 24 )553.7777777777783.33440254109094166.080061106418
Winsorized Mean ( 7 / 24 )554.3611111111113.15529869295549175.692118260872
Winsorized Mean ( 8 / 24 )554.3611111111113.11536813321635177.944014128045
Winsorized Mean ( 9 / 24 )553.8611111111112.98045967741807185.830768088402
Winsorized Mean ( 10 / 24 )553.4444444444442.8622447121464193.360281912938
Winsorized Mean ( 11 / 24 )553.5972222222222.78603574931973198.704278061541
Winsorized Mean ( 12 / 24 )553.7638888888892.65117957740056208.874530269219
Winsorized Mean ( 13 / 24 )554.1252.4828785779542223.178452994097
Winsorized Mean ( 14 / 24 )553.9305555555562.45238908051429225.873846836486
Winsorized Mean ( 15 / 24 )553.9305555555562.45238908051429225.873846836486
Winsorized Mean ( 16 / 24 )554.1527777777782.35267467759242235.541608474684
Winsorized Mean ( 17 / 24 )553.9166666666672.24643257442197246.576137193522
Winsorized Mean ( 18 / 24 )553.6666666666672.0639236680818268.259274908767
Winsorized Mean ( 19 / 24 )553.9305555555562.02704005595701273.27065093148
Winsorized Mean ( 20 / 24 )553.6527777777781.83089463519577302.394669324364
Winsorized Mean ( 21 / 24 )553.6527777777781.83089463519577302.394669324364
Winsorized Mean ( 22 / 24 )553.3472222222221.78808433462292309.463715725084
Winsorized Mean ( 23 / 24 )551.751.48949766243018370.426898891399
Winsorized Mean ( 24 / 24 )551.751.48949766243018370.426898891399
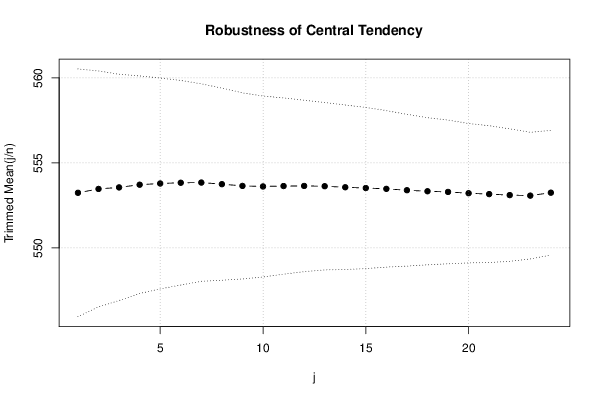
Trimmed Mean ( 1 / 24 )553.2428571428573.64066267682304151.962130593663
Trimmed Mean ( 2 / 24 )553.4705882352943.46761453531265159.611335861871
Trimmed Mean ( 3 / 24 )553.5606060606063.32554769927851166.456973743213
Trimmed Mean ( 4 / 24 )553.718753.19780033137239173.156136287709
Trimmed Mean ( 5 / 24 )553.7903225806453.09894449002991178.702885567111
Trimmed Mean ( 6 / 24 )553.8333333333333.00622392671467184.228902049418
Trimmed Mean ( 7 / 24 )553.8448275862072.9025096806978190.815841638487
Trimmed Mean ( 8 / 24 )553.752.82363057257666196.112765380169
Trimmed Mean ( 9 / 24 )553.6481481481482.73576072194701202.374478040654
Trimmed Mean ( 10 / 24 )553.6153846153852.65927810974571208.1825825537
Trimmed Mean ( 11 / 24 )553.642.59052590988701213.71722162167
Trimmed Mean ( 12 / 24 )553.6458333333332.52021781946819219.681739037208
Trimmed Mean ( 13 / 24 )553.6304347826092.46018708209172225.035908371609
Trimmed Mean ( 14 / 24 )553.5681818181822.41852385554147228.886798263252
Trimmed Mean ( 15 / 24 )553.523809523812.36855074485191233.697255896629
Trimmed Mean ( 16 / 24 )553.4752.30021947113414240.618344008324
Trimmed Mean ( 17 / 24 )553.3947368421052.23114494961209248.031727807877
Trimmed Mean ( 18 / 24 )553.3333333333332.16245010952634255.88258933499
Trimmed Mean ( 19 / 24 )553.2941176470592.11291310836536261.863166760848
Trimmed Mean ( 20 / 24 )553.218752.0491611063846269.973282372152
Trimmed Mean ( 21 / 24 )553.1666666666672.0103658575558275.157213095136
Trimmed Mean ( 22 / 24 )553.1071428571431.94728089197733284.040759161099
Trimmed Mean ( 23 / 24 )553.0769230769231.86211052875542297.016162325544
Trimmed Mean ( 24 / 24 )553.251.83193293023232302.003414464436
Median552.5
Midrange545.5
Midmean - Weighted Average at Xnp552.72972972973
Midmean - Weighted Average at X(n+1)p553.333333333333
Midmean - Empirical Distribution Function552.72972972973
Midmean - Empirical Distribution Function - Averaging553.333333333333
Midmean - Empirical Distribution Function - Interpolation553.333333333333
Midmean - Closest Observation552.72972972973
Midmean - True Basic - Statistics Graphics Toolkit553.333333333333
Midmean - MS Excel (old versions)553.394736842105
Number of observations72

\begin{tabular}{lllllllll}
\hline
Central Tendency - Ungrouped Data \tabularnewline
Measure & Value & S.E. & Value/S.E. \tabularnewline
Arithmetic Mean & 553.027777777778 & 3.85170999472942 & 143.579807029742 \tabularnewline
Geometric Mean & 552.063851438833 &  &  \tabularnewline
Harmonic Mean & 551.087672692683 &  &  \tabularnewline
Quadratic Mean & 553.979291630613 &  &  \tabularnewline
Winsorized Mean ( 1 / 24 ) & 553.027777777778 & 3.78531737506611 & 146.09812678339 \tabularnewline
Winsorized Mean ( 2 / 24 ) & 553.305555555556 & 3.68606896525597 & 150.107217409898 \tabularnewline
Winsorized Mean ( 3 / 24 ) & 553.138888888889 & 3.59497266535016 & 153.86456042358 \tabularnewline
Winsorized Mean ( 4 / 24 ) & 553.472222222222 & 3.45063398396921 & 160.397255922684 \tabularnewline
Winsorized Mean ( 5 / 24 ) & 553.611111111111 & 3.36711494456372 & 164.417051459716 \tabularnewline
Winsorized Mean ( 6 / 24 ) & 553.777777777778 & 3.33440254109094 & 166.080061106418 \tabularnewline
Winsorized Mean ( 7 / 24 ) & 554.361111111111 & 3.15529869295549 & 175.692118260872 \tabularnewline
Winsorized Mean ( 8 / 24 ) & 554.361111111111 & 3.11536813321635 & 177.944014128045 \tabularnewline
Winsorized Mean ( 9 / 24 ) & 553.861111111111 & 2.98045967741807 & 185.830768088402 \tabularnewline
Winsorized Mean ( 10 / 24 ) & 553.444444444444 & 2.8622447121464 & 193.360281912938 \tabularnewline
Winsorized Mean ( 11 / 24 ) & 553.597222222222 & 2.78603574931973 & 198.704278061541 \tabularnewline
Winsorized Mean ( 12 / 24 ) & 553.763888888889 & 2.65117957740056 & 208.874530269219 \tabularnewline
Winsorized Mean ( 13 / 24 ) & 554.125 & 2.4828785779542 & 223.178452994097 \tabularnewline
Winsorized Mean ( 14 / 24 ) & 553.930555555556 & 2.45238908051429 & 225.873846836486 \tabularnewline
Winsorized Mean ( 15 / 24 ) & 553.930555555556 & 2.45238908051429 & 225.873846836486 \tabularnewline
Winsorized Mean ( 16 / 24 ) & 554.152777777778 & 2.35267467759242 & 235.541608474684 \tabularnewline
Winsorized Mean ( 17 / 24 ) & 553.916666666667 & 2.24643257442197 & 246.576137193522 \tabularnewline
Winsorized Mean ( 18 / 24 ) & 553.666666666667 & 2.0639236680818 & 268.259274908767 \tabularnewline
Winsorized Mean ( 19 / 24 ) & 553.930555555556 & 2.02704005595701 & 273.27065093148 \tabularnewline
Winsorized Mean ( 20 / 24 ) & 553.652777777778 & 1.83089463519577 & 302.394669324364 \tabularnewline
Winsorized Mean ( 21 / 24 ) & 553.652777777778 & 1.83089463519577 & 302.394669324364 \tabularnewline
Winsorized Mean ( 22 / 24 ) & 553.347222222222 & 1.78808433462292 & 309.463715725084 \tabularnewline
Winsorized Mean ( 23 / 24 ) & 551.75 & 1.48949766243018 & 370.426898891399 \tabularnewline
Winsorized Mean ( 24 / 24 ) & 551.75 & 1.48949766243018 & 370.426898891399 \tabularnewline
Trimmed Mean ( 1 / 24 ) & 553.242857142857 & 3.64066267682304 & 151.962130593663 \tabularnewline
Trimmed Mean ( 2 / 24 ) & 553.470588235294 & 3.46761453531265 & 159.611335861871 \tabularnewline
Trimmed Mean ( 3 / 24 ) & 553.560606060606 & 3.32554769927851 & 166.456973743213 \tabularnewline
Trimmed Mean ( 4 / 24 ) & 553.71875 & 3.19780033137239 & 173.156136287709 \tabularnewline
Trimmed Mean ( 5 / 24 ) & 553.790322580645 & 3.09894449002991 & 178.702885567111 \tabularnewline
Trimmed Mean ( 6 / 24 ) & 553.833333333333 & 3.00622392671467 & 184.228902049418 \tabularnewline
Trimmed Mean ( 7 / 24 ) & 553.844827586207 & 2.9025096806978 & 190.815841638487 \tabularnewline
Trimmed Mean ( 8 / 24 ) & 553.75 & 2.82363057257666 & 196.112765380169 \tabularnewline
Trimmed Mean ( 9 / 24 ) & 553.648148148148 & 2.73576072194701 & 202.374478040654 \tabularnewline
Trimmed Mean ( 10 / 24 ) & 553.615384615385 & 2.65927810974571 & 208.1825825537 \tabularnewline
Trimmed Mean ( 11 / 24 ) & 553.64 & 2.59052590988701 & 213.71722162167 \tabularnewline
Trimmed Mean ( 12 / 24 ) & 553.645833333333 & 2.52021781946819 & 219.681739037208 \tabularnewline
Trimmed Mean ( 13 / 24 ) & 553.630434782609 & 2.46018708209172 & 225.035908371609 \tabularnewline
Trimmed Mean ( 14 / 24 ) & 553.568181818182 & 2.41852385554147 & 228.886798263252 \tabularnewline
Trimmed Mean ( 15 / 24 ) & 553.52380952381 & 2.36855074485191 & 233.697255896629 \tabularnewline
Trimmed Mean ( 16 / 24 ) & 553.475 & 2.30021947113414 & 240.618344008324 \tabularnewline
Trimmed Mean ( 17 / 24 ) & 553.394736842105 & 2.23114494961209 & 248.031727807877 \tabularnewline
Trimmed Mean ( 18 / 24 ) & 553.333333333333 & 2.16245010952634 & 255.88258933499 \tabularnewline
Trimmed Mean ( 19 / 24 ) & 553.294117647059 & 2.11291310836536 & 261.863166760848 \tabularnewline
Trimmed Mean ( 20 / 24 ) & 553.21875 & 2.0491611063846 & 269.973282372152 \tabularnewline
Trimmed Mean ( 21 / 24 ) & 553.166666666667 & 2.0103658575558 & 275.157213095136 \tabularnewline
Trimmed Mean ( 22 / 24 ) & 553.107142857143 & 1.94728089197733 & 284.040759161099 \tabularnewline
Trimmed Mean ( 23 / 24 ) & 553.076923076923 & 1.86211052875542 & 297.016162325544 \tabularnewline
Trimmed Mean ( 24 / 24 ) & 553.25 & 1.83193293023232 & 302.003414464436 \tabularnewline
Median & 552.5 &  &  \tabularnewline
Midrange & 545.5 &  &  \tabularnewline
Midmean - Weighted Average at Xnp & 552.72972972973 &  &  \tabularnewline
Midmean - Weighted Average at X(n+1)p & 553.333333333333 &  &  \tabularnewline
Midmean - Empirical Distribution Function & 552.72972972973 &  &  \tabularnewline
Midmean - Empirical Distribution Function - Averaging & 553.333333333333 &  &  \tabularnewline
Midmean - Empirical Distribution Function - Interpolation & 553.333333333333 &  &  \tabularnewline
Midmean - Closest Observation & 552.72972972973 &  &  \tabularnewline
Midmean - True Basic - Statistics Graphics Toolkit & 553.333333333333 &  &  \tabularnewline
Midmean - MS Excel (old versions) & 553.394736842105 &  &  \tabularnewline
Number of observations & 72 &  &  \tabularnewline
\hline
\end{tabular}
%Source: https://freestatistics.org/blog/index.php?pk=240507&T=1

[TABLE]
[ROW][C]Central Tendency - Ungrouped Data[/C][/ROW]
[ROW][C]Measure[/C][C]Value[/C][C]S.E.[/C][C]Value/S.E.[/C][/ROW]
[ROW][C]Arithmetic Mean[/C][C]553.027777777778[/C][C]3.85170999472942[/C][C]143.579807029742[/C][/ROW]
[ROW][C]Geometric Mean[/C][C]552.063851438833[/C][C][/C][C][/C][/ROW]
[ROW][C]Harmonic Mean[/C][C]551.087672692683[/C][C][/C][C][/C][/ROW]
[ROW][C]Quadratic Mean[/C][C]553.979291630613[/C][C][/C][C][/C][/ROW]
[ROW][C]Winsorized Mean ( 1 / 24 )[/C][C]553.027777777778[/C][C]3.78531737506611[/C][C]146.09812678339[/C][/ROW]
[ROW][C]Winsorized Mean ( 2 / 24 )[/C][C]553.305555555556[/C][C]3.68606896525597[/C][C]150.107217409898[/C][/ROW]
[ROW][C]Winsorized Mean ( 3 / 24 )[/C][C]553.138888888889[/C][C]3.59497266535016[/C][C]153.86456042358[/C][/ROW]
[ROW][C]Winsorized Mean ( 4 / 24 )[/C][C]553.472222222222[/C][C]3.45063398396921[/C][C]160.397255922684[/C][/ROW]
[ROW][C]Winsorized Mean ( 5 / 24 )[/C][C]553.611111111111[/C][C]3.36711494456372[/C][C]164.417051459716[/C][/ROW]
[ROW][C]Winsorized Mean ( 6 / 24 )[/C][C]553.777777777778[/C][C]3.33440254109094[/C][C]166.080061106418[/C][/ROW]
[ROW][C]Winsorized Mean ( 7 / 24 )[/C][C]554.361111111111[/C][C]3.15529869295549[/C][C]175.692118260872[/C][/ROW]
[ROW][C]Winsorized Mean ( 8 / 24 )[/C][C]554.361111111111[/C][C]3.11536813321635[/C][C]177.944014128045[/C][/ROW]
[ROW][C]Winsorized Mean ( 9 / 24 )[/C][C]553.861111111111[/C][C]2.98045967741807[/C][C]185.830768088402[/C][/ROW]
[ROW][C]Winsorized Mean ( 10 / 24 )[/C][C]553.444444444444[/C][C]2.8622447121464[/C][C]193.360281912938[/C][/ROW]
[ROW][C]Winsorized Mean ( 11 / 24 )[/C][C]553.597222222222[/C][C]2.78603574931973[/C][C]198.704278061541[/C][/ROW]
[ROW][C]Winsorized Mean ( 12 / 24 )[/C][C]553.763888888889[/C][C]2.65117957740056[/C][C]208.874530269219[/C][/ROW]
[ROW][C]Winsorized Mean ( 13 / 24 )[/C][C]554.125[/C][C]2.4828785779542[/C][C]223.178452994097[/C][/ROW]
[ROW][C]Winsorized Mean ( 14 / 24 )[/C][C]553.930555555556[/C][C]2.45238908051429[/C][C]225.873846836486[/C][/ROW]
[ROW][C]Winsorized Mean ( 15 / 24 )[/C][C]553.930555555556[/C][C]2.45238908051429[/C][C]225.873846836486[/C][/ROW]
[ROW][C]Winsorized Mean ( 16 / 24 )[/C][C]554.152777777778[/C][C]2.35267467759242[/C][C]235.541608474684[/C][/ROW]
[ROW][C]Winsorized Mean ( 17 / 24 )[/C][C]553.916666666667[/C][C]2.24643257442197[/C][C]246.576137193522[/C][/ROW]
[ROW][C]Winsorized Mean ( 18 / 24 )[/C][C]553.666666666667[/C][C]2.0639236680818[/C][C]268.259274908767[/C][/ROW]
[ROW][C]Winsorized Mean ( 19 / 24 )[/C][C]553.930555555556[/C][C]2.02704005595701[/C][C]273.27065093148[/C][/ROW]
[ROW][C]Winsorized Mean ( 20 / 24 )[/C][C]553.652777777778[/C][C]1.83089463519577[/C][C]302.394669324364[/C][/ROW]
[ROW][C]Winsorized Mean ( 21 / 24 )[/C][C]553.652777777778[/C][C]1.83089463519577[/C][C]302.394669324364[/C][/ROW]
[ROW][C]Winsorized Mean ( 22 / 24 )[/C][C]553.347222222222[/C][C]1.78808433462292[/C][C]309.463715725084[/C][/ROW]
[ROW][C]Winsorized Mean ( 23 / 24 )[/C][C]551.75[/C][C]1.48949766243018[/C][C]370.426898891399[/C][/ROW]
[ROW][C]Winsorized Mean ( 24 / 24 )[/C][C]551.75[/C][C]1.48949766243018[/C][C]370.426898891399[/C][/ROW]
[ROW][C]Trimmed Mean ( 1 / 24 )[/C][C]553.242857142857[/C][C]3.64066267682304[/C][C]151.962130593663[/C][/ROW]
[ROW][C]Trimmed Mean ( 2 / 24 )[/C][C]553.470588235294[/C][C]3.46761453531265[/C][C]159.611335861871[/C][/ROW]
[ROW][C]Trimmed Mean ( 3 / 24 )[/C][C]553.560606060606[/C][C]3.32554769927851[/C][C]166.456973743213[/C][/ROW]
[ROW][C]Trimmed Mean ( 4 / 24 )[/C][C]553.71875[/C][C]3.19780033137239[/C][C]173.156136287709[/C][/ROW]
[ROW][C]Trimmed Mean ( 5 / 24 )[/C][C]553.790322580645[/C][C]3.09894449002991[/C][C]178.702885567111[/C][/ROW]
[ROW][C]Trimmed Mean ( 6 / 24 )[/C][C]553.833333333333[/C][C]3.00622392671467[/C][C]184.228902049418[/C][/ROW]
[ROW][C]Trimmed Mean ( 7 / 24 )[/C][C]553.844827586207[/C][C]2.9025096806978[/C][C]190.815841638487[/C][/ROW]
[ROW][C]Trimmed Mean ( 8 / 24 )[/C][C]553.75[/C][C]2.82363057257666[/C][C]196.112765380169[/C][/ROW]
[ROW][C]Trimmed Mean ( 9 / 24 )[/C][C]553.648148148148[/C][C]2.73576072194701[/C][C]202.374478040654[/C][/ROW]
[ROW][C]Trimmed Mean ( 10 / 24 )[/C][C]553.615384615385[/C][C]2.65927810974571[/C][C]208.1825825537[/C][/ROW]
[ROW][C]Trimmed Mean ( 11 / 24 )[/C][C]553.64[/C][C]2.59052590988701[/C][C]213.71722162167[/C][/ROW]
[ROW][C]Trimmed Mean ( 12 / 24 )[/C][C]553.645833333333[/C][C]2.52021781946819[/C][C]219.681739037208[/C][/ROW]
[ROW][C]Trimmed Mean ( 13 / 24 )[/C][C]553.630434782609[/C][C]2.46018708209172[/C][C]225.035908371609[/C][/ROW]
[ROW][C]Trimmed Mean ( 14 / 24 )[/C][C]553.568181818182[/C][C]2.41852385554147[/C][C]228.886798263252[/C][/ROW]
[ROW][C]Trimmed Mean ( 15 / 24 )[/C][C]553.52380952381[/C][C]2.36855074485191[/C][C]233.697255896629[/C][/ROW]
[ROW][C]Trimmed Mean ( 16 / 24 )[/C][C]553.475[/C][C]2.30021947113414[/C][C]240.618344008324[/C][/ROW]
[ROW][C]Trimmed Mean ( 17 / 24 )[/C][C]553.394736842105[/C][C]2.23114494961209[/C][C]248.031727807877[/C][/ROW]
[ROW][C]Trimmed Mean ( 18 / 24 )[/C][C]553.333333333333[/C][C]2.16245010952634[/C][C]255.88258933499[/C][/ROW]
[ROW][C]Trimmed Mean ( 19 / 24 )[/C][C]553.294117647059[/C][C]2.11291310836536[/C][C]261.863166760848[/C][/ROW]
[ROW][C]Trimmed Mean ( 20 / 24 )[/C][C]553.21875[/C][C]2.0491611063846[/C][C]269.973282372152[/C][/ROW]
[ROW][C]Trimmed Mean ( 21 / 24 )[/C][C]553.166666666667[/C][C]2.0103658575558[/C][C]275.157213095136[/C][/ROW]
[ROW][C]Trimmed Mean ( 22 / 24 )[/C][C]553.107142857143[/C][C]1.94728089197733[/C][C]284.040759161099[/C][/ROW]
[ROW][C]Trimmed Mean ( 23 / 24 )[/C][C]553.076923076923[/C][C]1.86211052875542[/C][C]297.016162325544[/C][/ROW]
[ROW][C]Trimmed Mean ( 24 / 24 )[/C][C]553.25[/C][C]1.83193293023232[/C][C]302.003414464436[/C][/ROW]
[ROW][C]Median[/C][C]552.5[/C][C][/C][C][/C][/ROW]
[ROW][C]Midrange[/C][C]545.5[/C][C][/C][C][/C][/ROW]
[ROW][C]Midmean - Weighted Average at Xnp[/C][C]552.72972972973[/C][C][/C][C][/C][/ROW]
[ROW][C]Midmean - Weighted Average at X(n+1)p[/C][C]553.333333333333[/C][C][/C][C][/C][/ROW]
[ROW][C]Midmean - Empirical Distribution Function[/C][C]552.72972972973[/C][C][/C][C][/C][/ROW]
[ROW][C]Midmean - Empirical Distribution Function - Averaging[/C][C]553.333333333333[/C][C][/C][C][/C][/ROW]
[ROW][C]Midmean - Empirical Distribution Function - Interpolation[/C][C]553.333333333333[/C][C][/C][C][/C][/ROW]
[ROW][C]Midmean - Closest Observation[/C][C]552.72972972973[/C][C][/C][C][/C][/ROW]
[ROW][C]Midmean - True Basic - Statistics Graphics Toolkit[/C][C]553.333333333333[/C][C][/C][C][/C][/ROW]
[ROW][C]Midmean - MS Excel (old versions)[/C][C]553.394736842105[/C][C][/C][C][/C][/ROW]
[ROW][C]Number of observations[/C][C]72[/C][C][/C][C][/C][/ROW]
[/TABLE]
Source: https://freestatistics.org/blog/index.php?pk=240507&T=1

Globally Unique Identifier (entire table): ba.freestatistics.org/blog/index.php?pk=240507&T=1

As an alternative you can also use a QR Code:  

The GUIDs for individual cells are displayed in the table below:

Central Tendency - Ungrouped Data
MeasureValueS.E.Value/S.E.
Arithmetic Mean553.0277777777783.85170999472942143.579807029742
Geometric Mean552.063851438833
Harmonic Mean551.087672692683
Quadratic Mean553.979291630613
Winsorized Mean ( 1 / 24 )553.0277777777783.78531737506611146.09812678339
Winsorized Mean ( 2 / 24 )553.3055555555563.68606896525597150.107217409898
Winsorized Mean ( 3 / 24 )553.1388888888893.59497266535016153.86456042358
Winsorized Mean ( 4 / 24 )553.4722222222223.45063398396921160.397255922684
Winsorized Mean ( 5 / 24 )553.6111111111113.36711494456372164.417051459716
Winsorized Mean ( 6 / 24 )553.7777777777783.33440254109094166.080061106418
Winsorized Mean ( 7 / 24 )554.3611111111113.15529869295549175.692118260872
Winsorized Mean ( 8 / 24 )554.3611111111113.11536813321635177.944014128045
Winsorized Mean ( 9 / 24 )553.8611111111112.98045967741807185.830768088402
Winsorized Mean ( 10 / 24 )553.4444444444442.8622447121464193.360281912938
Winsorized Mean ( 11 / 24 )553.5972222222222.78603574931973198.704278061541
Winsorized Mean ( 12 / 24 )553.7638888888892.65117957740056208.874530269219
Winsorized Mean ( 13 / 24 )554.1252.4828785779542223.178452994097
Winsorized Mean ( 14 / 24 )553.9305555555562.45238908051429225.873846836486
Winsorized Mean ( 15 / 24 )553.9305555555562.45238908051429225.873846836486
Winsorized Mean ( 16 / 24 )554.1527777777782.35267467759242235.541608474684
Winsorized Mean ( 17 / 24 )553.9166666666672.24643257442197246.576137193522
Winsorized Mean ( 18 / 24 )553.6666666666672.0639236680818268.259274908767
Winsorized Mean ( 19 / 24 )553.9305555555562.02704005595701273.27065093148
Winsorized Mean ( 20 / 24 )553.6527777777781.83089463519577302.394669324364
Winsorized Mean ( 21 / 24 )553.6527777777781.83089463519577302.394669324364
Winsorized Mean ( 22 / 24 )553.3472222222221.78808433462292309.463715725084
Winsorized Mean ( 23 / 24 )551.751.48949766243018370.426898891399
Winsorized Mean ( 24 / 24 )551.751.48949766243018370.426898891399
Trimmed Mean ( 1 / 24 )553.2428571428573.64066267682304151.962130593663
Trimmed Mean ( 2 / 24 )553.4705882352943.46761453531265159.611335861871
Trimmed Mean ( 3 / 24 )553.5606060606063.32554769927851166.456973743213
Trimmed Mean ( 4 / 24 )553.718753.19780033137239173.156136287709
Trimmed Mean ( 5 / 24 )553.7903225806453.09894449002991178.702885567111
Trimmed Mean ( 6 / 24 )553.8333333333333.00622392671467184.228902049418
Trimmed Mean ( 7 / 24 )553.8448275862072.9025096806978190.815841638487
Trimmed Mean ( 8 / 24 )553.752.82363057257666196.112765380169
Trimmed Mean ( 9 / 24 )553.6481481481482.73576072194701202.374478040654
Trimmed Mean ( 10 / 24 )553.6153846153852.65927810974571208.1825825537
Trimmed Mean ( 11 / 24 )553.642.59052590988701213.71722162167
Trimmed Mean ( 12 / 24 )553.6458333333332.52021781946819219.681739037208
Trimmed Mean ( 13 / 24 )553.6304347826092.46018708209172225.035908371609
Trimmed Mean ( 14 / 24 )553.5681818181822.41852385554147228.886798263252
Trimmed Mean ( 15 / 24 )553.523809523812.36855074485191233.697255896629
Trimmed Mean ( 16 / 24 )553.4752.30021947113414240.618344008324
Trimmed Mean ( 17 / 24 )553.3947368421052.23114494961209248.031727807877
Trimmed Mean ( 18 / 24 )553.3333333333332.16245010952634255.88258933499
Trimmed Mean ( 19 / 24 )553.2941176470592.11291310836536261.863166760848
Trimmed Mean ( 20 / 24 )553.218752.0491611063846269.973282372152
Trimmed Mean ( 21 / 24 )553.1666666666672.0103658575558275.157213095136
Trimmed Mean ( 22 / 24 )553.1071428571431.94728089197733284.040759161099
Trimmed Mean ( 23 / 24 )553.0769230769231.86211052875542297.016162325544
Trimmed Mean ( 24 / 24 )553.251.83193293023232302.003414464436
Median552.5
Midrange545.5
Midmean - Weighted Average at Xnp552.72972972973
Midmean - Weighted Average at X(n+1)p553.333333333333
Midmean - Empirical Distribution Function552.72972972973
Midmean - Empirical Distribution Function - Averaging553.333333333333
Midmean - Empirical Distribution Function - Interpolation553.333333333333
Midmean - Closest Observation552.72972972973
Midmean - True Basic - Statistics Graphics Toolkit553.333333333333
Midmean - MS Excel (old versions)553.394736842105
Number of observations72


Parameters (Session):
Parameters (R input):
R code (references can be found in the software module):
geomean <- function(x) {
return(exp(mean(log(x))))
}
harmean <- function(x) {
return(1/mean(1/x))
}
quamean <- function(x) {
return(sqrt(mean(x*x)))
}
winmean <- function(x) {
x <-sort(x[!is.na(x)])
n<-length(x)
denom <- 3
nodenom <- n/denom
if (nodenom>40) denom <- n/40
sqrtn = sqrt(n)
roundnodenom = floor(nodenom)
win <- array(NA,dim=c(roundnodenom,2))
for (j in 1:roundnodenom) {
win[j,1] <- (j*x[j+1]+sum(x[(j+1):(n-j)])+j*x[n-j])/n
win[j,2] <- sd(c(rep(x[j+1],j),x[(j+1):(n-j)],rep(x[n-j],j)))/sqrtn
}
return(win)
}
trimean <- function(x) {
x <-sort(x[!is.na(x)])
n<-length(x)
denom <- 3
nodenom <- n/denom
if (nodenom>40) denom <- n/40
sqrtn = sqrt(n)
roundnodenom = floor(nodenom)
tri <- array(NA,dim=c(roundnodenom,2))
for (j in 1:roundnodenom) {
tri[j,1] <- mean(x,trim=j/n)
tri[j,2] <- sd(x[(j+1):(n-j)]) / sqrt(n-j*2)
}
return(tri)
}
midrange <- function(x) {
return((max(x)+min(x))/2)
}
q1 <- function(data,n,p,i,f) {
np <- n*p;
i <<- floor(np)
f <<- np - i
qvalue <- (1-f)*data[i] + f*data[i+1]
}
q2 <- function(data,n,p,i,f) {
np <- (n+1)*p
i <<- floor(np)
f <<- np - i
qvalue <- (1-f)*data[i] + f*data[i+1]
}
q3 <- function(data,n,p,i,f) {
np <- n*p
i <<- floor(np)
f <<- np - i
if (f==0) {
qvalue <- data[i]
} else {
qvalue <- data[i+1]
}
}
q4 <- function(data,n,p,i,f) {
np <- n*p
i <<- floor(np)
f <<- np - i
if (f==0) {
qvalue <- (data[i]+data[i+1])/2
} else {
qvalue <- data[i+1]
}
}
q5 <- function(data,n,p,i,f) {
np <- (n-1)*p
i <<- floor(np)
f <<- np - i
if (f==0) {
qvalue <- data[i+1]
} else {
qvalue <- data[i+1] + f*(data[i+2]-data[i+1])
}
}
q6 <- function(data,n,p,i,f) {
np <- n*p+0.5
i <<- floor(np)
f <<- np - i
qvalue <- data[i]
}
q7 <- function(data,n,p,i,f) {
np <- (n+1)*p
i <<- floor(np)
f <<- np - i
if (f==0) {
qvalue <- data[i]
} else {
qvalue <- f*data[i] + (1-f)*data[i+1]
}
}
q8 <- function(data,n,p,i,f) {
np <- (n+1)*p
i <<- floor(np)
f <<- np - i
if (f==0) {
qvalue <- data[i]
} else {
if (f == 0.5) {
qvalue <- (data[i]+data[i+1])/2
} else {
if (f < 0.5) {
qvalue <- data[i]
} else {
qvalue <- data[i+1]
}
}
}
}
midmean <- function(x,def) {
x <-sort(x[!is.na(x)])
n<-length(x)
if (def==1) {
qvalue1 <- q1(x,n,0.25,i,f)
qvalue3 <- q1(x,n,0.75,i,f)
}
if (def==2) {
qvalue1 <- q2(x,n,0.25,i,f)
qvalue3 <- q2(x,n,0.75,i,f)
}
if (def==3) {
qvalue1 <- q3(x,n,0.25,i,f)
qvalue3 <- q3(x,n,0.75,i,f)
}
if (def==4) {
qvalue1 <- q4(x,n,0.25,i,f)
qvalue3 <- q4(x,n,0.75,i,f)
}
if (def==5) {
qvalue1 <- q5(x,n,0.25,i,f)
qvalue3 <- q5(x,n,0.75,i,f)
}
if (def==6) {
qvalue1 <- q6(x,n,0.25,i,f)
qvalue3 <- q6(x,n,0.75,i,f)
}
if (def==7) {
qvalue1 <- q7(x,n,0.25,i,f)
qvalue3 <- q7(x,n,0.75,i,f)
}
if (def==8) {
qvalue1 <- q8(x,n,0.25,i,f)
qvalue3 <- q8(x,n,0.75,i,f)
}
midm <- 0
myn <- 0
roundno4 <- round(n/4)
round3no4 <- round(3*n/4)
for (i in 1:n) {
if ((x[i]>=qvalue1) & (x[i]<=qvalue3)){
midm = midm + x[i]
myn = myn + 1
}
}
midm = midm / myn
return(midm)
}
(arm <- mean(x))
sqrtn <- sqrt(length(x))
(armse <- sd(x) / sqrtn)
(armose <- arm / armse)
(geo <- geomean(x))
(har <- harmean(x))
(qua <- quamean(x))
(win <- winmean(x))
(tri <- trimean(x))
(midr <- midrange(x))
midm <- array(NA,dim=8)
for (j in 1:8) midm[j] <- midmean(x,j)
midm
bitmap(file='test1.png')
lb <- win[,1] - 2*win[,2]
ub <- win[,1] + 2*win[,2]
if ((ylimmin == '') | (ylimmax == '')) plot(win[,1],type='b',main=main, xlab='j', pch=19, ylab='Winsorized Mean(j/n)', ylim=c(min(lb),max(ub))) else plot(win[,1],type='l',main=main, xlab='j', pch=19, ylab='Winsorized Mean(j/n)', ylim=c(ylimmin,ylimmax))
lines(ub,lty=3)
lines(lb,lty=3)
grid()
dev.off()
bitmap(file='test2.png')
lb <- tri[,1] - 2*tri[,2]
ub <- tri[,1] + 2*tri[,2]
if ((ylimmin == '') | (ylimmax == '')) plot(tri[,1],type='b',main=main, xlab='j', pch=19, ylab='Trimmed Mean(j/n)', ylim=c(min(lb),max(ub))) else plot(tri[,1],type='l',main=main, xlab='j', pch=19, ylab='Trimmed Mean(j/n)', ylim=c(ylimmin,ylimmax))
lines(ub,lty=3)
lines(lb,lty=3)
grid()
dev.off()
load(file='createtable')
a<-table.start()
a<-table.row.start(a)
a<-table.element(a,'Central Tendency - Ungrouped Data',4,TRUE)
a<-table.row.end(a)
a<-table.row.start(a)
a<-table.element(a,'Measure',header=TRUE)
a<-table.element(a,'Value',header=TRUE)
a<-table.element(a,'S.E.',header=TRUE)
a<-table.element(a,'Value/S.E.',header=TRUE)
a<-table.row.end(a)
a<-table.row.start(a)
a<-table.element(a,hyperlink('arithmetic_mean.htm', 'Arithmetic Mean', 'click to view the definition of the Arithmetic Mean'),header=TRUE)
a<-table.element(a,arm)
a<-table.element(a,hyperlink('arithmetic_mean_standard_error.htm', armse, 'click to view the definition of the Standard Error of the Arithmetic Mean'))
a<-table.element(a,armose)
a<-table.row.end(a)
a<-table.row.start(a)
a<-table.element(a,hyperlink('geometric_mean.htm', 'Geometric Mean', 'click to view the definition of the Geometric Mean'),header=TRUE)
a<-table.element(a,geo)
a<-table.element(a,'')
a<-table.row.end(a)
a<-table.row.start(a)
a<-table.element(a,hyperlink('harmonic_mean.htm', 'Harmonic Mean', 'click to view the definition of the Harmonic Mean'),header=TRUE)
a<-table.element(a,har)
a<-table.element(a,'')
a<-table.row.end(a)
a<-table.row.start(a)
a<-table.element(a,hyperlink('quadratic_mean.htm', 'Quadratic Mean', 'click to view the definition of the Quadratic Mean'),header=TRUE)
a<-table.element(a,qua)
a<-table.element(a,'')
a<-table.row.end(a)
for (j in 1:length(win[,1])) {
a<-table.row.start(a)
mylabel <- paste('Winsorized Mean (',j)
mylabel <- paste(mylabel,'/')
mylabel <- paste(mylabel,length(win[,1]))
mylabel <- paste(mylabel,')')
a<-table.element(a,hyperlink('winsorized_mean.htm', mylabel, 'click to view the definition of the Winsorized Mean'),header=TRUE)
a<-table.element(a,win[j,1])
a<-table.element(a,win[j,2])
a<-table.element(a,win[j,1]/win[j,2])
a<-table.row.end(a)
}
for (j in 1:length(tri[,1])) {
a<-table.row.start(a)
mylabel <- paste('Trimmed Mean (',j)
mylabel <- paste(mylabel,'/')
mylabel <- paste(mylabel,length(tri[,1]))
mylabel <- paste(mylabel,')')
a<-table.element(a,hyperlink('arithmetic_mean.htm', mylabel, 'click to view the definition of the Trimmed Mean'),header=TRUE)
a<-table.element(a,tri[j,1])
a<-table.element(a,tri[j,2])
a<-table.element(a,tri[j,1]/tri[j,2])
a<-table.row.end(a)
}
a<-table.row.start(a)
a<-table.element(a,hyperlink('median_1.htm', 'Median', 'click to view the definition of the Median'),header=TRUE)
a<-table.element(a,median(x))
a<-table.element(a,'')
a<-table.row.end(a)
a<-table.row.start(a)
a<-table.element(a,hyperlink('midrange.htm', 'Midrange', 'click to view the definition of the Midrange'),header=TRUE)
a<-table.element(a,midr)
a<-table.element(a,'')
a<-table.row.end(a)
a<-table.row.start(a)
mymid <- hyperlink('midmean.htm', 'Midmean', 'click to view the definition of the Midmean')
mylabel <- paste(mymid,hyperlink('method_1.htm','Weighted Average at Xnp',''),sep=' - ')
a<-table.element(a,mylabel,header=TRUE)
a<-table.element(a,midm[1])
a<-table.element(a,'')
a<-table.row.end(a)
a<-table.row.start(a)
mymid <- hyperlink('midmean.htm', 'Midmean', 'click to view the definition of the Midmean')
mylabel <- paste(mymid,hyperlink('method_2.htm','Weighted Average at X(n+1)p',''),sep=' - ')
a<-table.element(a,mylabel,header=TRUE)
a<-table.element(a,midm[2])
a<-table.element(a,'')
a<-table.row.end(a)
a<-table.row.start(a)
mymid <- hyperlink('midmean.htm', 'Midmean', 'click to view the definition of the Midmean')
mylabel <- paste(mymid,hyperlink('method_3.htm','Empirical Distribution Function',''),sep=' - ')
a<-table.element(a,mylabel,header=TRUE)
a<-table.element(a,midm[3])
a<-table.element(a,'')
a<-table.row.end(a)
a<-table.row.start(a)
mymid <- hyperlink('midmean.htm', 'Midmean', 'click to view the definition of the Midmean')
mylabel <- paste(mymid,hyperlink('method_4.htm','Empirical Distribution Function - Averaging',''),sep=' - ')
a<-table.element(a,mylabel,header=TRUE)
a<-table.element(a,midm[4])
a<-table.element(a,'')
a<-table.row.end(a)
a<-table.row.start(a)
mymid <- hyperlink('midmean.htm', 'Midmean', 'click to view the definition of the Midmean')
mylabel <- paste(mymid,hyperlink('method_5.htm','Empirical Distribution Function - Interpolation',''),sep=' - ')
a<-table.element(a,mylabel,header=TRUE)
a<-table.element(a,midm[5])
a<-table.element(a,'')
a<-table.row.end(a)
a<-table.row.start(a)
mymid <- hyperlink('midmean.htm', 'Midmean', 'click to view the definition of the Midmean')
mylabel <- paste(mymid,hyperlink('method_6.htm','Closest Observation',''),sep=' - ')
a<-table.element(a,mylabel,header=TRUE)
a<-table.element(a,midm[6])
a<-table.element(a,'')
a<-table.row.end(a)
a<-table.row.start(a)
mymid <- hyperlink('midmean.htm', 'Midmean', 'click to view the definition of the Midmean')
mylabel <- paste(mymid,hyperlink('method_7.htm','True Basic - Statistics Graphics Toolkit',''),sep=' - ')
a<-table.element(a,mylabel,header=TRUE)
a<-table.element(a,midm[7])
a<-table.element(a,'')
a<-table.row.end(a)
a<-table.row.start(a)
mymid <- hyperlink('midmean.htm', 'Midmean', 'click to view the definition of the Midmean')
mylabel <- paste(mymid,hyperlink('method_8.htm','MS Excel (old versions)',''),sep=' - ')
a<-table.element(a,mylabel,header=TRUE)
a<-table.element(a,midm[8])
a<-table.element(a,'')
a<-table.row.end(a)
a<-table.row.start(a)
a<-table.element(a,'Number of observations',header=TRUE)
a<-table.element(a,length(x))
a<-table.element(a,'')
a<-table.row.end(a)
a<-table.end(a)
table.save(a,file='mytable.tab')