Free Statistics

of Irreproducible Research!

Author's title

Author*Unverified author*
R Software Modulerwasp_centraltendency.wasp
Title produced by softwareCentral Tendency
Date of computationSat, 11 Oct 2014 17:06:11 +0100
Cite this page as followsStatistical Computations at FreeStatistics.org, Office for Research Development and Education, URL https://freestatistics.org/blog/index.php?v=date/2014/Oct/11/t1413043607j4xpsh3k77dymfi.htm/, Retrieved Tue, 14 May 2024 21:32:17 +0000
Statistical Computations at FreeStatistics.org, Office for Research Development and Education, URL https://freestatistics.org/blog/index.php?pk=240495, Retrieved Tue, 14 May 2024 21:32:17 +0000
QR Codes:

Original text written by user:
IsPrivate?No (this computation is public)
User-defined keywords
Estimated Impact90
Family? (F = Feedback message, R = changed R code, M = changed R Module, P = changed Parameters, D = changed Data)
-       [Central Tendency] [] [2014-10-11 16:06:11] [7c1b641e1a752e372282648dcc4f5732] [Current]
Feedback Forum

Post a new message
Dataseries X:
111,2
116,7
125,8
131,5
146,2
155,4
157,5
137,2
121,3
89,1
69,6
56,7
58,5
56,4
60,5
64,6
73,2
84,6
80,4
88,4
84,6
90,8
94,9
93,1
96,6
93,1
98,3
105
95,6
94,3
95,3
97,1
98,1
104,4
107,8
114,3
118,7
124,1
134,2
142,4
133,8
131
133,2
125,9
126,2
122,7
126,6
124,8
128
134,1
138,8
134
124
110,4
116,7
124,7
126
122,8
120,2
121,2
125,4
127,9
122
117,5
117,9
117,9
122,7
125,7
126,1
123,2
120,6
123,5


Summary of computational transaction
Raw Inputview raw input (R code)
Raw Outputview raw output of R engine
Computing time1 seconds
R Server'Gwilym Jenkins' @ jenkins.wessa.net

\begin{tabular}{lllllllll}
\hline
Summary of computational transaction \tabularnewline
Raw Input & view raw input (R code)  \tabularnewline
Raw Output & view raw output of R engine  \tabularnewline
Computing time & 1 seconds \tabularnewline
R Server & 'Gwilym Jenkins' @ jenkins.wessa.net \tabularnewline
\hline
\end{tabular}
%Source: https://freestatistics.org/blog/index.php?pk=240495&T=0

[TABLE]
[ROW][C]Summary of computational transaction[/C][/ROW]
[ROW][C]Raw Input[/C][C]view raw input (R code) [/C][/ROW]
[ROW][C]Raw Output[/C][C]view raw output of R engine [/C][/ROW]
[ROW][C]Computing time[/C][C]1 seconds[/C][/ROW]
[ROW][C]R Server[/C][C]'Gwilym Jenkins' @ jenkins.wessa.net[/C][/ROW]
[/TABLE]
Source: https://freestatistics.org/blog/index.php?pk=240495&T=0

Globally Unique Identifier (entire table): ba.freestatistics.org/blog/index.php?pk=240495&T=0

As an alternative you can also use a QR Code:  

The GUIDs for individual cells are displayed in the table below:

Summary of computational transaction
Raw Inputview raw input (R code)
Raw Outputview raw output of R engine
Computing time1 seconds
R Server'Gwilym Jenkins' @ jenkins.wessa.net


Central Tendency - Ungrouped Data
MeasureValueS.E.Value/S.E.
Arithmetic Mean111.9861111111112.744578740544740.8026592412088
Geometric Mean109.186840037291
Harmonic Mean105.894132818175
Quadratic Mean114.349078119007
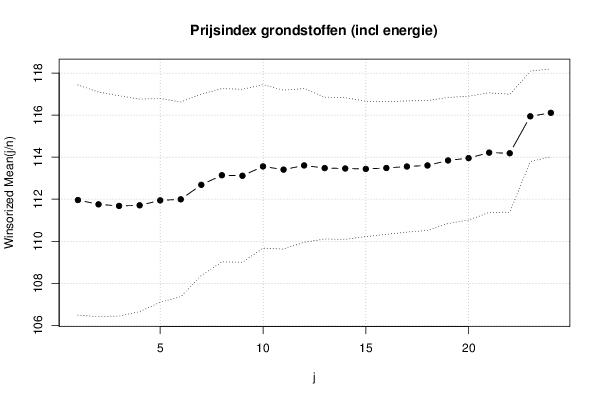
Winsorized Mean ( 1 / 24 )111.9611111111112.736725362602440.9106126033214
Winsorized Mean ( 2 / 24 )111.7555555555562.6707516312413141.844233753632
Winsorized Mean ( 3 / 24 )111.6805555555562.620117964714142.6242470986385
Winsorized Mean ( 4 / 24 )111.7083333333332.5272209355885444.2020449262062
Winsorized Mean ( 5 / 24 )111.9444444444442.4222841372684446.2144150317071
Winsorized Mean ( 6 / 24 )111.9944444444442.3146281510549548.3855017461012
Winsorized Mean ( 7 / 24 )112.6847222222222.1565597238237452.2520758304917
Winsorized Mean ( 8 / 24 )113.1402777777782.0601808911058254.9176425556733
Winsorized Mean ( 9 / 24 )113.1152777777782.0566275741049855.0003701214616
Winsorized Mean ( 10 / 24 )113.5597222222221.9450950104949158.3826093890025
Winsorized Mean ( 11 / 24 )113.4069444444441.8896703871576460.0141406750974
Winsorized Mean ( 12 / 24 )113.6069444444441.8278924025566462.1518773673682
Winsorized Mean ( 13 / 24 )113.4805555555561.6867494724529767.2776588395936
Winsorized Mean ( 14 / 24 )113.4611111111111.6843969534681367.3600785595684
Winsorized Mean ( 15 / 24 )113.4402777777781.6102258559616570.4499169217658
Winsorized Mean ( 16 / 24 )113.4847222222221.5778427902005171.9239729883361
Winsorized Mean ( 17 / 24 )113.5555555555561.5595456594420572.8132292043194
Winsorized Mean ( 18 / 24 )113.6055555555561.5443760469424873.5608116821478
Winsorized Mean ( 19 / 24 )113.8430555555561.4983321797152775.9798508613688
Winsorized Mean ( 20 / 24 )113.9541666666671.472734643380277.375898760092
Winsorized Mean ( 21 / 24 )114.2166666666671.422645489148180.2847002559024
Winsorized Mean ( 22 / 24 )114.1861111111111.4025230249471481.414785411751
Winsorized Mean ( 23 / 24 )115.9430555555561.07707441949052107.646280941663
Winsorized Mean ( 24 / 24 )116.1097222222221.04311431748942111.310639951407
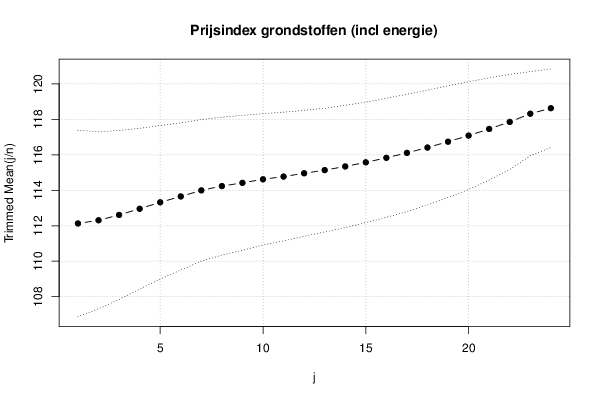
Trimmed Mean ( 1 / 24 )112.132.6274725907839542.6759922799211
Trimmed Mean ( 2 / 24 )112.3088235294122.4965953421474844.9847925426345
Trimmed Mean ( 3 / 24 )112.6106060606062.3823106144692747.2694892834927
Trimmed Mean ( 4 / 24 )112.9593752.2678291823126449.8094723716399
Trimmed Mean ( 5 / 24 )113.3225806451612.1647034148886752.3501648612632
Trimmed Mean ( 6 / 24 )113.6533333333332.0744524383607254.7871482766532
Trimmed Mean ( 7 / 24 )113.9965517241381.9957910423079957.1184804959887
Trimmed Mean ( 8 / 24 )114.23751.943376300361158.7830056272547
Trimmed Mean ( 9 / 24 )114.420370370371.9027296211989960.134855260344
Trimmed Mean ( 10 / 24 )114.6211538461541.8518474256595961.8955710162399
Trimmed Mean ( 11 / 24 )114.7741.8138600400521463.2761059098587
Trimmed Mean ( 12 / 24 )114.9604166666671.7765382396316564.7103530349578
Trimmed Mean ( 13 / 24 )115.1369565217391.7414674213628466.1149069510787
Trimmed Mean ( 14 / 24 )115.3454545454551.7242072497282366.8976740259244
Trimmed Mean ( 15 / 24 )115.576190476191.6988751129855368.0310103978637
Trimmed Mean ( 16 / 24 )115.83251.6781338364614869.0245899839818
Trimmed Mean ( 17 / 24 )116.1105263157891.6536041479587270.2166394896391
Trimmed Mean ( 18 / 24 )116.4111111111111.6204191980549571.84012090874
Trimmed Mean ( 19 / 24 )116.7411764705881.5739927183718774.1688160993174
Trimmed Mean ( 20 / 24 )117.0843751.5181636122395577.1223694574532
Trimmed Mean ( 21 / 24 )117.461.4411090875776481.5066680326322
Trimmed Mean ( 22 / 24 )117.8571428571431.3410927844064387.8814234388013
Trimmed Mean ( 23 / 24 )118.3192307692311.1863067346344599.7374686620908
Trimmed Mean ( 24 / 24 )118.6291666666671.10721414288861107.14202616413
Median120.4
Midrange106.95
Midmean - Weighted Average at Xnp115.840540540541
Midmean - Weighted Average at X(n+1)p116.411111111111
Midmean - Empirical Distribution Function115.840540540541
Midmean - Empirical Distribution Function - Averaging116.411111111111
Midmean - Empirical Distribution Function - Interpolation116.411111111111
Midmean - Closest Observation115.840540540541
Midmean - True Basic - Statistics Graphics Toolkit116.411111111111
Midmean - MS Excel (old versions)116.110526315789
Number of observations72

\begin{tabular}{lllllllll}
\hline
Central Tendency - Ungrouped Data \tabularnewline
Measure & Value & S.E. & Value/S.E. \tabularnewline
Arithmetic Mean & 111.986111111111 & 2.7445787405447 & 40.8026592412088 \tabularnewline
Geometric Mean & 109.186840037291 &  &  \tabularnewline
Harmonic Mean & 105.894132818175 &  &  \tabularnewline
Quadratic Mean & 114.349078119007 &  &  \tabularnewline
Winsorized Mean ( 1 / 24 ) & 111.961111111111 & 2.7367253626024 & 40.9106126033214 \tabularnewline
Winsorized Mean ( 2 / 24 ) & 111.755555555556 & 2.67075163124131 & 41.844233753632 \tabularnewline
Winsorized Mean ( 3 / 24 ) & 111.680555555556 & 2.6201179647141 & 42.6242470986385 \tabularnewline
Winsorized Mean ( 4 / 24 ) & 111.708333333333 & 2.52722093558854 & 44.2020449262062 \tabularnewline
Winsorized Mean ( 5 / 24 ) & 111.944444444444 & 2.42228413726844 & 46.2144150317071 \tabularnewline
Winsorized Mean ( 6 / 24 ) & 111.994444444444 & 2.31462815105495 & 48.3855017461012 \tabularnewline
Winsorized Mean ( 7 / 24 ) & 112.684722222222 & 2.15655972382374 & 52.2520758304917 \tabularnewline
Winsorized Mean ( 8 / 24 ) & 113.140277777778 & 2.06018089110582 & 54.9176425556733 \tabularnewline
Winsorized Mean ( 9 / 24 ) & 113.115277777778 & 2.05662757410498 & 55.0003701214616 \tabularnewline
Winsorized Mean ( 10 / 24 ) & 113.559722222222 & 1.94509501049491 & 58.3826093890025 \tabularnewline
Winsorized Mean ( 11 / 24 ) & 113.406944444444 & 1.88967038715764 & 60.0141406750974 \tabularnewline
Winsorized Mean ( 12 / 24 ) & 113.606944444444 & 1.82789240255664 & 62.1518773673682 \tabularnewline
Winsorized Mean ( 13 / 24 ) & 113.480555555556 & 1.68674947245297 & 67.2776588395936 \tabularnewline
Winsorized Mean ( 14 / 24 ) & 113.461111111111 & 1.68439695346813 & 67.3600785595684 \tabularnewline
Winsorized Mean ( 15 / 24 ) & 113.440277777778 & 1.61022585596165 & 70.4499169217658 \tabularnewline
Winsorized Mean ( 16 / 24 ) & 113.484722222222 & 1.57784279020051 & 71.9239729883361 \tabularnewline
Winsorized Mean ( 17 / 24 ) & 113.555555555556 & 1.55954565944205 & 72.8132292043194 \tabularnewline
Winsorized Mean ( 18 / 24 ) & 113.605555555556 & 1.54437604694248 & 73.5608116821478 \tabularnewline
Winsorized Mean ( 19 / 24 ) & 113.843055555556 & 1.49833217971527 & 75.9798508613688 \tabularnewline
Winsorized Mean ( 20 / 24 ) & 113.954166666667 & 1.4727346433802 & 77.375898760092 \tabularnewline
Winsorized Mean ( 21 / 24 ) & 114.216666666667 & 1.4226454891481 & 80.2847002559024 \tabularnewline
Winsorized Mean ( 22 / 24 ) & 114.186111111111 & 1.40252302494714 & 81.414785411751 \tabularnewline
Winsorized Mean ( 23 / 24 ) & 115.943055555556 & 1.07707441949052 & 107.646280941663 \tabularnewline
Winsorized Mean ( 24 / 24 ) & 116.109722222222 & 1.04311431748942 & 111.310639951407 \tabularnewline
Trimmed Mean ( 1 / 24 ) & 112.13 & 2.62747259078395 & 42.6759922799211 \tabularnewline
Trimmed Mean ( 2 / 24 ) & 112.308823529412 & 2.49659534214748 & 44.9847925426345 \tabularnewline
Trimmed Mean ( 3 / 24 ) & 112.610606060606 & 2.38231061446927 & 47.2694892834927 \tabularnewline
Trimmed Mean ( 4 / 24 ) & 112.959375 & 2.26782918231264 & 49.8094723716399 \tabularnewline
Trimmed Mean ( 5 / 24 ) & 113.322580645161 & 2.16470341488867 & 52.3501648612632 \tabularnewline
Trimmed Mean ( 6 / 24 ) & 113.653333333333 & 2.07445243836072 & 54.7871482766532 \tabularnewline
Trimmed Mean ( 7 / 24 ) & 113.996551724138 & 1.99579104230799 & 57.1184804959887 \tabularnewline
Trimmed Mean ( 8 / 24 ) & 114.2375 & 1.9433763003611 & 58.7830056272547 \tabularnewline
Trimmed Mean ( 9 / 24 ) & 114.42037037037 & 1.90272962119899 & 60.134855260344 \tabularnewline
Trimmed Mean ( 10 / 24 ) & 114.621153846154 & 1.85184742565959 & 61.8955710162399 \tabularnewline
Trimmed Mean ( 11 / 24 ) & 114.774 & 1.81386004005214 & 63.2761059098587 \tabularnewline
Trimmed Mean ( 12 / 24 ) & 114.960416666667 & 1.77653823963165 & 64.7103530349578 \tabularnewline
Trimmed Mean ( 13 / 24 ) & 115.136956521739 & 1.74146742136284 & 66.1149069510787 \tabularnewline
Trimmed Mean ( 14 / 24 ) & 115.345454545455 & 1.72420724972823 & 66.8976740259244 \tabularnewline
Trimmed Mean ( 15 / 24 ) & 115.57619047619 & 1.69887511298553 & 68.0310103978637 \tabularnewline
Trimmed Mean ( 16 / 24 ) & 115.8325 & 1.67813383646148 & 69.0245899839818 \tabularnewline
Trimmed Mean ( 17 / 24 ) & 116.110526315789 & 1.65360414795872 & 70.2166394896391 \tabularnewline
Trimmed Mean ( 18 / 24 ) & 116.411111111111 & 1.62041919805495 & 71.84012090874 \tabularnewline
Trimmed Mean ( 19 / 24 ) & 116.741176470588 & 1.57399271837187 & 74.1688160993174 \tabularnewline
Trimmed Mean ( 20 / 24 ) & 117.084375 & 1.51816361223955 & 77.1223694574532 \tabularnewline
Trimmed Mean ( 21 / 24 ) & 117.46 & 1.44110908757764 & 81.5066680326322 \tabularnewline
Trimmed Mean ( 22 / 24 ) & 117.857142857143 & 1.34109278440643 & 87.8814234388013 \tabularnewline
Trimmed Mean ( 23 / 24 ) & 118.319230769231 & 1.18630673463445 & 99.7374686620908 \tabularnewline
Trimmed Mean ( 24 / 24 ) & 118.629166666667 & 1.10721414288861 & 107.14202616413 \tabularnewline
Median & 120.4 &  &  \tabularnewline
Midrange & 106.95 &  &  \tabularnewline
Midmean - Weighted Average at Xnp & 115.840540540541 &  &  \tabularnewline
Midmean - Weighted Average at X(n+1)p & 116.411111111111 &  &  \tabularnewline
Midmean - Empirical Distribution Function & 115.840540540541 &  &  \tabularnewline
Midmean - Empirical Distribution Function - Averaging & 116.411111111111 &  &  \tabularnewline
Midmean - Empirical Distribution Function - Interpolation & 116.411111111111 &  &  \tabularnewline
Midmean - Closest Observation & 115.840540540541 &  &  \tabularnewline
Midmean - True Basic - Statistics Graphics Toolkit & 116.411111111111 &  &  \tabularnewline
Midmean - MS Excel (old versions) & 116.110526315789 &  &  \tabularnewline
Number of observations & 72 &  &  \tabularnewline
\hline
\end{tabular}
%Source: https://freestatistics.org/blog/index.php?pk=240495&T=1

[TABLE]
[ROW][C]Central Tendency - Ungrouped Data[/C][/ROW]
[ROW][C]Measure[/C][C]Value[/C][C]S.E.[/C][C]Value/S.E.[/C][/ROW]
[ROW][C]Arithmetic Mean[/C][C]111.986111111111[/C][C]2.7445787405447[/C][C]40.8026592412088[/C][/ROW]
[ROW][C]Geometric Mean[/C][C]109.186840037291[/C][C][/C][C][/C][/ROW]
[ROW][C]Harmonic Mean[/C][C]105.894132818175[/C][C][/C][C][/C][/ROW]
[ROW][C]Quadratic Mean[/C][C]114.349078119007[/C][C][/C][C][/C][/ROW]
[ROW][C]Winsorized Mean ( 1 / 24 )[/C][C]111.961111111111[/C][C]2.7367253626024[/C][C]40.9106126033214[/C][/ROW]
[ROW][C]Winsorized Mean ( 2 / 24 )[/C][C]111.755555555556[/C][C]2.67075163124131[/C][C]41.844233753632[/C][/ROW]
[ROW][C]Winsorized Mean ( 3 / 24 )[/C][C]111.680555555556[/C][C]2.6201179647141[/C][C]42.6242470986385[/C][/ROW]
[ROW][C]Winsorized Mean ( 4 / 24 )[/C][C]111.708333333333[/C][C]2.52722093558854[/C][C]44.2020449262062[/C][/ROW]
[ROW][C]Winsorized Mean ( 5 / 24 )[/C][C]111.944444444444[/C][C]2.42228413726844[/C][C]46.2144150317071[/C][/ROW]
[ROW][C]Winsorized Mean ( 6 / 24 )[/C][C]111.994444444444[/C][C]2.31462815105495[/C][C]48.3855017461012[/C][/ROW]
[ROW][C]Winsorized Mean ( 7 / 24 )[/C][C]112.684722222222[/C][C]2.15655972382374[/C][C]52.2520758304917[/C][/ROW]
[ROW][C]Winsorized Mean ( 8 / 24 )[/C][C]113.140277777778[/C][C]2.06018089110582[/C][C]54.9176425556733[/C][/ROW]
[ROW][C]Winsorized Mean ( 9 / 24 )[/C][C]113.115277777778[/C][C]2.05662757410498[/C][C]55.0003701214616[/C][/ROW]
[ROW][C]Winsorized Mean ( 10 / 24 )[/C][C]113.559722222222[/C][C]1.94509501049491[/C][C]58.3826093890025[/C][/ROW]
[ROW][C]Winsorized Mean ( 11 / 24 )[/C][C]113.406944444444[/C][C]1.88967038715764[/C][C]60.0141406750974[/C][/ROW]
[ROW][C]Winsorized Mean ( 12 / 24 )[/C][C]113.606944444444[/C][C]1.82789240255664[/C][C]62.1518773673682[/C][/ROW]
[ROW][C]Winsorized Mean ( 13 / 24 )[/C][C]113.480555555556[/C][C]1.68674947245297[/C][C]67.2776588395936[/C][/ROW]
[ROW][C]Winsorized Mean ( 14 / 24 )[/C][C]113.461111111111[/C][C]1.68439695346813[/C][C]67.3600785595684[/C][/ROW]
[ROW][C]Winsorized Mean ( 15 / 24 )[/C][C]113.440277777778[/C][C]1.61022585596165[/C][C]70.4499169217658[/C][/ROW]
[ROW][C]Winsorized Mean ( 16 / 24 )[/C][C]113.484722222222[/C][C]1.57784279020051[/C][C]71.9239729883361[/C][/ROW]
[ROW][C]Winsorized Mean ( 17 / 24 )[/C][C]113.555555555556[/C][C]1.55954565944205[/C][C]72.8132292043194[/C][/ROW]
[ROW][C]Winsorized Mean ( 18 / 24 )[/C][C]113.605555555556[/C][C]1.54437604694248[/C][C]73.5608116821478[/C][/ROW]
[ROW][C]Winsorized Mean ( 19 / 24 )[/C][C]113.843055555556[/C][C]1.49833217971527[/C][C]75.9798508613688[/C][/ROW]
[ROW][C]Winsorized Mean ( 20 / 24 )[/C][C]113.954166666667[/C][C]1.4727346433802[/C][C]77.375898760092[/C][/ROW]
[ROW][C]Winsorized Mean ( 21 / 24 )[/C][C]114.216666666667[/C][C]1.4226454891481[/C][C]80.2847002559024[/C][/ROW]
[ROW][C]Winsorized Mean ( 22 / 24 )[/C][C]114.186111111111[/C][C]1.40252302494714[/C][C]81.414785411751[/C][/ROW]
[ROW][C]Winsorized Mean ( 23 / 24 )[/C][C]115.943055555556[/C][C]1.07707441949052[/C][C]107.646280941663[/C][/ROW]
[ROW][C]Winsorized Mean ( 24 / 24 )[/C][C]116.109722222222[/C][C]1.04311431748942[/C][C]111.310639951407[/C][/ROW]
[ROW][C]Trimmed Mean ( 1 / 24 )[/C][C]112.13[/C][C]2.62747259078395[/C][C]42.6759922799211[/C][/ROW]
[ROW][C]Trimmed Mean ( 2 / 24 )[/C][C]112.308823529412[/C][C]2.49659534214748[/C][C]44.9847925426345[/C][/ROW]
[ROW][C]Trimmed Mean ( 3 / 24 )[/C][C]112.610606060606[/C][C]2.38231061446927[/C][C]47.2694892834927[/C][/ROW]
[ROW][C]Trimmed Mean ( 4 / 24 )[/C][C]112.959375[/C][C]2.26782918231264[/C][C]49.8094723716399[/C][/ROW]
[ROW][C]Trimmed Mean ( 5 / 24 )[/C][C]113.322580645161[/C][C]2.16470341488867[/C][C]52.3501648612632[/C][/ROW]
[ROW][C]Trimmed Mean ( 6 / 24 )[/C][C]113.653333333333[/C][C]2.07445243836072[/C][C]54.7871482766532[/C][/ROW]
[ROW][C]Trimmed Mean ( 7 / 24 )[/C][C]113.996551724138[/C][C]1.99579104230799[/C][C]57.1184804959887[/C][/ROW]
[ROW][C]Trimmed Mean ( 8 / 24 )[/C][C]114.2375[/C][C]1.9433763003611[/C][C]58.7830056272547[/C][/ROW]
[ROW][C]Trimmed Mean ( 9 / 24 )[/C][C]114.42037037037[/C][C]1.90272962119899[/C][C]60.134855260344[/C][/ROW]
[ROW][C]Trimmed Mean ( 10 / 24 )[/C][C]114.621153846154[/C][C]1.85184742565959[/C][C]61.8955710162399[/C][/ROW]
[ROW][C]Trimmed Mean ( 11 / 24 )[/C][C]114.774[/C][C]1.81386004005214[/C][C]63.2761059098587[/C][/ROW]
[ROW][C]Trimmed Mean ( 12 / 24 )[/C][C]114.960416666667[/C][C]1.77653823963165[/C][C]64.7103530349578[/C][/ROW]
[ROW][C]Trimmed Mean ( 13 / 24 )[/C][C]115.136956521739[/C][C]1.74146742136284[/C][C]66.1149069510787[/C][/ROW]
[ROW][C]Trimmed Mean ( 14 / 24 )[/C][C]115.345454545455[/C][C]1.72420724972823[/C][C]66.8976740259244[/C][/ROW]
[ROW][C]Trimmed Mean ( 15 / 24 )[/C][C]115.57619047619[/C][C]1.69887511298553[/C][C]68.0310103978637[/C][/ROW]
[ROW][C]Trimmed Mean ( 16 / 24 )[/C][C]115.8325[/C][C]1.67813383646148[/C][C]69.0245899839818[/C][/ROW]
[ROW][C]Trimmed Mean ( 17 / 24 )[/C][C]116.110526315789[/C][C]1.65360414795872[/C][C]70.2166394896391[/C][/ROW]
[ROW][C]Trimmed Mean ( 18 / 24 )[/C][C]116.411111111111[/C][C]1.62041919805495[/C][C]71.84012090874[/C][/ROW]
[ROW][C]Trimmed Mean ( 19 / 24 )[/C][C]116.741176470588[/C][C]1.57399271837187[/C][C]74.1688160993174[/C][/ROW]
[ROW][C]Trimmed Mean ( 20 / 24 )[/C][C]117.084375[/C][C]1.51816361223955[/C][C]77.1223694574532[/C][/ROW]
[ROW][C]Trimmed Mean ( 21 / 24 )[/C][C]117.46[/C][C]1.44110908757764[/C][C]81.5066680326322[/C][/ROW]
[ROW][C]Trimmed Mean ( 22 / 24 )[/C][C]117.857142857143[/C][C]1.34109278440643[/C][C]87.8814234388013[/C][/ROW]
[ROW][C]Trimmed Mean ( 23 / 24 )[/C][C]118.319230769231[/C][C]1.18630673463445[/C][C]99.7374686620908[/C][/ROW]
[ROW][C]Trimmed Mean ( 24 / 24 )[/C][C]118.629166666667[/C][C]1.10721414288861[/C][C]107.14202616413[/C][/ROW]
[ROW][C]Median[/C][C]120.4[/C][C][/C][C][/C][/ROW]
[ROW][C]Midrange[/C][C]106.95[/C][C][/C][C][/C][/ROW]
[ROW][C]Midmean - Weighted Average at Xnp[/C][C]115.840540540541[/C][C][/C][C][/C][/ROW]
[ROW][C]Midmean - Weighted Average at X(n+1)p[/C][C]116.411111111111[/C][C][/C][C][/C][/ROW]
[ROW][C]Midmean - Empirical Distribution Function[/C][C]115.840540540541[/C][C][/C][C][/C][/ROW]
[ROW][C]Midmean - Empirical Distribution Function - Averaging[/C][C]116.411111111111[/C][C][/C][C][/C][/ROW]
[ROW][C]Midmean - Empirical Distribution Function - Interpolation[/C][C]116.411111111111[/C][C][/C][C][/C][/ROW]
[ROW][C]Midmean - Closest Observation[/C][C]115.840540540541[/C][C][/C][C][/C][/ROW]
[ROW][C]Midmean - True Basic - Statistics Graphics Toolkit[/C][C]116.411111111111[/C][C][/C][C][/C][/ROW]
[ROW][C]Midmean - MS Excel (old versions)[/C][C]116.110526315789[/C][C][/C][C][/C][/ROW]
[ROW][C]Number of observations[/C][C]72[/C][C][/C][C][/C][/ROW]
[/TABLE]
Source: https://freestatistics.org/blog/index.php?pk=240495&T=1

Globally Unique Identifier (entire table): ba.freestatistics.org/blog/index.php?pk=240495&T=1

As an alternative you can also use a QR Code:  

The GUIDs for individual cells are displayed in the table below:

Central Tendency - Ungrouped Data
MeasureValueS.E.Value/S.E.
Arithmetic Mean111.9861111111112.744578740544740.8026592412088
Geometric Mean109.186840037291
Harmonic Mean105.894132818175
Quadratic Mean114.349078119007
Winsorized Mean ( 1 / 24 )111.9611111111112.736725362602440.9106126033214
Winsorized Mean ( 2 / 24 )111.7555555555562.6707516312413141.844233753632
Winsorized Mean ( 3 / 24 )111.6805555555562.620117964714142.6242470986385
Winsorized Mean ( 4 / 24 )111.7083333333332.5272209355885444.2020449262062
Winsorized Mean ( 5 / 24 )111.9444444444442.4222841372684446.2144150317071
Winsorized Mean ( 6 / 24 )111.9944444444442.3146281510549548.3855017461012
Winsorized Mean ( 7 / 24 )112.6847222222222.1565597238237452.2520758304917
Winsorized Mean ( 8 / 24 )113.1402777777782.0601808911058254.9176425556733
Winsorized Mean ( 9 / 24 )113.1152777777782.0566275741049855.0003701214616
Winsorized Mean ( 10 / 24 )113.5597222222221.9450950104949158.3826093890025
Winsorized Mean ( 11 / 24 )113.4069444444441.8896703871576460.0141406750974
Winsorized Mean ( 12 / 24 )113.6069444444441.8278924025566462.1518773673682
Winsorized Mean ( 13 / 24 )113.4805555555561.6867494724529767.2776588395936
Winsorized Mean ( 14 / 24 )113.4611111111111.6843969534681367.3600785595684
Winsorized Mean ( 15 / 24 )113.4402777777781.6102258559616570.4499169217658
Winsorized Mean ( 16 / 24 )113.4847222222221.5778427902005171.9239729883361
Winsorized Mean ( 17 / 24 )113.5555555555561.5595456594420572.8132292043194
Winsorized Mean ( 18 / 24 )113.6055555555561.5443760469424873.5608116821478
Winsorized Mean ( 19 / 24 )113.8430555555561.4983321797152775.9798508613688
Winsorized Mean ( 20 / 24 )113.9541666666671.472734643380277.375898760092
Winsorized Mean ( 21 / 24 )114.2166666666671.422645489148180.2847002559024
Winsorized Mean ( 22 / 24 )114.1861111111111.4025230249471481.414785411751
Winsorized Mean ( 23 / 24 )115.9430555555561.07707441949052107.646280941663
Winsorized Mean ( 24 / 24 )116.1097222222221.04311431748942111.310639951407
Trimmed Mean ( 1 / 24 )112.132.6274725907839542.6759922799211
Trimmed Mean ( 2 / 24 )112.3088235294122.4965953421474844.9847925426345
Trimmed Mean ( 3 / 24 )112.6106060606062.3823106144692747.2694892834927
Trimmed Mean ( 4 / 24 )112.9593752.2678291823126449.8094723716399
Trimmed Mean ( 5 / 24 )113.3225806451612.1647034148886752.3501648612632
Trimmed Mean ( 6 / 24 )113.6533333333332.0744524383607254.7871482766532
Trimmed Mean ( 7 / 24 )113.9965517241381.9957910423079957.1184804959887
Trimmed Mean ( 8 / 24 )114.23751.943376300361158.7830056272547
Trimmed Mean ( 9 / 24 )114.420370370371.9027296211989960.134855260344
Trimmed Mean ( 10 / 24 )114.6211538461541.8518474256595961.8955710162399
Trimmed Mean ( 11 / 24 )114.7741.8138600400521463.2761059098587
Trimmed Mean ( 12 / 24 )114.9604166666671.7765382396316564.7103530349578
Trimmed Mean ( 13 / 24 )115.1369565217391.7414674213628466.1149069510787
Trimmed Mean ( 14 / 24 )115.3454545454551.7242072497282366.8976740259244
Trimmed Mean ( 15 / 24 )115.576190476191.6988751129855368.0310103978637
Trimmed Mean ( 16 / 24 )115.83251.6781338364614869.0245899839818
Trimmed Mean ( 17 / 24 )116.1105263157891.6536041479587270.2166394896391
Trimmed Mean ( 18 / 24 )116.4111111111111.6204191980549571.84012090874
Trimmed Mean ( 19 / 24 )116.7411764705881.5739927183718774.1688160993174
Trimmed Mean ( 20 / 24 )117.0843751.5181636122395577.1223694574532
Trimmed Mean ( 21 / 24 )117.461.4411090875776481.5066680326322
Trimmed Mean ( 22 / 24 )117.8571428571431.3410927844064387.8814234388013
Trimmed Mean ( 23 / 24 )118.3192307692311.1863067346344599.7374686620908
Trimmed Mean ( 24 / 24 )118.6291666666671.10721414288861107.14202616413
Median120.4
Midrange106.95
Midmean - Weighted Average at Xnp115.840540540541
Midmean - Weighted Average at X(n+1)p116.411111111111
Midmean - Empirical Distribution Function115.840540540541
Midmean - Empirical Distribution Function - Averaging116.411111111111
Midmean - Empirical Distribution Function - Interpolation116.411111111111
Midmean - Closest Observation115.840540540541
Midmean - True Basic - Statistics Graphics Toolkit116.411111111111
Midmean - MS Excel (old versions)116.110526315789
Number of observations72


Parameters (Session):
Parameters (R input):
R code (references can be found in the software module):
geomean <- function(x) {
return(exp(mean(log(x))))
}
harmean <- function(x) {
return(1/mean(1/x))
}
quamean <- function(x) {
return(sqrt(mean(x*x)))
}
winmean <- function(x) {
x <-sort(x[!is.na(x)])
n<-length(x)
denom <- 3
nodenom <- n/denom
if (nodenom>40) denom <- n/40
sqrtn = sqrt(n)
roundnodenom = floor(nodenom)
win <- array(NA,dim=c(roundnodenom,2))
for (j in 1:roundnodenom) {
win[j,1] <- (j*x[j+1]+sum(x[(j+1):(n-j)])+j*x[n-j])/n
win[j,2] <- sd(c(rep(x[j+1],j),x[(j+1):(n-j)],rep(x[n-j],j)))/sqrtn
}
return(win)
}
trimean <- function(x) {
x <-sort(x[!is.na(x)])
n<-length(x)
denom <- 3
nodenom <- n/denom
if (nodenom>40) denom <- n/40
sqrtn = sqrt(n)
roundnodenom = floor(nodenom)
tri <- array(NA,dim=c(roundnodenom,2))
for (j in 1:roundnodenom) {
tri[j,1] <- mean(x,trim=j/n)
tri[j,2] <- sd(x[(j+1):(n-j)]) / sqrt(n-j*2)
}
return(tri)
}
midrange <- function(x) {
return((max(x)+min(x))/2)
}
q1 <- function(data,n,p,i,f) {
np <- n*p;
i <<- floor(np)
f <<- np - i
qvalue <- (1-f)*data[i] + f*data[i+1]
}
q2 <- function(data,n,p,i,f) {
np <- (n+1)*p
i <<- floor(np)
f <<- np - i
qvalue <- (1-f)*data[i] + f*data[i+1]
}
q3 <- function(data,n,p,i,f) {
np <- n*p
i <<- floor(np)
f <<- np - i
if (f==0) {
qvalue <- data[i]
} else {
qvalue <- data[i+1]
}
}
q4 <- function(data,n,p,i,f) {
np <- n*p
i <<- floor(np)
f <<- np - i
if (f==0) {
qvalue <- (data[i]+data[i+1])/2
} else {
qvalue <- data[i+1]
}
}
q5 <- function(data,n,p,i,f) {
np <- (n-1)*p
i <<- floor(np)
f <<- np - i
if (f==0) {
qvalue <- data[i+1]
} else {
qvalue <- data[i+1] + f*(data[i+2]-data[i+1])
}
}
q6 <- function(data,n,p,i,f) {
np <- n*p+0.5
i <<- floor(np)
f <<- np - i
qvalue <- data[i]
}
q7 <- function(data,n,p,i,f) {
np <- (n+1)*p
i <<- floor(np)
f <<- np - i
if (f==0) {
qvalue <- data[i]
} else {
qvalue <- f*data[i] + (1-f)*data[i+1]
}
}
q8 <- function(data,n,p,i,f) {
np <- (n+1)*p
i <<- floor(np)
f <<- np - i
if (f==0) {
qvalue <- data[i]
} else {
if (f == 0.5) {
qvalue <- (data[i]+data[i+1])/2
} else {
if (f < 0.5) {
qvalue <- data[i]
} else {
qvalue <- data[i+1]
}
}
}
}
midmean <- function(x,def) {
x <-sort(x[!is.na(x)])
n<-length(x)
if (def==1) {
qvalue1 <- q1(x,n,0.25,i,f)
qvalue3 <- q1(x,n,0.75,i,f)
}
if (def==2) {
qvalue1 <- q2(x,n,0.25,i,f)
qvalue3 <- q2(x,n,0.75,i,f)
}
if (def==3) {
qvalue1 <- q3(x,n,0.25,i,f)
qvalue3 <- q3(x,n,0.75,i,f)
}
if (def==4) {
qvalue1 <- q4(x,n,0.25,i,f)
qvalue3 <- q4(x,n,0.75,i,f)
}
if (def==5) {
qvalue1 <- q5(x,n,0.25,i,f)
qvalue3 <- q5(x,n,0.75,i,f)
}
if (def==6) {
qvalue1 <- q6(x,n,0.25,i,f)
qvalue3 <- q6(x,n,0.75,i,f)
}
if (def==7) {
qvalue1 <- q7(x,n,0.25,i,f)
qvalue3 <- q7(x,n,0.75,i,f)
}
if (def==8) {
qvalue1 <- q8(x,n,0.25,i,f)
qvalue3 <- q8(x,n,0.75,i,f)
}
midm <- 0
myn <- 0
roundno4 <- round(n/4)
round3no4 <- round(3*n/4)
for (i in 1:n) {
if ((x[i]>=qvalue1) & (x[i]<=qvalue3)){
midm = midm + x[i]
myn = myn + 1
}
}
midm = midm / myn
return(midm)
}
(arm <- mean(x))
sqrtn <- sqrt(length(x))
(armse <- sd(x) / sqrtn)
(armose <- arm / armse)
(geo <- geomean(x))
(har <- harmean(x))
(qua <- quamean(x))
(win <- winmean(x))
(tri <- trimean(x))
(midr <- midrange(x))
midm <- array(NA,dim=8)
for (j in 1:8) midm[j] <- midmean(x,j)
midm
bitmap(file='test1.png')
lb <- win[,1] - 2*win[,2]
ub <- win[,1] + 2*win[,2]
if ((ylimmin == '') | (ylimmax == '')) plot(win[,1],type='b',main=main, xlab='j', pch=19, ylab='Winsorized Mean(j/n)', ylim=c(min(lb),max(ub))) else plot(win[,1],type='l',main=main, xlab='j', pch=19, ylab='Winsorized Mean(j/n)', ylim=c(ylimmin,ylimmax))
lines(ub,lty=3)
lines(lb,lty=3)
grid()
dev.off()
bitmap(file='test2.png')
lb <- tri[,1] - 2*tri[,2]
ub <- tri[,1] + 2*tri[,2]
if ((ylimmin == '') | (ylimmax == '')) plot(tri[,1],type='b',main=main, xlab='j', pch=19, ylab='Trimmed Mean(j/n)', ylim=c(min(lb),max(ub))) else plot(tri[,1],type='l',main=main, xlab='j', pch=19, ylab='Trimmed Mean(j/n)', ylim=c(ylimmin,ylimmax))
lines(ub,lty=3)
lines(lb,lty=3)
grid()
dev.off()
load(file='createtable')
a<-table.start()
a<-table.row.start(a)
a<-table.element(a,'Central Tendency - Ungrouped Data',4,TRUE)
a<-table.row.end(a)
a<-table.row.start(a)
a<-table.element(a,'Measure',header=TRUE)
a<-table.element(a,'Value',header=TRUE)
a<-table.element(a,'S.E.',header=TRUE)
a<-table.element(a,'Value/S.E.',header=TRUE)
a<-table.row.end(a)
a<-table.row.start(a)
a<-table.element(a,hyperlink('arithmetic_mean.htm', 'Arithmetic Mean', 'click to view the definition of the Arithmetic Mean'),header=TRUE)
a<-table.element(a,arm)
a<-table.element(a,hyperlink('arithmetic_mean_standard_error.htm', armse, 'click to view the definition of the Standard Error of the Arithmetic Mean'))
a<-table.element(a,armose)
a<-table.row.end(a)
a<-table.row.start(a)
a<-table.element(a,hyperlink('geometric_mean.htm', 'Geometric Mean', 'click to view the definition of the Geometric Mean'),header=TRUE)
a<-table.element(a,geo)
a<-table.element(a,'')
a<-table.row.end(a)
a<-table.row.start(a)
a<-table.element(a,hyperlink('harmonic_mean.htm', 'Harmonic Mean', 'click to view the definition of the Harmonic Mean'),header=TRUE)
a<-table.element(a,har)
a<-table.element(a,'')
a<-table.row.end(a)
a<-table.row.start(a)
a<-table.element(a,hyperlink('quadratic_mean.htm', 'Quadratic Mean', 'click to view the definition of the Quadratic Mean'),header=TRUE)
a<-table.element(a,qua)
a<-table.element(a,'')
a<-table.row.end(a)
for (j in 1:length(win[,1])) {
a<-table.row.start(a)
mylabel <- paste('Winsorized Mean (',j)
mylabel <- paste(mylabel,'/')
mylabel <- paste(mylabel,length(win[,1]))
mylabel <- paste(mylabel,')')
a<-table.element(a,hyperlink('winsorized_mean.htm', mylabel, 'click to view the definition of the Winsorized Mean'),header=TRUE)
a<-table.element(a,win[j,1])
a<-table.element(a,win[j,2])
a<-table.element(a,win[j,1]/win[j,2])
a<-table.row.end(a)
}
for (j in 1:length(tri[,1])) {
a<-table.row.start(a)
mylabel <- paste('Trimmed Mean (',j)
mylabel <- paste(mylabel,'/')
mylabel <- paste(mylabel,length(tri[,1]))
mylabel <- paste(mylabel,')')
a<-table.element(a,hyperlink('arithmetic_mean.htm', mylabel, 'click to view the definition of the Trimmed Mean'),header=TRUE)
a<-table.element(a,tri[j,1])
a<-table.element(a,tri[j,2])
a<-table.element(a,tri[j,1]/tri[j,2])
a<-table.row.end(a)
}
a<-table.row.start(a)
a<-table.element(a,hyperlink('median_1.htm', 'Median', 'click to view the definition of the Median'),header=TRUE)
a<-table.element(a,median(x))
a<-table.element(a,'')
a<-table.row.end(a)
a<-table.row.start(a)
a<-table.element(a,hyperlink('midrange.htm', 'Midrange', 'click to view the definition of the Midrange'),header=TRUE)
a<-table.element(a,midr)
a<-table.element(a,'')
a<-table.row.end(a)
a<-table.row.start(a)
mymid <- hyperlink('midmean.htm', 'Midmean', 'click to view the definition of the Midmean')
mylabel <- paste(mymid,hyperlink('method_1.htm','Weighted Average at Xnp',''),sep=' - ')
a<-table.element(a,mylabel,header=TRUE)
a<-table.element(a,midm[1])
a<-table.element(a,'')
a<-table.row.end(a)
a<-table.row.start(a)
mymid <- hyperlink('midmean.htm', 'Midmean', 'click to view the definition of the Midmean')
mylabel <- paste(mymid,hyperlink('method_2.htm','Weighted Average at X(n+1)p',''),sep=' - ')
a<-table.element(a,mylabel,header=TRUE)
a<-table.element(a,midm[2])
a<-table.element(a,'')
a<-table.row.end(a)
a<-table.row.start(a)
mymid <- hyperlink('midmean.htm', 'Midmean', 'click to view the definition of the Midmean')
mylabel <- paste(mymid,hyperlink('method_3.htm','Empirical Distribution Function',''),sep=' - ')
a<-table.element(a,mylabel,header=TRUE)
a<-table.element(a,midm[3])
a<-table.element(a,'')
a<-table.row.end(a)
a<-table.row.start(a)
mymid <- hyperlink('midmean.htm', 'Midmean', 'click to view the definition of the Midmean')
mylabel <- paste(mymid,hyperlink('method_4.htm','Empirical Distribution Function - Averaging',''),sep=' - ')
a<-table.element(a,mylabel,header=TRUE)
a<-table.element(a,midm[4])
a<-table.element(a,'')
a<-table.row.end(a)
a<-table.row.start(a)
mymid <- hyperlink('midmean.htm', 'Midmean', 'click to view the definition of the Midmean')
mylabel <- paste(mymid,hyperlink('method_5.htm','Empirical Distribution Function - Interpolation',''),sep=' - ')
a<-table.element(a,mylabel,header=TRUE)
a<-table.element(a,midm[5])
a<-table.element(a,'')
a<-table.row.end(a)
a<-table.row.start(a)
mymid <- hyperlink('midmean.htm', 'Midmean', 'click to view the definition of the Midmean')
mylabel <- paste(mymid,hyperlink('method_6.htm','Closest Observation',''),sep=' - ')
a<-table.element(a,mylabel,header=TRUE)
a<-table.element(a,midm[6])
a<-table.element(a,'')
a<-table.row.end(a)
a<-table.row.start(a)
mymid <- hyperlink('midmean.htm', 'Midmean', 'click to view the definition of the Midmean')
mylabel <- paste(mymid,hyperlink('method_7.htm','True Basic - Statistics Graphics Toolkit',''),sep=' - ')
a<-table.element(a,mylabel,header=TRUE)
a<-table.element(a,midm[7])
a<-table.element(a,'')
a<-table.row.end(a)
a<-table.row.start(a)
mymid <- hyperlink('midmean.htm', 'Midmean', 'click to view the definition of the Midmean')
mylabel <- paste(mymid,hyperlink('method_8.htm','MS Excel (old versions)',''),sep=' - ')
a<-table.element(a,mylabel,header=TRUE)
a<-table.element(a,midm[8])
a<-table.element(a,'')
a<-table.row.end(a)
a<-table.row.start(a)
a<-table.element(a,'Number of observations',header=TRUE)
a<-table.element(a,length(x))
a<-table.element(a,'')
a<-table.row.end(a)
a<-table.end(a)
table.save(a,file='mytable.tab')