Free Statistics

of Irreproducible Research!

Author's title

Author*Unverified author*
R Software Modulerwasp_centraltendency.wasp
Title produced by softwareCentral Tendency
Date of computationSat, 11 Oct 2014 15:03:53 +0100
Cite this page as followsStatistical Computations at FreeStatistics.org, Office for Research Development and Education, URL https://freestatistics.org/blog/index.php?v=date/2014/Oct/11/t141303629775fvyvsox6ezff2.htm/, Retrieved Tue, 14 May 2024 23:22:23 +0000
Statistical Computations at FreeStatistics.org, Office for Research Development and Education, URL https://freestatistics.org/blog/index.php?pk=240470, Retrieved Tue, 14 May 2024 23:22:23 +0000
QR Codes:

Original text written by user:
IsPrivate?No (this computation is public)
User-defined keywords
Estimated Impact83
Family? (F = Feedback message, R = changed R code, M = changed R Module, P = changed Parameters, D = changed Data)
-       [Central Tendency] [Indexcijfers graan ] [2014-10-11 14:03:53] [12dd06d3a2c25ae97856df636a27679f] [Current]
Feedback Forum

Post a new message
Dataseries X:
123,2
136,9
146,8
149,6
146,5
157
147,9
133,6
128,7
100,8
91,8
89,3
96,7
91,6
93,3
93,3
101
100,4
86,9
83,9
80,3
87,7
92,7
95,5
92
87,4
86,8
83,7
85
81,7
90,9
101,5
113,8
120,1
122,1
132,5
140
149,4
144,3
154,4
151,4
145,5
136,8
146,6
145,1
133,6
131,4
127,5
130,1
131,1
132,3
128,6
125,1
128,7
156,1
163,2
159,8
157,4
156,2
152,5
149,4
145,9
144,8
135,9
137,6
136
117,7
111,5
107,8
107,3
102,6
101


Summary of computational transaction
Raw Inputview raw input (R code)
Raw Outputview raw output of R engine
Computing time1 seconds
R Server'Herman Ole Andreas Wold' @ wold.wessa.net

\begin{tabular}{lllllllll}
\hline
Summary of computational transaction \tabularnewline
Raw Input & view raw input (R code)  \tabularnewline
Raw Output & view raw output of R engine  \tabularnewline
Computing time & 1 seconds \tabularnewline
R Server & 'Herman Ole Andreas Wold' @ wold.wessa.net \tabularnewline
\hline
\end{tabular}
%Source: https://freestatistics.org/blog/index.php?pk=240470&T=0

[TABLE]
[ROW][C]Summary of computational transaction[/C][/ROW]
[ROW][C]Raw Input[/C][C]view raw input (R code) [/C][/ROW]
[ROW][C]Raw Output[/C][C]view raw output of R engine [/C][/ROW]
[ROW][C]Computing time[/C][C]1 seconds[/C][/ROW]
[ROW][C]R Server[/C][C]'Herman Ole Andreas Wold' @ wold.wessa.net[/C][/ROW]
[/TABLE]
Source: https://freestatistics.org/blog/index.php?pk=240470&T=0

Globally Unique Identifier (entire table): ba.freestatistics.org/blog/index.php?pk=240470&T=0

As an alternative you can also use a QR Code:  

The GUIDs for individual cells are displayed in the table below:

Summary of computational transaction
Raw Inputview raw input (R code)
Raw Outputview raw output of R engine
Computing time1 seconds
R Server'Herman Ole Andreas Wold' @ wold.wessa.net


Central Tendency - Ungrouped Data
MeasureValueS.E.Value/S.E.
Arithmetic Mean121.9097222222222.9614087761478241.1661244486489
Geometric Mean119.235158135495
Harmonic Mean116.492370220584
Quadratic Mean124.437318558381
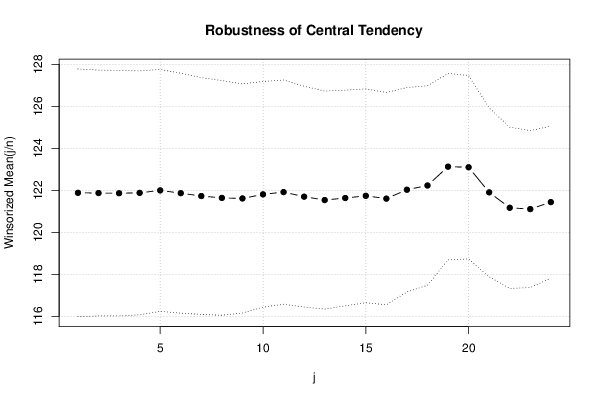
Winsorized Mean ( 1 / 24 )121.8819444444442.9487048736490141.3340600931744
Winsorized Mean ( 2 / 24 )121.8708333333332.926531565039741.643437162681
Winsorized Mean ( 3 / 24 )121.86252.9221674737295141.7027775086652
Winsorized Mean ( 4 / 24 )121.8791666666672.9036469550672641.9745129324248
Winsorized Mean ( 5 / 24 )121.9972222222222.8805517073270242.3520334357853
Winsorized Mean ( 6 / 24 )121.8638888888892.855937385035642.6703643880379
Winsorized Mean ( 7 / 24 )121.7277777777782.8185503759072143.1880795242473
Winsorized Mean ( 8 / 24 )121.6388888888892.7942747998547243.53146973777
Winsorized Mean ( 9 / 24 )121.6138888888892.7273324611245644.590782613552
Winsorized Mean ( 10 / 24 )121.8083333333332.6867675149119745.3363875576426
Winsorized Mean ( 11 / 24 )121.9152777777782.6695507142827745.6688375034422
Winsorized Mean ( 12 / 24 )121.6986111111112.6285349497810546.2990271905071
Winsorized Mean ( 13 / 24 )121.5361111111112.595188084791646.8313305780575
Winsorized Mean ( 14 / 24 )121.6333333333332.5681509030882247.3622220513086
Winsorized Mean ( 15 / 24 )121.73752.5455455566817947.8237365190545
Winsorized Mean ( 16 / 24 )121.6041666666672.5273847858277948.1146232059942
Winsorized Mean ( 17 / 24 )122.0291666666672.4337147086016250.1411140078876
Winsorized Mean ( 18 / 24 )122.2291666666672.3743909831954451.4781127167908
Winsorized Mean ( 19 / 24 )123.1263888888892.2191115687059255.4845419334595
Winsorized Mean ( 20 / 24 )123.0986111111112.184061174112956.3622542125496
Winsorized Mean ( 21 / 24 )121.9027777777782.0100860431118260.6455520625674
Winsorized Mean ( 22 / 24 )121.1694444444441.9193282590320463.1311730415269
Winsorized Mean ( 23 / 24 )121.1055555555561.8689172474909264.7998490666953
Winsorized Mean ( 24 / 24 )121.4388888888891.8109901358446467.0566263643673
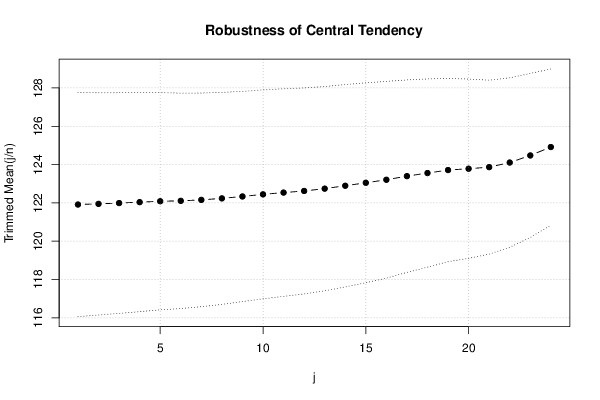
Trimmed Mean ( 1 / 24 )121.9142857142862.9275476673442241.643826016634
Trimmed Mean ( 2 / 24 )121.9485294117652.9010264998136442.0363376272497
Trimmed Mean ( 3 / 24 )121.9909090909092.8816279451596642.3340248680682
Trimmed Mean ( 4 / 24 )122.03906252.8585412401718842.692776576021
Trimmed Mean ( 5 / 24 )122.0854838709682.8355004228879543.0560626567017
Trimmed Mean ( 6 / 24 )122.1066666666672.8126749704937843.4130029056398
Trimmed Mean ( 7 / 24 )122.1568965517242.7893867128693443.7934604004999
Trimmed Mean ( 8 / 24 )122.2357142857142.767730830800344.1645961108036
Trimmed Mean ( 9 / 24 )122.3351851851852.7440312678491244.5822854201935
Trimmed Mean ( 10 / 24 )122.4461538461542.7265169875497144.9093676677198
Trimmed Mean ( 11 / 24 )122.5382.7099663225560145.2175360926343
Trimmed Mean ( 12 / 24 )122.6229166666672.6890839214743145.600256536225
Trimmed Mean ( 13 / 24 )122.743478260872.6670174627489546.0227501226615
Trimmed Mean ( 14 / 24 )122.8954545454552.64125057378246.5292675240126
Trimmed Mean ( 15 / 24 )123.052.6093178206125747.1579196018033
Trimmed Mean ( 16 / 24 )123.20752.5680916478074747.9762862455433
Trimmed Mean ( 17 / 24 )123.3973684210532.5127795325618649.1079168792994
Trimmed Mean ( 18 / 24 )123.5583333333332.4575519339245950.2769978643001
Trimmed Mean ( 19 / 24 )123.7147058823532.3927256526965351.7045093502175
Trimmed Mean ( 20 / 24 )123.7843752.3407509710276652.8823341449496
Trimmed Mean ( 21 / 24 )123.8666666666672.2707299617935654.5492721507182
Trimmed Mean ( 22 / 24 )124.1071428571432.212613722730856.0907408203048
Trimmed Mean ( 23 / 24 )124.4769230769232.1417340759466458.1196911768351
Trimmed Mean ( 24 / 24 )124.9166666666672.0388674984727461.2676727449126
Median128.65
Midrange121.75
Midmean - Weighted Average at Xnp122.8
Midmean - Weighted Average at X(n+1)p123.558333333333
Midmean - Empirical Distribution Function122.8
Midmean - Empirical Distribution Function - Averaging123.558333333333
Midmean - Empirical Distribution Function - Interpolation123.558333333333
Midmean - Closest Observation122.8
Midmean - True Basic - Statistics Graphics Toolkit123.558333333333
Midmean - MS Excel (old versions)123.397368421053
Number of observations72

\begin{tabular}{lllllllll}
\hline
Central Tendency - Ungrouped Data \tabularnewline
Measure & Value & S.E. & Value/S.E. \tabularnewline
Arithmetic Mean & 121.909722222222 & 2.96140877614782 & 41.1661244486489 \tabularnewline
Geometric Mean & 119.235158135495 &  &  \tabularnewline
Harmonic Mean & 116.492370220584 &  &  \tabularnewline
Quadratic Mean & 124.437318558381 &  &  \tabularnewline
Winsorized Mean ( 1 / 24 ) & 121.881944444444 & 2.94870487364901 & 41.3340600931744 \tabularnewline
Winsorized Mean ( 2 / 24 ) & 121.870833333333 & 2.9265315650397 & 41.643437162681 \tabularnewline
Winsorized Mean ( 3 / 24 ) & 121.8625 & 2.92216747372951 & 41.7027775086652 \tabularnewline
Winsorized Mean ( 4 / 24 ) & 121.879166666667 & 2.90364695506726 & 41.9745129324248 \tabularnewline
Winsorized Mean ( 5 / 24 ) & 121.997222222222 & 2.88055170732702 & 42.3520334357853 \tabularnewline
Winsorized Mean ( 6 / 24 ) & 121.863888888889 & 2.8559373850356 & 42.6703643880379 \tabularnewline
Winsorized Mean ( 7 / 24 ) & 121.727777777778 & 2.81855037590721 & 43.1880795242473 \tabularnewline
Winsorized Mean ( 8 / 24 ) & 121.638888888889 & 2.79427479985472 & 43.53146973777 \tabularnewline
Winsorized Mean ( 9 / 24 ) & 121.613888888889 & 2.72733246112456 & 44.590782613552 \tabularnewline
Winsorized Mean ( 10 / 24 ) & 121.808333333333 & 2.68676751491197 & 45.3363875576426 \tabularnewline
Winsorized Mean ( 11 / 24 ) & 121.915277777778 & 2.66955071428277 & 45.6688375034422 \tabularnewline
Winsorized Mean ( 12 / 24 ) & 121.698611111111 & 2.62853494978105 & 46.2990271905071 \tabularnewline
Winsorized Mean ( 13 / 24 ) & 121.536111111111 & 2.5951880847916 & 46.8313305780575 \tabularnewline
Winsorized Mean ( 14 / 24 ) & 121.633333333333 & 2.56815090308822 & 47.3622220513086 \tabularnewline
Winsorized Mean ( 15 / 24 ) & 121.7375 & 2.54554555668179 & 47.8237365190545 \tabularnewline
Winsorized Mean ( 16 / 24 ) & 121.604166666667 & 2.52738478582779 & 48.1146232059942 \tabularnewline
Winsorized Mean ( 17 / 24 ) & 122.029166666667 & 2.43371470860162 & 50.1411140078876 \tabularnewline
Winsorized Mean ( 18 / 24 ) & 122.229166666667 & 2.37439098319544 & 51.4781127167908 \tabularnewline
Winsorized Mean ( 19 / 24 ) & 123.126388888889 & 2.21911156870592 & 55.4845419334595 \tabularnewline
Winsorized Mean ( 20 / 24 ) & 123.098611111111 & 2.1840611741129 & 56.3622542125496 \tabularnewline
Winsorized Mean ( 21 / 24 ) & 121.902777777778 & 2.01008604311182 & 60.6455520625674 \tabularnewline
Winsorized Mean ( 22 / 24 ) & 121.169444444444 & 1.91932825903204 & 63.1311730415269 \tabularnewline
Winsorized Mean ( 23 / 24 ) & 121.105555555556 & 1.86891724749092 & 64.7998490666953 \tabularnewline
Winsorized Mean ( 24 / 24 ) & 121.438888888889 & 1.81099013584464 & 67.0566263643673 \tabularnewline
Trimmed Mean ( 1 / 24 ) & 121.914285714286 & 2.92754766734422 & 41.643826016634 \tabularnewline
Trimmed Mean ( 2 / 24 ) & 121.948529411765 & 2.90102649981364 & 42.0363376272497 \tabularnewline
Trimmed Mean ( 3 / 24 ) & 121.990909090909 & 2.88162794515966 & 42.3340248680682 \tabularnewline
Trimmed Mean ( 4 / 24 ) & 122.0390625 & 2.85854124017188 & 42.692776576021 \tabularnewline
Trimmed Mean ( 5 / 24 ) & 122.085483870968 & 2.83550042288795 & 43.0560626567017 \tabularnewline
Trimmed Mean ( 6 / 24 ) & 122.106666666667 & 2.81267497049378 & 43.4130029056398 \tabularnewline
Trimmed Mean ( 7 / 24 ) & 122.156896551724 & 2.78938671286934 & 43.7934604004999 \tabularnewline
Trimmed Mean ( 8 / 24 ) & 122.235714285714 & 2.7677308308003 & 44.1645961108036 \tabularnewline
Trimmed Mean ( 9 / 24 ) & 122.335185185185 & 2.74403126784912 & 44.5822854201935 \tabularnewline
Trimmed Mean ( 10 / 24 ) & 122.446153846154 & 2.72651698754971 & 44.9093676677198 \tabularnewline
Trimmed Mean ( 11 / 24 ) & 122.538 & 2.70996632255601 & 45.2175360926343 \tabularnewline
Trimmed Mean ( 12 / 24 ) & 122.622916666667 & 2.68908392147431 & 45.600256536225 \tabularnewline
Trimmed Mean ( 13 / 24 ) & 122.74347826087 & 2.66701746274895 & 46.0227501226615 \tabularnewline
Trimmed Mean ( 14 / 24 ) & 122.895454545455 & 2.641250573782 & 46.5292675240126 \tabularnewline
Trimmed Mean ( 15 / 24 ) & 123.05 & 2.60931782061257 & 47.1579196018033 \tabularnewline
Trimmed Mean ( 16 / 24 ) & 123.2075 & 2.56809164780747 & 47.9762862455433 \tabularnewline
Trimmed Mean ( 17 / 24 ) & 123.397368421053 & 2.51277953256186 & 49.1079168792994 \tabularnewline
Trimmed Mean ( 18 / 24 ) & 123.558333333333 & 2.45755193392459 & 50.2769978643001 \tabularnewline
Trimmed Mean ( 19 / 24 ) & 123.714705882353 & 2.39272565269653 & 51.7045093502175 \tabularnewline
Trimmed Mean ( 20 / 24 ) & 123.784375 & 2.34075097102766 & 52.8823341449496 \tabularnewline
Trimmed Mean ( 21 / 24 ) & 123.866666666667 & 2.27072996179356 & 54.5492721507182 \tabularnewline
Trimmed Mean ( 22 / 24 ) & 124.107142857143 & 2.2126137227308 & 56.0907408203048 \tabularnewline
Trimmed Mean ( 23 / 24 ) & 124.476923076923 & 2.14173407594664 & 58.1196911768351 \tabularnewline
Trimmed Mean ( 24 / 24 ) & 124.916666666667 & 2.03886749847274 & 61.2676727449126 \tabularnewline
Median & 128.65 &  &  \tabularnewline
Midrange & 121.75 &  &  \tabularnewline
Midmean - Weighted Average at Xnp & 122.8 &  &  \tabularnewline
Midmean - Weighted Average at X(n+1)p & 123.558333333333 &  &  \tabularnewline
Midmean - Empirical Distribution Function & 122.8 &  &  \tabularnewline
Midmean - Empirical Distribution Function - Averaging & 123.558333333333 &  &  \tabularnewline
Midmean - Empirical Distribution Function - Interpolation & 123.558333333333 &  &  \tabularnewline
Midmean - Closest Observation & 122.8 &  &  \tabularnewline
Midmean - True Basic - Statistics Graphics Toolkit & 123.558333333333 &  &  \tabularnewline
Midmean - MS Excel (old versions) & 123.397368421053 &  &  \tabularnewline
Number of observations & 72 &  &  \tabularnewline
\hline
\end{tabular}
%Source: https://freestatistics.org/blog/index.php?pk=240470&T=1

[TABLE]
[ROW][C]Central Tendency - Ungrouped Data[/C][/ROW]
[ROW][C]Measure[/C][C]Value[/C][C]S.E.[/C][C]Value/S.E.[/C][/ROW]
[ROW][C]Arithmetic Mean[/C][C]121.909722222222[/C][C]2.96140877614782[/C][C]41.1661244486489[/C][/ROW]
[ROW][C]Geometric Mean[/C][C]119.235158135495[/C][C][/C][C][/C][/ROW]
[ROW][C]Harmonic Mean[/C][C]116.492370220584[/C][C][/C][C][/C][/ROW]
[ROW][C]Quadratic Mean[/C][C]124.437318558381[/C][C][/C][C][/C][/ROW]
[ROW][C]Winsorized Mean ( 1 / 24 )[/C][C]121.881944444444[/C][C]2.94870487364901[/C][C]41.3340600931744[/C][/ROW]
[ROW][C]Winsorized Mean ( 2 / 24 )[/C][C]121.870833333333[/C][C]2.9265315650397[/C][C]41.643437162681[/C][/ROW]
[ROW][C]Winsorized Mean ( 3 / 24 )[/C][C]121.8625[/C][C]2.92216747372951[/C][C]41.7027775086652[/C][/ROW]
[ROW][C]Winsorized Mean ( 4 / 24 )[/C][C]121.879166666667[/C][C]2.90364695506726[/C][C]41.9745129324248[/C][/ROW]
[ROW][C]Winsorized Mean ( 5 / 24 )[/C][C]121.997222222222[/C][C]2.88055170732702[/C][C]42.3520334357853[/C][/ROW]
[ROW][C]Winsorized Mean ( 6 / 24 )[/C][C]121.863888888889[/C][C]2.8559373850356[/C][C]42.6703643880379[/C][/ROW]
[ROW][C]Winsorized Mean ( 7 / 24 )[/C][C]121.727777777778[/C][C]2.81855037590721[/C][C]43.1880795242473[/C][/ROW]
[ROW][C]Winsorized Mean ( 8 / 24 )[/C][C]121.638888888889[/C][C]2.79427479985472[/C][C]43.53146973777[/C][/ROW]
[ROW][C]Winsorized Mean ( 9 / 24 )[/C][C]121.613888888889[/C][C]2.72733246112456[/C][C]44.590782613552[/C][/ROW]
[ROW][C]Winsorized Mean ( 10 / 24 )[/C][C]121.808333333333[/C][C]2.68676751491197[/C][C]45.3363875576426[/C][/ROW]
[ROW][C]Winsorized Mean ( 11 / 24 )[/C][C]121.915277777778[/C][C]2.66955071428277[/C][C]45.6688375034422[/C][/ROW]
[ROW][C]Winsorized Mean ( 12 / 24 )[/C][C]121.698611111111[/C][C]2.62853494978105[/C][C]46.2990271905071[/C][/ROW]
[ROW][C]Winsorized Mean ( 13 / 24 )[/C][C]121.536111111111[/C][C]2.5951880847916[/C][C]46.8313305780575[/C][/ROW]
[ROW][C]Winsorized Mean ( 14 / 24 )[/C][C]121.633333333333[/C][C]2.56815090308822[/C][C]47.3622220513086[/C][/ROW]
[ROW][C]Winsorized Mean ( 15 / 24 )[/C][C]121.7375[/C][C]2.54554555668179[/C][C]47.8237365190545[/C][/ROW]
[ROW][C]Winsorized Mean ( 16 / 24 )[/C][C]121.604166666667[/C][C]2.52738478582779[/C][C]48.1146232059942[/C][/ROW]
[ROW][C]Winsorized Mean ( 17 / 24 )[/C][C]122.029166666667[/C][C]2.43371470860162[/C][C]50.1411140078876[/C][/ROW]
[ROW][C]Winsorized Mean ( 18 / 24 )[/C][C]122.229166666667[/C][C]2.37439098319544[/C][C]51.4781127167908[/C][/ROW]
[ROW][C]Winsorized Mean ( 19 / 24 )[/C][C]123.126388888889[/C][C]2.21911156870592[/C][C]55.4845419334595[/C][/ROW]
[ROW][C]Winsorized Mean ( 20 / 24 )[/C][C]123.098611111111[/C][C]2.1840611741129[/C][C]56.3622542125496[/C][/ROW]
[ROW][C]Winsorized Mean ( 21 / 24 )[/C][C]121.902777777778[/C][C]2.01008604311182[/C][C]60.6455520625674[/C][/ROW]
[ROW][C]Winsorized Mean ( 22 / 24 )[/C][C]121.169444444444[/C][C]1.91932825903204[/C][C]63.1311730415269[/C][/ROW]
[ROW][C]Winsorized Mean ( 23 / 24 )[/C][C]121.105555555556[/C][C]1.86891724749092[/C][C]64.7998490666953[/C][/ROW]
[ROW][C]Winsorized Mean ( 24 / 24 )[/C][C]121.438888888889[/C][C]1.81099013584464[/C][C]67.0566263643673[/C][/ROW]
[ROW][C]Trimmed Mean ( 1 / 24 )[/C][C]121.914285714286[/C][C]2.92754766734422[/C][C]41.643826016634[/C][/ROW]
[ROW][C]Trimmed Mean ( 2 / 24 )[/C][C]121.948529411765[/C][C]2.90102649981364[/C][C]42.0363376272497[/C][/ROW]
[ROW][C]Trimmed Mean ( 3 / 24 )[/C][C]121.990909090909[/C][C]2.88162794515966[/C][C]42.3340248680682[/C][/ROW]
[ROW][C]Trimmed Mean ( 4 / 24 )[/C][C]122.0390625[/C][C]2.85854124017188[/C][C]42.692776576021[/C][/ROW]
[ROW][C]Trimmed Mean ( 5 / 24 )[/C][C]122.085483870968[/C][C]2.83550042288795[/C][C]43.0560626567017[/C][/ROW]
[ROW][C]Trimmed Mean ( 6 / 24 )[/C][C]122.106666666667[/C][C]2.81267497049378[/C][C]43.4130029056398[/C][/ROW]
[ROW][C]Trimmed Mean ( 7 / 24 )[/C][C]122.156896551724[/C][C]2.78938671286934[/C][C]43.7934604004999[/C][/ROW]
[ROW][C]Trimmed Mean ( 8 / 24 )[/C][C]122.235714285714[/C][C]2.7677308308003[/C][C]44.1645961108036[/C][/ROW]
[ROW][C]Trimmed Mean ( 9 / 24 )[/C][C]122.335185185185[/C][C]2.74403126784912[/C][C]44.5822854201935[/C][/ROW]
[ROW][C]Trimmed Mean ( 10 / 24 )[/C][C]122.446153846154[/C][C]2.72651698754971[/C][C]44.9093676677198[/C][/ROW]
[ROW][C]Trimmed Mean ( 11 / 24 )[/C][C]122.538[/C][C]2.70996632255601[/C][C]45.2175360926343[/C][/ROW]
[ROW][C]Trimmed Mean ( 12 / 24 )[/C][C]122.622916666667[/C][C]2.68908392147431[/C][C]45.600256536225[/C][/ROW]
[ROW][C]Trimmed Mean ( 13 / 24 )[/C][C]122.74347826087[/C][C]2.66701746274895[/C][C]46.0227501226615[/C][/ROW]
[ROW][C]Trimmed Mean ( 14 / 24 )[/C][C]122.895454545455[/C][C]2.641250573782[/C][C]46.5292675240126[/C][/ROW]
[ROW][C]Trimmed Mean ( 15 / 24 )[/C][C]123.05[/C][C]2.60931782061257[/C][C]47.1579196018033[/C][/ROW]
[ROW][C]Trimmed Mean ( 16 / 24 )[/C][C]123.2075[/C][C]2.56809164780747[/C][C]47.9762862455433[/C][/ROW]
[ROW][C]Trimmed Mean ( 17 / 24 )[/C][C]123.397368421053[/C][C]2.51277953256186[/C][C]49.1079168792994[/C][/ROW]
[ROW][C]Trimmed Mean ( 18 / 24 )[/C][C]123.558333333333[/C][C]2.45755193392459[/C][C]50.2769978643001[/C][/ROW]
[ROW][C]Trimmed Mean ( 19 / 24 )[/C][C]123.714705882353[/C][C]2.39272565269653[/C][C]51.7045093502175[/C][/ROW]
[ROW][C]Trimmed Mean ( 20 / 24 )[/C][C]123.784375[/C][C]2.34075097102766[/C][C]52.8823341449496[/C][/ROW]
[ROW][C]Trimmed Mean ( 21 / 24 )[/C][C]123.866666666667[/C][C]2.27072996179356[/C][C]54.5492721507182[/C][/ROW]
[ROW][C]Trimmed Mean ( 22 / 24 )[/C][C]124.107142857143[/C][C]2.2126137227308[/C][C]56.0907408203048[/C][/ROW]
[ROW][C]Trimmed Mean ( 23 / 24 )[/C][C]124.476923076923[/C][C]2.14173407594664[/C][C]58.1196911768351[/C][/ROW]
[ROW][C]Trimmed Mean ( 24 / 24 )[/C][C]124.916666666667[/C][C]2.03886749847274[/C][C]61.2676727449126[/C][/ROW]
[ROW][C]Median[/C][C]128.65[/C][C][/C][C][/C][/ROW]
[ROW][C]Midrange[/C][C]121.75[/C][C][/C][C][/C][/ROW]
[ROW][C]Midmean - Weighted Average at Xnp[/C][C]122.8[/C][C][/C][C][/C][/ROW]
[ROW][C]Midmean - Weighted Average at X(n+1)p[/C][C]123.558333333333[/C][C][/C][C][/C][/ROW]
[ROW][C]Midmean - Empirical Distribution Function[/C][C]122.8[/C][C][/C][C][/C][/ROW]
[ROW][C]Midmean - Empirical Distribution Function - Averaging[/C][C]123.558333333333[/C][C][/C][C][/C][/ROW]
[ROW][C]Midmean - Empirical Distribution Function - Interpolation[/C][C]123.558333333333[/C][C][/C][C][/C][/ROW]
[ROW][C]Midmean - Closest Observation[/C][C]122.8[/C][C][/C][C][/C][/ROW]
[ROW][C]Midmean - True Basic - Statistics Graphics Toolkit[/C][C]123.558333333333[/C][C][/C][C][/C][/ROW]
[ROW][C]Midmean - MS Excel (old versions)[/C][C]123.397368421053[/C][C][/C][C][/C][/ROW]
[ROW][C]Number of observations[/C][C]72[/C][C][/C][C][/C][/ROW]
[/TABLE]
Source: https://freestatistics.org/blog/index.php?pk=240470&T=1

Globally Unique Identifier (entire table): ba.freestatistics.org/blog/index.php?pk=240470&T=1

As an alternative you can also use a QR Code:  

The GUIDs for individual cells are displayed in the table below:

Central Tendency - Ungrouped Data
MeasureValueS.E.Value/S.E.
Arithmetic Mean121.9097222222222.9614087761478241.1661244486489
Geometric Mean119.235158135495
Harmonic Mean116.492370220584
Quadratic Mean124.437318558381
Winsorized Mean ( 1 / 24 )121.8819444444442.9487048736490141.3340600931744
Winsorized Mean ( 2 / 24 )121.8708333333332.926531565039741.643437162681
Winsorized Mean ( 3 / 24 )121.86252.9221674737295141.7027775086652
Winsorized Mean ( 4 / 24 )121.8791666666672.9036469550672641.9745129324248
Winsorized Mean ( 5 / 24 )121.9972222222222.8805517073270242.3520334357853
Winsorized Mean ( 6 / 24 )121.8638888888892.855937385035642.6703643880379
Winsorized Mean ( 7 / 24 )121.7277777777782.8185503759072143.1880795242473
Winsorized Mean ( 8 / 24 )121.6388888888892.7942747998547243.53146973777
Winsorized Mean ( 9 / 24 )121.6138888888892.7273324611245644.590782613552
Winsorized Mean ( 10 / 24 )121.8083333333332.6867675149119745.3363875576426
Winsorized Mean ( 11 / 24 )121.9152777777782.6695507142827745.6688375034422
Winsorized Mean ( 12 / 24 )121.6986111111112.6285349497810546.2990271905071
Winsorized Mean ( 13 / 24 )121.5361111111112.595188084791646.8313305780575
Winsorized Mean ( 14 / 24 )121.6333333333332.5681509030882247.3622220513086
Winsorized Mean ( 15 / 24 )121.73752.5455455566817947.8237365190545
Winsorized Mean ( 16 / 24 )121.6041666666672.5273847858277948.1146232059942
Winsorized Mean ( 17 / 24 )122.0291666666672.4337147086016250.1411140078876
Winsorized Mean ( 18 / 24 )122.2291666666672.3743909831954451.4781127167908
Winsorized Mean ( 19 / 24 )123.1263888888892.2191115687059255.4845419334595
Winsorized Mean ( 20 / 24 )123.0986111111112.184061174112956.3622542125496
Winsorized Mean ( 21 / 24 )121.9027777777782.0100860431118260.6455520625674
Winsorized Mean ( 22 / 24 )121.1694444444441.9193282590320463.1311730415269
Winsorized Mean ( 23 / 24 )121.1055555555561.8689172474909264.7998490666953
Winsorized Mean ( 24 / 24 )121.4388888888891.8109901358446467.0566263643673
Trimmed Mean ( 1 / 24 )121.9142857142862.9275476673442241.643826016634
Trimmed Mean ( 2 / 24 )121.9485294117652.9010264998136442.0363376272497
Trimmed Mean ( 3 / 24 )121.9909090909092.8816279451596642.3340248680682
Trimmed Mean ( 4 / 24 )122.03906252.8585412401718842.692776576021
Trimmed Mean ( 5 / 24 )122.0854838709682.8355004228879543.0560626567017
Trimmed Mean ( 6 / 24 )122.1066666666672.8126749704937843.4130029056398
Trimmed Mean ( 7 / 24 )122.1568965517242.7893867128693443.7934604004999
Trimmed Mean ( 8 / 24 )122.2357142857142.767730830800344.1645961108036
Trimmed Mean ( 9 / 24 )122.3351851851852.7440312678491244.5822854201935
Trimmed Mean ( 10 / 24 )122.4461538461542.7265169875497144.9093676677198
Trimmed Mean ( 11 / 24 )122.5382.7099663225560145.2175360926343
Trimmed Mean ( 12 / 24 )122.6229166666672.6890839214743145.600256536225
Trimmed Mean ( 13 / 24 )122.743478260872.6670174627489546.0227501226615
Trimmed Mean ( 14 / 24 )122.8954545454552.64125057378246.5292675240126
Trimmed Mean ( 15 / 24 )123.052.6093178206125747.1579196018033
Trimmed Mean ( 16 / 24 )123.20752.5680916478074747.9762862455433
Trimmed Mean ( 17 / 24 )123.3973684210532.5127795325618649.1079168792994
Trimmed Mean ( 18 / 24 )123.5583333333332.4575519339245950.2769978643001
Trimmed Mean ( 19 / 24 )123.7147058823532.3927256526965351.7045093502175
Trimmed Mean ( 20 / 24 )123.7843752.3407509710276652.8823341449496
Trimmed Mean ( 21 / 24 )123.8666666666672.2707299617935654.5492721507182
Trimmed Mean ( 22 / 24 )124.1071428571432.212613722730856.0907408203048
Trimmed Mean ( 23 / 24 )124.4769230769232.1417340759466458.1196911768351
Trimmed Mean ( 24 / 24 )124.9166666666672.0388674984727461.2676727449126
Median128.65
Midrange121.75
Midmean - Weighted Average at Xnp122.8
Midmean - Weighted Average at X(n+1)p123.558333333333
Midmean - Empirical Distribution Function122.8
Midmean - Empirical Distribution Function - Averaging123.558333333333
Midmean - Empirical Distribution Function - Interpolation123.558333333333
Midmean - Closest Observation122.8
Midmean - True Basic - Statistics Graphics Toolkit123.558333333333
Midmean - MS Excel (old versions)123.397368421053
Number of observations72


Parameters (Session):
Parameters (R input):
R code (references can be found in the software module):
geomean <- function(x) {
return(exp(mean(log(x))))
}
harmean <- function(x) {
return(1/mean(1/x))
}
quamean <- function(x) {
return(sqrt(mean(x*x)))
}
winmean <- function(x) {
x <-sort(x[!is.na(x)])
n<-length(x)
denom <- 3
nodenom <- n/denom
if (nodenom>40) denom <- n/40
sqrtn = sqrt(n)
roundnodenom = floor(nodenom)
win <- array(NA,dim=c(roundnodenom,2))
for (j in 1:roundnodenom) {
win[j,1] <- (j*x[j+1]+sum(x[(j+1):(n-j)])+j*x[n-j])/n
win[j,2] <- sd(c(rep(x[j+1],j),x[(j+1):(n-j)],rep(x[n-j],j)))/sqrtn
}
return(win)
}
trimean <- function(x) {
x <-sort(x[!is.na(x)])
n<-length(x)
denom <- 3
nodenom <- n/denom
if (nodenom>40) denom <- n/40
sqrtn = sqrt(n)
roundnodenom = floor(nodenom)
tri <- array(NA,dim=c(roundnodenom,2))
for (j in 1:roundnodenom) {
tri[j,1] <- mean(x,trim=j/n)
tri[j,2] <- sd(x[(j+1):(n-j)]) / sqrt(n-j*2)
}
return(tri)
}
midrange <- function(x) {
return((max(x)+min(x))/2)
}
q1 <- function(data,n,p,i,f) {
np <- n*p;
i <<- floor(np)
f <<- np - i
qvalue <- (1-f)*data[i] + f*data[i+1]
}
q2 <- function(data,n,p,i,f) {
np <- (n+1)*p
i <<- floor(np)
f <<- np - i
qvalue <- (1-f)*data[i] + f*data[i+1]
}
q3 <- function(data,n,p,i,f) {
np <- n*p
i <<- floor(np)
f <<- np - i
if (f==0) {
qvalue <- data[i]
} else {
qvalue <- data[i+1]
}
}
q4 <- function(data,n,p,i,f) {
np <- n*p
i <<- floor(np)
f <<- np - i
if (f==0) {
qvalue <- (data[i]+data[i+1])/2
} else {
qvalue <- data[i+1]
}
}
q5 <- function(data,n,p,i,f) {
np <- (n-1)*p
i <<- floor(np)
f <<- np - i
if (f==0) {
qvalue <- data[i+1]
} else {
qvalue <- data[i+1] + f*(data[i+2]-data[i+1])
}
}
q6 <- function(data,n,p,i,f) {
np <- n*p+0.5
i <<- floor(np)
f <<- np - i
qvalue <- data[i]
}
q7 <- function(data,n,p,i,f) {
np <- (n+1)*p
i <<- floor(np)
f <<- np - i
if (f==0) {
qvalue <- data[i]
} else {
qvalue <- f*data[i] + (1-f)*data[i+1]
}
}
q8 <- function(data,n,p,i,f) {
np <- (n+1)*p
i <<- floor(np)
f <<- np - i
if (f==0) {
qvalue <- data[i]
} else {
if (f == 0.5) {
qvalue <- (data[i]+data[i+1])/2
} else {
if (f < 0.5) {
qvalue <- data[i]
} else {
qvalue <- data[i+1]
}
}
}
}
midmean <- function(x,def) {
x <-sort(x[!is.na(x)])
n<-length(x)
if (def==1) {
qvalue1 <- q1(x,n,0.25,i,f)
qvalue3 <- q1(x,n,0.75,i,f)
}
if (def==2) {
qvalue1 <- q2(x,n,0.25,i,f)
qvalue3 <- q2(x,n,0.75,i,f)
}
if (def==3) {
qvalue1 <- q3(x,n,0.25,i,f)
qvalue3 <- q3(x,n,0.75,i,f)
}
if (def==4) {
qvalue1 <- q4(x,n,0.25,i,f)
qvalue3 <- q4(x,n,0.75,i,f)
}
if (def==5) {
qvalue1 <- q5(x,n,0.25,i,f)
qvalue3 <- q5(x,n,0.75,i,f)
}
if (def==6) {
qvalue1 <- q6(x,n,0.25,i,f)
qvalue3 <- q6(x,n,0.75,i,f)
}
if (def==7) {
qvalue1 <- q7(x,n,0.25,i,f)
qvalue3 <- q7(x,n,0.75,i,f)
}
if (def==8) {
qvalue1 <- q8(x,n,0.25,i,f)
qvalue3 <- q8(x,n,0.75,i,f)
}
midm <- 0
myn <- 0
roundno4 <- round(n/4)
round3no4 <- round(3*n/4)
for (i in 1:n) {
if ((x[i]>=qvalue1) & (x[i]<=qvalue3)){
midm = midm + x[i]
myn = myn + 1
}
}
midm = midm / myn
return(midm)
}
(arm <- mean(x))
sqrtn <- sqrt(length(x))
(armse <- sd(x) / sqrtn)
(armose <- arm / armse)
(geo <- geomean(x))
(har <- harmean(x))
(qua <- quamean(x))
(win <- winmean(x))
(tri <- trimean(x))
(midr <- midrange(x))
midm <- array(NA,dim=8)
for (j in 1:8) midm[j] <- midmean(x,j)
midm
bitmap(file='test1.png')
lb <- win[,1] - 2*win[,2]
ub <- win[,1] + 2*win[,2]
if ((ylimmin == '') | (ylimmax == '')) plot(win[,1],type='b',main=main, xlab='j', pch=19, ylab='Winsorized Mean(j/n)', ylim=c(min(lb),max(ub))) else plot(win[,1],type='l',main=main, xlab='j', pch=19, ylab='Winsorized Mean(j/n)', ylim=c(ylimmin,ylimmax))
lines(ub,lty=3)
lines(lb,lty=3)
grid()
dev.off()
bitmap(file='test2.png')
lb <- tri[,1] - 2*tri[,2]
ub <- tri[,1] + 2*tri[,2]
if ((ylimmin == '') | (ylimmax == '')) plot(tri[,1],type='b',main=main, xlab='j', pch=19, ylab='Trimmed Mean(j/n)', ylim=c(min(lb),max(ub))) else plot(tri[,1],type='l',main=main, xlab='j', pch=19, ylab='Trimmed Mean(j/n)', ylim=c(ylimmin,ylimmax))
lines(ub,lty=3)
lines(lb,lty=3)
grid()
dev.off()
load(file='createtable')
a<-table.start()
a<-table.row.start(a)
a<-table.element(a,'Central Tendency - Ungrouped Data',4,TRUE)
a<-table.row.end(a)
a<-table.row.start(a)
a<-table.element(a,'Measure',header=TRUE)
a<-table.element(a,'Value',header=TRUE)
a<-table.element(a,'S.E.',header=TRUE)
a<-table.element(a,'Value/S.E.',header=TRUE)
a<-table.row.end(a)
a<-table.row.start(a)
a<-table.element(a,hyperlink('arithmetic_mean.htm', 'Arithmetic Mean', 'click to view the definition of the Arithmetic Mean'),header=TRUE)
a<-table.element(a,arm)
a<-table.element(a,hyperlink('arithmetic_mean_standard_error.htm', armse, 'click to view the definition of the Standard Error of the Arithmetic Mean'))
a<-table.element(a,armose)
a<-table.row.end(a)
a<-table.row.start(a)
a<-table.element(a,hyperlink('geometric_mean.htm', 'Geometric Mean', 'click to view the definition of the Geometric Mean'),header=TRUE)
a<-table.element(a,geo)
a<-table.element(a,'')
a<-table.row.end(a)
a<-table.row.start(a)
a<-table.element(a,hyperlink('harmonic_mean.htm', 'Harmonic Mean', 'click to view the definition of the Harmonic Mean'),header=TRUE)
a<-table.element(a,har)
a<-table.element(a,'')
a<-table.row.end(a)
a<-table.row.start(a)
a<-table.element(a,hyperlink('quadratic_mean.htm', 'Quadratic Mean', 'click to view the definition of the Quadratic Mean'),header=TRUE)
a<-table.element(a,qua)
a<-table.element(a,'')
a<-table.row.end(a)
for (j in 1:length(win[,1])) {
a<-table.row.start(a)
mylabel <- paste('Winsorized Mean (',j)
mylabel <- paste(mylabel,'/')
mylabel <- paste(mylabel,length(win[,1]))
mylabel <- paste(mylabel,')')
a<-table.element(a,hyperlink('winsorized_mean.htm', mylabel, 'click to view the definition of the Winsorized Mean'),header=TRUE)
a<-table.element(a,win[j,1])
a<-table.element(a,win[j,2])
a<-table.element(a,win[j,1]/win[j,2])
a<-table.row.end(a)
}
for (j in 1:length(tri[,1])) {
a<-table.row.start(a)
mylabel <- paste('Trimmed Mean (',j)
mylabel <- paste(mylabel,'/')
mylabel <- paste(mylabel,length(tri[,1]))
mylabel <- paste(mylabel,')')
a<-table.element(a,hyperlink('arithmetic_mean.htm', mylabel, 'click to view the definition of the Trimmed Mean'),header=TRUE)
a<-table.element(a,tri[j,1])
a<-table.element(a,tri[j,2])
a<-table.element(a,tri[j,1]/tri[j,2])
a<-table.row.end(a)
}
a<-table.row.start(a)
a<-table.element(a,hyperlink('median_1.htm', 'Median', 'click to view the definition of the Median'),header=TRUE)
a<-table.element(a,median(x))
a<-table.element(a,'')
a<-table.row.end(a)
a<-table.row.start(a)
a<-table.element(a,hyperlink('midrange.htm', 'Midrange', 'click to view the definition of the Midrange'),header=TRUE)
a<-table.element(a,midr)
a<-table.element(a,'')
a<-table.row.end(a)
a<-table.row.start(a)
mymid <- hyperlink('midmean.htm', 'Midmean', 'click to view the definition of the Midmean')
mylabel <- paste(mymid,hyperlink('method_1.htm','Weighted Average at Xnp',''),sep=' - ')
a<-table.element(a,mylabel,header=TRUE)
a<-table.element(a,midm[1])
a<-table.element(a,'')
a<-table.row.end(a)
a<-table.row.start(a)
mymid <- hyperlink('midmean.htm', 'Midmean', 'click to view the definition of the Midmean')
mylabel <- paste(mymid,hyperlink('method_2.htm','Weighted Average at X(n+1)p',''),sep=' - ')
a<-table.element(a,mylabel,header=TRUE)
a<-table.element(a,midm[2])
a<-table.element(a,'')
a<-table.row.end(a)
a<-table.row.start(a)
mymid <- hyperlink('midmean.htm', 'Midmean', 'click to view the definition of the Midmean')
mylabel <- paste(mymid,hyperlink('method_3.htm','Empirical Distribution Function',''),sep=' - ')
a<-table.element(a,mylabel,header=TRUE)
a<-table.element(a,midm[3])
a<-table.element(a,'')
a<-table.row.end(a)
a<-table.row.start(a)
mymid <- hyperlink('midmean.htm', 'Midmean', 'click to view the definition of the Midmean')
mylabel <- paste(mymid,hyperlink('method_4.htm','Empirical Distribution Function - Averaging',''),sep=' - ')
a<-table.element(a,mylabel,header=TRUE)
a<-table.element(a,midm[4])
a<-table.element(a,'')
a<-table.row.end(a)
a<-table.row.start(a)
mymid <- hyperlink('midmean.htm', 'Midmean', 'click to view the definition of the Midmean')
mylabel <- paste(mymid,hyperlink('method_5.htm','Empirical Distribution Function - Interpolation',''),sep=' - ')
a<-table.element(a,mylabel,header=TRUE)
a<-table.element(a,midm[5])
a<-table.element(a,'')
a<-table.row.end(a)
a<-table.row.start(a)
mymid <- hyperlink('midmean.htm', 'Midmean', 'click to view the definition of the Midmean')
mylabel <- paste(mymid,hyperlink('method_6.htm','Closest Observation',''),sep=' - ')
a<-table.element(a,mylabel,header=TRUE)
a<-table.element(a,midm[6])
a<-table.element(a,'')
a<-table.row.end(a)
a<-table.row.start(a)
mymid <- hyperlink('midmean.htm', 'Midmean', 'click to view the definition of the Midmean')
mylabel <- paste(mymid,hyperlink('method_7.htm','True Basic - Statistics Graphics Toolkit',''),sep=' - ')
a<-table.element(a,mylabel,header=TRUE)
a<-table.element(a,midm[7])
a<-table.element(a,'')
a<-table.row.end(a)
a<-table.row.start(a)
mymid <- hyperlink('midmean.htm', 'Midmean', 'click to view the definition of the Midmean')
mylabel <- paste(mymid,hyperlink('method_8.htm','MS Excel (old versions)',''),sep=' - ')
a<-table.element(a,mylabel,header=TRUE)
a<-table.element(a,midm[8])
a<-table.element(a,'')
a<-table.row.end(a)
a<-table.row.start(a)
a<-table.element(a,'Number of observations',header=TRUE)
a<-table.element(a,length(x))
a<-table.element(a,'')
a<-table.row.end(a)
a<-table.end(a)
table.save(a,file='mytable.tab')