Free Statistics

of Irreproducible Research!

Author's title

Author*Unverified author*
R Software Modulerwasp_autocorrelation.wasp
Title produced by software(Partial) Autocorrelation Function
Date of computationSun, 30 Nov 2014 12:00:12 +0000
Cite this page as followsStatistical Computations at FreeStatistics.org, Office for Research Development and Education, URL https://freestatistics.org/blog/index.php?v=date/2014/Nov/30/t1417348987t4l00tvttjro463.htm/, Retrieved Sun, 19 May 2024 20:16:11 +0000
Statistical Computations at FreeStatistics.org, Office for Research Development and Education, URL https://freestatistics.org/blog/index.php?pk=261367, Retrieved Sun, 19 May 2024 20:16:11 +0000
QR Codes:

Original text written by user:
IsPrivate?No (this computation is public)
User-defined keywords
Estimated Impact64
Family? (F = Feedback message, R = changed R code, M = changed R Module, P = changed Parameters, D = changed Data)
-       [(Partial) Autocorrelation Function] [] [2014-11-30 12:00:12] [11722998b98bb8551244d4a68b29baca] [Current]
Feedback Forum

Post a new message
Dataseries X:
15.579
16.348
15.928
16.171
15.937
15.713
15.594
15.683
16.438
17.032
17.696
17.745
19.394
20.148
20.108
18.584
18.441
18.391
19.178
18.079
18.483
19.644
19.195
19.650
20.830
23.595
22.937
21.814
21.928
21.777
21.383
21.467
22.052
22.680
24.320
24.977
25.204
25.739
26.434
27.525
30.695
32.436
30.160
30.236
31.293
31.077
32.226
33.865
32.810
32.242
32.700
32.819
33.947
34.148
35.261
39.506
41.591
39.148
41.216
40.225
41.126
42.362
40.740
40.256
39.804
41.002
41.702
42.254
43.605
43.271
43.221
41.373
40.435
39.217
39.457
36.710
34.977
32.729
31.584
32.510
32.565
30.988
30.383
28.673


Summary of computational transaction
Raw Inputview raw input (R code)
Raw Outputview raw output of R engine
Computing time1 seconds
R Server'Herman Ole Andreas Wold' @ wold.wessa.net

\begin{tabular}{lllllllll}
\hline
Summary of computational transaction \tabularnewline
Raw Input & view raw input (R code)  \tabularnewline
Raw Output & view raw output of R engine  \tabularnewline
Computing time & 1 seconds \tabularnewline
R Server & 'Herman Ole Andreas Wold' @ wold.wessa.net \tabularnewline
\hline
\end{tabular}
%Source: https://freestatistics.org/blog/index.php?pk=261367&T=0

[TABLE]
[ROW][C]Summary of computational transaction[/C][/ROW]
[ROW][C]Raw Input[/C][C]view raw input (R code) [/C][/ROW]
[ROW][C]Raw Output[/C][C]view raw output of R engine [/C][/ROW]
[ROW][C]Computing time[/C][C]1 seconds[/C][/ROW]
[ROW][C]R Server[/C][C]'Herman Ole Andreas Wold' @ wold.wessa.net[/C][/ROW]
[/TABLE]
Source: https://freestatistics.org/blog/index.php?pk=261367&T=0

Globally Unique Identifier (entire table): ba.freestatistics.org/blog/index.php?pk=261367&T=0

As an alternative you can also use a QR Code:  

The GUIDs for individual cells are displayed in the table below:

Summary of computational transaction
Raw Inputview raw input (R code)
Raw Outputview raw output of R engine
Computing time1 seconds
R Server'Herman Ole Andreas Wold' @ wold.wessa.net


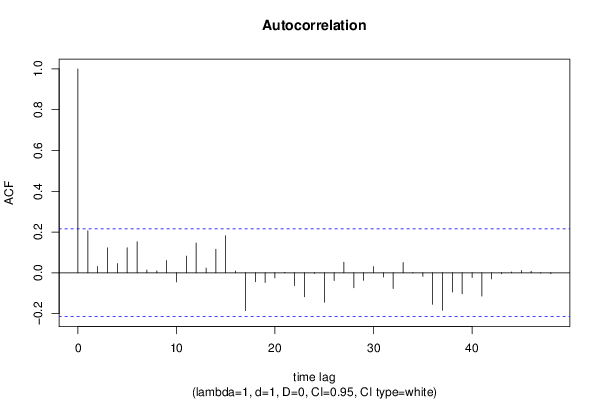
Autocorrelation Function
Time lag kACF(k)T-STATP-value
10.2061151.87780.031961
20.0306740.27950.390295
30.1221751.11310.134446
40.0456540.41590.339267
50.1232131.12250.132438
60.1526031.39030.08408
70.0135820.12370.45091
80.0094260.08590.465886
90.0606190.55230.291124
10-0.044587-0.40620.342819
110.0817340.74460.229298
120.1458671.32890.09376
130.0230190.20970.417203
140.1159641.05650.146906
150.1820561.65860.050485
160.0086750.0790.468599
17-0.185724-1.6920.047196
18-0.043611-0.39730.346078
19-0.047256-0.43050.333965
20-0.025004-0.22780.410181
210.0021460.01950.492225
22-0.062787-0.5720.284427
23-0.117205-1.06780.144356
24-0.003229-0.02940.488301
25-0.144486-1.31630.095843
26-0.037482-0.34150.366804
270.0517680.47160.319213
28-0.073421-0.66890.25271
29-0.037271-0.33960.367524
300.0301650.27480.392071
31-0.020563-0.18730.425926
32-0.077399-0.70510.241348
330.0506880.46180.322721
34-0.000916-0.00830.496681
35-0.017464-0.15910.436988
36-0.154224-1.4050.081869
37-0.183625-1.67290.049056
38-0.094526-0.86120.195813
39-0.102713-0.93580.176055
40-0.023225-0.21160.416471
41-0.114303-1.04140.150368
42-0.029874-0.27220.393084
43-0.004722-0.0430.482895
440.0035460.03230.487152
450.0113060.1030.459104
460.0077270.07040.472023
47-0.001545-0.01410.4944
48-0.004872-0.04440.482352

\begin{tabular}{lllllllll}
\hline
Autocorrelation Function \tabularnewline
Time lag k & ACF(k) & T-STAT & P-value \tabularnewline
1 & 0.206115 & 1.8778 & 0.031961 \tabularnewline
2 & 0.030674 & 0.2795 & 0.390295 \tabularnewline
3 & 0.122175 & 1.1131 & 0.134446 \tabularnewline
4 & 0.045654 & 0.4159 & 0.339267 \tabularnewline
5 & 0.123213 & 1.1225 & 0.132438 \tabularnewline
6 & 0.152603 & 1.3903 & 0.08408 \tabularnewline
7 & 0.013582 & 0.1237 & 0.45091 \tabularnewline
8 & 0.009426 & 0.0859 & 0.465886 \tabularnewline
9 & 0.060619 & 0.5523 & 0.291124 \tabularnewline
10 & -0.044587 & -0.4062 & 0.342819 \tabularnewline
11 & 0.081734 & 0.7446 & 0.229298 \tabularnewline
12 & 0.145867 & 1.3289 & 0.09376 \tabularnewline
13 & 0.023019 & 0.2097 & 0.417203 \tabularnewline
14 & 0.115964 & 1.0565 & 0.146906 \tabularnewline
15 & 0.182056 & 1.6586 & 0.050485 \tabularnewline
16 & 0.008675 & 0.079 & 0.468599 \tabularnewline
17 & -0.185724 & -1.692 & 0.047196 \tabularnewline
18 & -0.043611 & -0.3973 & 0.346078 \tabularnewline
19 & -0.047256 & -0.4305 & 0.333965 \tabularnewline
20 & -0.025004 & -0.2278 & 0.410181 \tabularnewline
21 & 0.002146 & 0.0195 & 0.492225 \tabularnewline
22 & -0.062787 & -0.572 & 0.284427 \tabularnewline
23 & -0.117205 & -1.0678 & 0.144356 \tabularnewline
24 & -0.003229 & -0.0294 & 0.488301 \tabularnewline
25 & -0.144486 & -1.3163 & 0.095843 \tabularnewline
26 & -0.037482 & -0.3415 & 0.366804 \tabularnewline
27 & 0.051768 & 0.4716 & 0.319213 \tabularnewline
28 & -0.073421 & -0.6689 & 0.25271 \tabularnewline
29 & -0.037271 & -0.3396 & 0.367524 \tabularnewline
30 & 0.030165 & 0.2748 & 0.392071 \tabularnewline
31 & -0.020563 & -0.1873 & 0.425926 \tabularnewline
32 & -0.077399 & -0.7051 & 0.241348 \tabularnewline
33 & 0.050688 & 0.4618 & 0.322721 \tabularnewline
34 & -0.000916 & -0.0083 & 0.496681 \tabularnewline
35 & -0.017464 & -0.1591 & 0.436988 \tabularnewline
36 & -0.154224 & -1.405 & 0.081869 \tabularnewline
37 & -0.183625 & -1.6729 & 0.049056 \tabularnewline
38 & -0.094526 & -0.8612 & 0.195813 \tabularnewline
39 & -0.102713 & -0.9358 & 0.176055 \tabularnewline
40 & -0.023225 & -0.2116 & 0.416471 \tabularnewline
41 & -0.114303 & -1.0414 & 0.150368 \tabularnewline
42 & -0.029874 & -0.2722 & 0.393084 \tabularnewline
43 & -0.004722 & -0.043 & 0.482895 \tabularnewline
44 & 0.003546 & 0.0323 & 0.487152 \tabularnewline
45 & 0.011306 & 0.103 & 0.459104 \tabularnewline
46 & 0.007727 & 0.0704 & 0.472023 \tabularnewline
47 & -0.001545 & -0.0141 & 0.4944 \tabularnewline
48 & -0.004872 & -0.0444 & 0.482352 \tabularnewline
\hline
\end{tabular}
%Source: https://freestatistics.org/blog/index.php?pk=261367&T=1

[TABLE]
[ROW][C]Autocorrelation Function[/C][/ROW]
[ROW][C]Time lag k[/C][C]ACF(k)[/C][C]T-STAT[/C][C]P-value[/C][/ROW]
[ROW][C]1[/C][C]0.206115[/C][C]1.8778[/C][C]0.031961[/C][/ROW]
[ROW][C]2[/C][C]0.030674[/C][C]0.2795[/C][C]0.390295[/C][/ROW]
[ROW][C]3[/C][C]0.122175[/C][C]1.1131[/C][C]0.134446[/C][/ROW]
[ROW][C]4[/C][C]0.045654[/C][C]0.4159[/C][C]0.339267[/C][/ROW]
[ROW][C]5[/C][C]0.123213[/C][C]1.1225[/C][C]0.132438[/C][/ROW]
[ROW][C]6[/C][C]0.152603[/C][C]1.3903[/C][C]0.08408[/C][/ROW]
[ROW][C]7[/C][C]0.013582[/C][C]0.1237[/C][C]0.45091[/C][/ROW]
[ROW][C]8[/C][C]0.009426[/C][C]0.0859[/C][C]0.465886[/C][/ROW]
[ROW][C]9[/C][C]0.060619[/C][C]0.5523[/C][C]0.291124[/C][/ROW]
[ROW][C]10[/C][C]-0.044587[/C][C]-0.4062[/C][C]0.342819[/C][/ROW]
[ROW][C]11[/C][C]0.081734[/C][C]0.7446[/C][C]0.229298[/C][/ROW]
[ROW][C]12[/C][C]0.145867[/C][C]1.3289[/C][C]0.09376[/C][/ROW]
[ROW][C]13[/C][C]0.023019[/C][C]0.2097[/C][C]0.417203[/C][/ROW]
[ROW][C]14[/C][C]0.115964[/C][C]1.0565[/C][C]0.146906[/C][/ROW]
[ROW][C]15[/C][C]0.182056[/C][C]1.6586[/C][C]0.050485[/C][/ROW]
[ROW][C]16[/C][C]0.008675[/C][C]0.079[/C][C]0.468599[/C][/ROW]
[ROW][C]17[/C][C]-0.185724[/C][C]-1.692[/C][C]0.047196[/C][/ROW]
[ROW][C]18[/C][C]-0.043611[/C][C]-0.3973[/C][C]0.346078[/C][/ROW]
[ROW][C]19[/C][C]-0.047256[/C][C]-0.4305[/C][C]0.333965[/C][/ROW]
[ROW][C]20[/C][C]-0.025004[/C][C]-0.2278[/C][C]0.410181[/C][/ROW]
[ROW][C]21[/C][C]0.002146[/C][C]0.0195[/C][C]0.492225[/C][/ROW]
[ROW][C]22[/C][C]-0.062787[/C][C]-0.572[/C][C]0.284427[/C][/ROW]
[ROW][C]23[/C][C]-0.117205[/C][C]-1.0678[/C][C]0.144356[/C][/ROW]
[ROW][C]24[/C][C]-0.003229[/C][C]-0.0294[/C][C]0.488301[/C][/ROW]
[ROW][C]25[/C][C]-0.144486[/C][C]-1.3163[/C][C]0.095843[/C][/ROW]
[ROW][C]26[/C][C]-0.037482[/C][C]-0.3415[/C][C]0.366804[/C][/ROW]
[ROW][C]27[/C][C]0.051768[/C][C]0.4716[/C][C]0.319213[/C][/ROW]
[ROW][C]28[/C][C]-0.073421[/C][C]-0.6689[/C][C]0.25271[/C][/ROW]
[ROW][C]29[/C][C]-0.037271[/C][C]-0.3396[/C][C]0.367524[/C][/ROW]
[ROW][C]30[/C][C]0.030165[/C][C]0.2748[/C][C]0.392071[/C][/ROW]
[ROW][C]31[/C][C]-0.020563[/C][C]-0.1873[/C][C]0.425926[/C][/ROW]
[ROW][C]32[/C][C]-0.077399[/C][C]-0.7051[/C][C]0.241348[/C][/ROW]
[ROW][C]33[/C][C]0.050688[/C][C]0.4618[/C][C]0.322721[/C][/ROW]
[ROW][C]34[/C][C]-0.000916[/C][C]-0.0083[/C][C]0.496681[/C][/ROW]
[ROW][C]35[/C][C]-0.017464[/C][C]-0.1591[/C][C]0.436988[/C][/ROW]
[ROW][C]36[/C][C]-0.154224[/C][C]-1.405[/C][C]0.081869[/C][/ROW]
[ROW][C]37[/C][C]-0.183625[/C][C]-1.6729[/C][C]0.049056[/C][/ROW]
[ROW][C]38[/C][C]-0.094526[/C][C]-0.8612[/C][C]0.195813[/C][/ROW]
[ROW][C]39[/C][C]-0.102713[/C][C]-0.9358[/C][C]0.176055[/C][/ROW]
[ROW][C]40[/C][C]-0.023225[/C][C]-0.2116[/C][C]0.416471[/C][/ROW]
[ROW][C]41[/C][C]-0.114303[/C][C]-1.0414[/C][C]0.150368[/C][/ROW]
[ROW][C]42[/C][C]-0.029874[/C][C]-0.2722[/C][C]0.393084[/C][/ROW]
[ROW][C]43[/C][C]-0.004722[/C][C]-0.043[/C][C]0.482895[/C][/ROW]
[ROW][C]44[/C][C]0.003546[/C][C]0.0323[/C][C]0.487152[/C][/ROW]
[ROW][C]45[/C][C]0.011306[/C][C]0.103[/C][C]0.459104[/C][/ROW]
[ROW][C]46[/C][C]0.007727[/C][C]0.0704[/C][C]0.472023[/C][/ROW]
[ROW][C]47[/C][C]-0.001545[/C][C]-0.0141[/C][C]0.4944[/C][/ROW]
[ROW][C]48[/C][C]-0.004872[/C][C]-0.0444[/C][C]0.482352[/C][/ROW]
[/TABLE]
Source: https://freestatistics.org/blog/index.php?pk=261367&T=1

Globally Unique Identifier (entire table): ba.freestatistics.org/blog/index.php?pk=261367&T=1

As an alternative you can also use a QR Code:  

The GUIDs for individual cells are displayed in the table below:

Autocorrelation Function
Time lag kACF(k)T-STATP-value
10.2061151.87780.031961
20.0306740.27950.390295
30.1221751.11310.134446
40.0456540.41590.339267
50.1232131.12250.132438
60.1526031.39030.08408
70.0135820.12370.45091
80.0094260.08590.465886
90.0606190.55230.291124
10-0.044587-0.40620.342819
110.0817340.74460.229298
120.1458671.32890.09376
130.0230190.20970.417203
140.1159641.05650.146906
150.1820561.65860.050485
160.0086750.0790.468599
17-0.185724-1.6920.047196
18-0.043611-0.39730.346078
19-0.047256-0.43050.333965
20-0.025004-0.22780.410181
210.0021460.01950.492225
22-0.062787-0.5720.284427
23-0.117205-1.06780.144356
24-0.003229-0.02940.488301
25-0.144486-1.31630.095843
26-0.037482-0.34150.366804
270.0517680.47160.319213
28-0.073421-0.66890.25271
29-0.037271-0.33960.367524
300.0301650.27480.392071
31-0.020563-0.18730.425926
32-0.077399-0.70510.241348
330.0506880.46180.322721
34-0.000916-0.00830.496681
35-0.017464-0.15910.436988
36-0.154224-1.4050.081869
37-0.183625-1.67290.049056
38-0.094526-0.86120.195813
39-0.102713-0.93580.176055
40-0.023225-0.21160.416471
41-0.114303-1.04140.150368
42-0.029874-0.27220.393084
43-0.004722-0.0430.482895
440.0035460.03230.487152
450.0113060.1030.459104
460.0077270.07040.472023
47-0.001545-0.01410.4944
48-0.004872-0.04440.482352


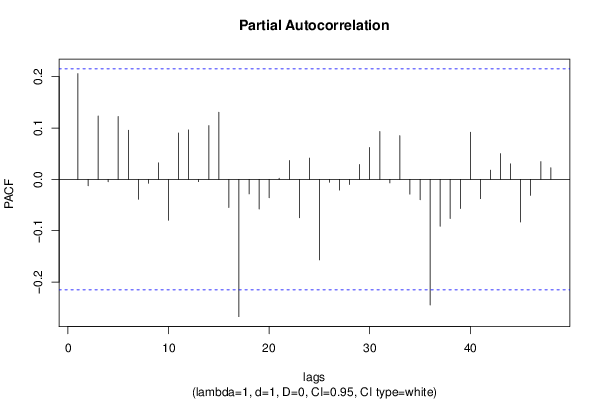
Partial Autocorrelation Function
Time lag kPACF(k)T-STATP-value
10.2061151.87780.031961
2-0.012333-0.11240.455405
30.1235851.12590.131724
4-0.004591-0.04180.48337
50.1224061.11520.133998
60.0957610.87240.192746
7-0.038864-0.35410.362094
8-0.007569-0.0690.472593
90.0322080.29340.384963
10-0.079815-0.72710.234591
110.0904060.82360.206252
120.0963820.87810.191216
13-0.004411-0.04020.484022
140.1047720.95450.171296
150.1309041.19260.118213
16-0.054745-0.49870.309638
17-0.267495-2.4370.008474
18-0.028259-0.25750.398732
19-0.057718-0.52580.300203
20-0.035809-0.32620.372533
210.0021850.01990.492083
220.0367160.33450.369423
23-0.074814-0.68160.248697
240.0414490.37760.353337
25-0.156889-1.42930.078332
26-0.005801-0.05290.478988
27-0.020928-0.19070.424626
28-0.009926-0.09040.464082
290.029070.26480.395896
300.0620380.56520.286735
310.0931810.84890.199183
32-0.006893-0.06280.47504
330.0851670.77590.220005
34-0.028818-0.26250.396775
35-0.039615-0.36090.359542
36-0.244934-2.23150.014173
37-0.091338-0.83210.203863
38-0.076114-0.69340.244987
39-0.056925-0.51860.302707
400.0919690.83790.202253
41-0.037579-0.34240.366472
420.0179470.16350.435258
430.0500990.45640.32464
440.030190.2750.391983
45-0.083072-0.75680.225649
46-0.031142-0.28370.388668
470.034550.31480.376864
480.0225340.20530.418922

\begin{tabular}{lllllllll}
\hline
Partial Autocorrelation Function \tabularnewline
Time lag k & PACF(k) & T-STAT & P-value \tabularnewline
1 & 0.206115 & 1.8778 & 0.031961 \tabularnewline
2 & -0.012333 & -0.1124 & 0.455405 \tabularnewline
3 & 0.123585 & 1.1259 & 0.131724 \tabularnewline
4 & -0.004591 & -0.0418 & 0.48337 \tabularnewline
5 & 0.122406 & 1.1152 & 0.133998 \tabularnewline
6 & 0.095761 & 0.8724 & 0.192746 \tabularnewline
7 & -0.038864 & -0.3541 & 0.362094 \tabularnewline
8 & -0.007569 & -0.069 & 0.472593 \tabularnewline
9 & 0.032208 & 0.2934 & 0.384963 \tabularnewline
10 & -0.079815 & -0.7271 & 0.234591 \tabularnewline
11 & 0.090406 & 0.8236 & 0.206252 \tabularnewline
12 & 0.096382 & 0.8781 & 0.191216 \tabularnewline
13 & -0.004411 & -0.0402 & 0.484022 \tabularnewline
14 & 0.104772 & 0.9545 & 0.171296 \tabularnewline
15 & 0.130904 & 1.1926 & 0.118213 \tabularnewline
16 & -0.054745 & -0.4987 & 0.309638 \tabularnewline
17 & -0.267495 & -2.437 & 0.008474 \tabularnewline
18 & -0.028259 & -0.2575 & 0.398732 \tabularnewline
19 & -0.057718 & -0.5258 & 0.300203 \tabularnewline
20 & -0.035809 & -0.3262 & 0.372533 \tabularnewline
21 & 0.002185 & 0.0199 & 0.492083 \tabularnewline
22 & 0.036716 & 0.3345 & 0.369423 \tabularnewline
23 & -0.074814 & -0.6816 & 0.248697 \tabularnewline
24 & 0.041449 & 0.3776 & 0.353337 \tabularnewline
25 & -0.156889 & -1.4293 & 0.078332 \tabularnewline
26 & -0.005801 & -0.0529 & 0.478988 \tabularnewline
27 & -0.020928 & -0.1907 & 0.424626 \tabularnewline
28 & -0.009926 & -0.0904 & 0.464082 \tabularnewline
29 & 0.02907 & 0.2648 & 0.395896 \tabularnewline
30 & 0.062038 & 0.5652 & 0.286735 \tabularnewline
31 & 0.093181 & 0.8489 & 0.199183 \tabularnewline
32 & -0.006893 & -0.0628 & 0.47504 \tabularnewline
33 & 0.085167 & 0.7759 & 0.220005 \tabularnewline
34 & -0.028818 & -0.2625 & 0.396775 \tabularnewline
35 & -0.039615 & -0.3609 & 0.359542 \tabularnewline
36 & -0.244934 & -2.2315 & 0.014173 \tabularnewline
37 & -0.091338 & -0.8321 & 0.203863 \tabularnewline
38 & -0.076114 & -0.6934 & 0.244987 \tabularnewline
39 & -0.056925 & -0.5186 & 0.302707 \tabularnewline
40 & 0.091969 & 0.8379 & 0.202253 \tabularnewline
41 & -0.037579 & -0.3424 & 0.366472 \tabularnewline
42 & 0.017947 & 0.1635 & 0.435258 \tabularnewline
43 & 0.050099 & 0.4564 & 0.32464 \tabularnewline
44 & 0.03019 & 0.275 & 0.391983 \tabularnewline
45 & -0.083072 & -0.7568 & 0.225649 \tabularnewline
46 & -0.031142 & -0.2837 & 0.388668 \tabularnewline
47 & 0.03455 & 0.3148 & 0.376864 \tabularnewline
48 & 0.022534 & 0.2053 & 0.418922 \tabularnewline
\hline
\end{tabular}
%Source: https://freestatistics.org/blog/index.php?pk=261367&T=2

[TABLE]
[ROW][C]Partial Autocorrelation Function[/C][/ROW]
[ROW][C]Time lag k[/C][C]PACF(k)[/C][C]T-STAT[/C][C]P-value[/C][/ROW]
[ROW][C]1[/C][C]0.206115[/C][C]1.8778[/C][C]0.031961[/C][/ROW]
[ROW][C]2[/C][C]-0.012333[/C][C]-0.1124[/C][C]0.455405[/C][/ROW]
[ROW][C]3[/C][C]0.123585[/C][C]1.1259[/C][C]0.131724[/C][/ROW]
[ROW][C]4[/C][C]-0.004591[/C][C]-0.0418[/C][C]0.48337[/C][/ROW]
[ROW][C]5[/C][C]0.122406[/C][C]1.1152[/C][C]0.133998[/C][/ROW]
[ROW][C]6[/C][C]0.095761[/C][C]0.8724[/C][C]0.192746[/C][/ROW]
[ROW][C]7[/C][C]-0.038864[/C][C]-0.3541[/C][C]0.362094[/C][/ROW]
[ROW][C]8[/C][C]-0.007569[/C][C]-0.069[/C][C]0.472593[/C][/ROW]
[ROW][C]9[/C][C]0.032208[/C][C]0.2934[/C][C]0.384963[/C][/ROW]
[ROW][C]10[/C][C]-0.079815[/C][C]-0.7271[/C][C]0.234591[/C][/ROW]
[ROW][C]11[/C][C]0.090406[/C][C]0.8236[/C][C]0.206252[/C][/ROW]
[ROW][C]12[/C][C]0.096382[/C][C]0.8781[/C][C]0.191216[/C][/ROW]
[ROW][C]13[/C][C]-0.004411[/C][C]-0.0402[/C][C]0.484022[/C][/ROW]
[ROW][C]14[/C][C]0.104772[/C][C]0.9545[/C][C]0.171296[/C][/ROW]
[ROW][C]15[/C][C]0.130904[/C][C]1.1926[/C][C]0.118213[/C][/ROW]
[ROW][C]16[/C][C]-0.054745[/C][C]-0.4987[/C][C]0.309638[/C][/ROW]
[ROW][C]17[/C][C]-0.267495[/C][C]-2.437[/C][C]0.008474[/C][/ROW]
[ROW][C]18[/C][C]-0.028259[/C][C]-0.2575[/C][C]0.398732[/C][/ROW]
[ROW][C]19[/C][C]-0.057718[/C][C]-0.5258[/C][C]0.300203[/C][/ROW]
[ROW][C]20[/C][C]-0.035809[/C][C]-0.3262[/C][C]0.372533[/C][/ROW]
[ROW][C]21[/C][C]0.002185[/C][C]0.0199[/C][C]0.492083[/C][/ROW]
[ROW][C]22[/C][C]0.036716[/C][C]0.3345[/C][C]0.369423[/C][/ROW]
[ROW][C]23[/C][C]-0.074814[/C][C]-0.6816[/C][C]0.248697[/C][/ROW]
[ROW][C]24[/C][C]0.041449[/C][C]0.3776[/C][C]0.353337[/C][/ROW]
[ROW][C]25[/C][C]-0.156889[/C][C]-1.4293[/C][C]0.078332[/C][/ROW]
[ROW][C]26[/C][C]-0.005801[/C][C]-0.0529[/C][C]0.478988[/C][/ROW]
[ROW][C]27[/C][C]-0.020928[/C][C]-0.1907[/C][C]0.424626[/C][/ROW]
[ROW][C]28[/C][C]-0.009926[/C][C]-0.0904[/C][C]0.464082[/C][/ROW]
[ROW][C]29[/C][C]0.02907[/C][C]0.2648[/C][C]0.395896[/C][/ROW]
[ROW][C]30[/C][C]0.062038[/C][C]0.5652[/C][C]0.286735[/C][/ROW]
[ROW][C]31[/C][C]0.093181[/C][C]0.8489[/C][C]0.199183[/C][/ROW]
[ROW][C]32[/C][C]-0.006893[/C][C]-0.0628[/C][C]0.47504[/C][/ROW]
[ROW][C]33[/C][C]0.085167[/C][C]0.7759[/C][C]0.220005[/C][/ROW]
[ROW][C]34[/C][C]-0.028818[/C][C]-0.2625[/C][C]0.396775[/C][/ROW]
[ROW][C]35[/C][C]-0.039615[/C][C]-0.3609[/C][C]0.359542[/C][/ROW]
[ROW][C]36[/C][C]-0.244934[/C][C]-2.2315[/C][C]0.014173[/C][/ROW]
[ROW][C]37[/C][C]-0.091338[/C][C]-0.8321[/C][C]0.203863[/C][/ROW]
[ROW][C]38[/C][C]-0.076114[/C][C]-0.6934[/C][C]0.244987[/C][/ROW]
[ROW][C]39[/C][C]-0.056925[/C][C]-0.5186[/C][C]0.302707[/C][/ROW]
[ROW][C]40[/C][C]0.091969[/C][C]0.8379[/C][C]0.202253[/C][/ROW]
[ROW][C]41[/C][C]-0.037579[/C][C]-0.3424[/C][C]0.366472[/C][/ROW]
[ROW][C]42[/C][C]0.017947[/C][C]0.1635[/C][C]0.435258[/C][/ROW]
[ROW][C]43[/C][C]0.050099[/C][C]0.4564[/C][C]0.32464[/C][/ROW]
[ROW][C]44[/C][C]0.03019[/C][C]0.275[/C][C]0.391983[/C][/ROW]
[ROW][C]45[/C][C]-0.083072[/C][C]-0.7568[/C][C]0.225649[/C][/ROW]
[ROW][C]46[/C][C]-0.031142[/C][C]-0.2837[/C][C]0.388668[/C][/ROW]
[ROW][C]47[/C][C]0.03455[/C][C]0.3148[/C][C]0.376864[/C][/ROW]
[ROW][C]48[/C][C]0.022534[/C][C]0.2053[/C][C]0.418922[/C][/ROW]
[/TABLE]
Source: https://freestatistics.org/blog/index.php?pk=261367&T=2

Globally Unique Identifier (entire table): ba.freestatistics.org/blog/index.php?pk=261367&T=2

As an alternative you can also use a QR Code:  

The GUIDs for individual cells are displayed in the table below:

Partial Autocorrelation Function
Time lag kPACF(k)T-STATP-value
10.2061151.87780.031961
2-0.012333-0.11240.455405
30.1235851.12590.131724
4-0.004591-0.04180.48337
50.1224061.11520.133998
60.0957610.87240.192746
7-0.038864-0.35410.362094
8-0.007569-0.0690.472593
90.0322080.29340.384963
10-0.079815-0.72710.234591
110.0904060.82360.206252
120.0963820.87810.191216
13-0.004411-0.04020.484022
140.1047720.95450.171296
150.1309041.19260.118213
16-0.054745-0.49870.309638
17-0.267495-2.4370.008474
18-0.028259-0.25750.398732
19-0.057718-0.52580.300203
20-0.035809-0.32620.372533
210.0021850.01990.492083
220.0367160.33450.369423
23-0.074814-0.68160.248697
240.0414490.37760.353337
25-0.156889-1.42930.078332
26-0.005801-0.05290.478988
27-0.020928-0.19070.424626
28-0.009926-0.09040.464082
290.029070.26480.395896
300.0620380.56520.286735
310.0931810.84890.199183
32-0.006893-0.06280.47504
330.0851670.77590.220005
34-0.028818-0.26250.396775
35-0.039615-0.36090.359542
36-0.244934-2.23150.014173
37-0.091338-0.83210.203863
38-0.076114-0.69340.244987
39-0.056925-0.51860.302707
400.0919690.83790.202253
41-0.037579-0.34240.366472
420.0179470.16350.435258
430.0500990.45640.32464
440.030190.2750.391983
45-0.083072-0.75680.225649
46-0.031142-0.28370.388668
470.034550.31480.376864
480.0225340.20530.418922


Parameters (Session):
par1 = 48 ; par2 = 1 ; par3 = 1 ; par4 = 0 ; par5 = 12 ; par6 = White Noise ; par7 = 0.95 ;
Parameters (R input):
par1 = 48 ; par2 = 1 ; par3 = 1 ; par4 = 0 ; par5 = 12 ; par6 = White Noise ; par7 = 0.95 ; par8 = ;
R code (references can be found in the software module):
if (par1 == 'Default') {
par1 = 10*log10(length(x))
} else {
par1 <- as.numeric(par1)
}
par2 <- as.numeric(par2)
par3 <- as.numeric(par3)
par4 <- as.numeric(par4)
par5 <- as.numeric(par5)
if (par6 == 'White Noise') par6 <- 'white' else par6 <- 'ma'
par7 <- as.numeric(par7)
if (par8 != '') par8 <- as.numeric(par8)
ox <- x
if (par8 == '') {
if (par2 == 0) {
x <- log(x)
} else {
x <- (x ^ par2 - 1) / par2
}
} else {
x <- log(x,base=par8)
}
if (par3 > 0) x <- diff(x,lag=1,difference=par3)
if (par4 > 0) x <- diff(x,lag=par5,difference=par4)
bitmap(file='picts.png')
op <- par(mfrow=c(2,1))
plot(ox,type='l',main='Original Time Series',xlab='time',ylab='value')
if (par8=='') {
mytitle <- paste('Working Time Series (lambda=',par2,', d=',par3,', D=',par4,')',sep='')
mysub <- paste('(lambda=',par2,', d=',par3,', D=',par4,', CI=', par7, ', CI type=',par6,')',sep='')
} else {
mytitle <- paste('Working Time Series (base=',par8,', d=',par3,', D=',par4,')',sep='')
mysub <- paste('(base=',par8,', d=',par3,', D=',par4,', CI=', par7, ', CI type=',par6,')',sep='')
}
plot(x,type='l', main=mytitle,xlab='time',ylab='value')
par(op)
dev.off()
bitmap(file='pic1.png')
racf <- acf(x, par1, main='Autocorrelation', xlab='time lag', ylab='ACF', ci.type=par6, ci=par7, sub=mysub)
dev.off()
bitmap(file='pic2.png')
rpacf <- pacf(x,par1,main='Partial Autocorrelation',xlab='lags',ylab='PACF',sub=mysub)
dev.off()
(myacf <- c(racf$acf))
(mypacf <- c(rpacf$acf))
lengthx <- length(x)
sqrtn <- sqrt(lengthx)
load(file='createtable')
a<-table.start()
a<-table.row.start(a)
a<-table.element(a,'Autocorrelation Function',4,TRUE)
a<-table.row.end(a)
a<-table.row.start(a)
a<-table.element(a,'Time lag k',header=TRUE)
a<-table.element(a,hyperlink('basics.htm','ACF(k)','click here for more information about the Autocorrelation Function'),header=TRUE)
a<-table.element(a,'T-STAT',header=TRUE)
a<-table.element(a,'P-value',header=TRUE)
a<-table.row.end(a)
for (i in 2:(par1+1)) {
a<-table.row.start(a)
a<-table.element(a,i-1,header=TRUE)
a<-table.element(a,round(myacf[i],6))
mytstat <- myacf[i]*sqrtn
a<-table.element(a,round(mytstat,4))
a<-table.element(a,round(1-pt(abs(mytstat),lengthx),6))
a<-table.row.end(a)
}
a<-table.end(a)
table.save(a,file='mytable.tab')
a<-table.start()
a<-table.row.start(a)
a<-table.element(a,'Partial Autocorrelation Function',4,TRUE)
a<-table.row.end(a)
a<-table.row.start(a)
a<-table.element(a,'Time lag k',header=TRUE)
a<-table.element(a,hyperlink('basics.htm','PACF(k)','click here for more information about the Partial Autocorrelation Function'),header=TRUE)
a<-table.element(a,'T-STAT',header=TRUE)
a<-table.element(a,'P-value',header=TRUE)
a<-table.row.end(a)
for (i in 1:par1) {
a<-table.row.start(a)
a<-table.element(a,i,header=TRUE)
a<-table.element(a,round(mypacf[i],6))
mytstat <- mypacf[i]*sqrtn
a<-table.element(a,round(mytstat,4))
a<-table.element(a,round(1-pt(abs(mytstat),lengthx),6))
a<-table.row.end(a)
}
a<-table.end(a)
table.save(a,file='mytable1.tab')