Free Statistics

of Irreproducible Research!

Author's title

Author*Unverified author*
R Software Modulerwasp_smp.wasp
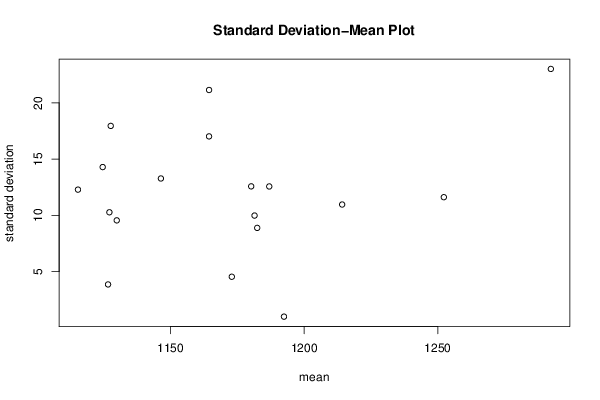
Title produced by softwareStandard Deviation-Mean Plot
Date of computationSat, 22 Nov 2014 16:54:16 +0000
Cite this page as followsStatistical Computations at FreeStatistics.org, Office for Research Development and Education, URL https://freestatistics.org/blog/index.php?v=date/2014/Nov/22/t1416675469fh03p4ej289n4ai.htm/, Retrieved Sun, 19 May 2024 20:47:01 +0000
Statistical Computations at FreeStatistics.org, Office for Research Development and Education, URL https://freestatistics.org/blog/index.php?pk=257896, Retrieved Sun, 19 May 2024 20:47:01 +0000
QR Codes:

Original text written by user:
IsPrivate?No (this computation is public)
User-defined keywords
Estimated Impact69
Family? (F = Feedback message, R = changed R code, M = changed R Module, P = changed Parameters, D = changed Data)
-       [Standard Deviation-Mean Plot] [] [2014-11-22 16:54:16] [ba3f7115fe3efa85f8b130de707d46eb] [Current]
Feedback Forum

Post a new message
Dataseries X:
1143
1162
1169
1184
1169
1189
1192
1198
1168
1179
1173
1172
1125
1127
1123
1132
1114
1127
1129
1139
1117
1131
1132
1140
1105
1126
1129
1139
1123
1101
1110
1128
1101
1134
1139
1137
1141
1165
1146
1134
1141
1159
1166
1192
1171
1179
1181
1195
1167
1176
1181
1197
1194
1173
1179
1184
1193
1193
1193
1191
1222
1198
1218
1219
1260
1235
1256
1258
1295
1294
1318
1262


Summary of computational transaction
Raw Inputview raw input (R code)
Raw Outputview raw output of R engine
Computing time2 seconds
R Server'Sir Maurice George Kendall' @ kendall.wessa.net

\begin{tabular}{lllllllll}
\hline
Summary of computational transaction \tabularnewline
Raw Input & view raw input (R code)  \tabularnewline
Raw Output & view raw output of R engine  \tabularnewline
Computing time & 2 seconds \tabularnewline
R Server & 'Sir Maurice George Kendall' @ kendall.wessa.net \tabularnewline
\hline
\end{tabular}
%Source: https://freestatistics.org/blog/index.php?pk=257896&T=0

[TABLE]
[ROW][C]Summary of computational transaction[/C][/ROW]
[ROW][C]Raw Input[/C][C]view raw input (R code) [/C][/ROW]
[ROW][C]Raw Output[/C][C]view raw output of R engine [/C][/ROW]
[ROW][C]Computing time[/C][C]2 seconds[/C][/ROW]
[ROW][C]R Server[/C][C]'Sir Maurice George Kendall' @ kendall.wessa.net[/C][/ROW]
[/TABLE]
Source: https://freestatistics.org/blog/index.php?pk=257896&T=0

Globally Unique Identifier (entire table): ba.freestatistics.org/blog/index.php?pk=257896&T=0

As an alternative you can also use a QR Code:  

The GUIDs for individual cells are displayed in the table below:

Summary of computational transaction
Raw Inputview raw input (R code)
Raw Outputview raw output of R engine
Computing time2 seconds
R Server'Sir Maurice George Kendall' @ kendall.wessa.net


Standard Deviation-Mean Plot
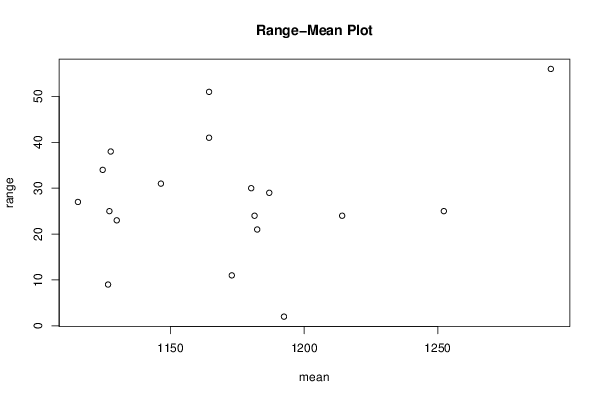
SectionMeanStandard DeviationRange
11164.517.01959654829341
2118712.569805089976529
311734.5460605656619511
41126.753.862210075418829
51127.2510.275375094532225
611309.5568474578876323
71124.7514.291605927956534
81115.512.288205727444527
91127.7517.951323071016238
101146.513.279056191361431
111164.521.14237451186651
121181.59.9833194212479624
131180.2512.579745625409130
141182.58.8881944173155921
151192.512
161214.2510.965856099730724
171252.2511.615363389350625
181292.2523.012677665437756

\begin{tabular}{lllllllll}
\hline
Standard Deviation-Mean Plot \tabularnewline
Section & Mean & Standard Deviation & Range \tabularnewline
1 & 1164.5 & 17.019596548293 & 41 \tabularnewline
2 & 1187 & 12.5698050899765 & 29 \tabularnewline
3 & 1173 & 4.54606056566195 & 11 \tabularnewline
4 & 1126.75 & 3.86221007541882 & 9 \tabularnewline
5 & 1127.25 & 10.2753750945322 & 25 \tabularnewline
6 & 1130 & 9.55684745788763 & 23 \tabularnewline
7 & 1124.75 & 14.2916059279565 & 34 \tabularnewline
8 & 1115.5 & 12.2882057274445 & 27 \tabularnewline
9 & 1127.75 & 17.9513230710162 & 38 \tabularnewline
10 & 1146.5 & 13.2790561913614 & 31 \tabularnewline
11 & 1164.5 & 21.142374511866 & 51 \tabularnewline
12 & 1181.5 & 9.98331942124796 & 24 \tabularnewline
13 & 1180.25 & 12.5797456254091 & 30 \tabularnewline
14 & 1182.5 & 8.88819441731559 & 21 \tabularnewline
15 & 1192.5 & 1 & 2 \tabularnewline
16 & 1214.25 & 10.9658560997307 & 24 \tabularnewline
17 & 1252.25 & 11.6153633893506 & 25 \tabularnewline
18 & 1292.25 & 23.0126776654377 & 56 \tabularnewline
\hline
\end{tabular}
%Source: https://freestatistics.org/blog/index.php?pk=257896&T=1

[TABLE]
[ROW][C]Standard Deviation-Mean Plot[/C][/ROW]
[ROW][C]Section[/C][C]Mean[/C][C]Standard Deviation[/C][C]Range[/C][/ROW]
[ROW][C]1[/C][C]1164.5[/C][C]17.019596548293[/C][C]41[/C][/ROW]
[ROW][C]2[/C][C]1187[/C][C]12.5698050899765[/C][C]29[/C][/ROW]
[ROW][C]3[/C][C]1173[/C][C]4.54606056566195[/C][C]11[/C][/ROW]
[ROW][C]4[/C][C]1126.75[/C][C]3.86221007541882[/C][C]9[/C][/ROW]
[ROW][C]5[/C][C]1127.25[/C][C]10.2753750945322[/C][C]25[/C][/ROW]
[ROW][C]6[/C][C]1130[/C][C]9.55684745788763[/C][C]23[/C][/ROW]
[ROW][C]7[/C][C]1124.75[/C][C]14.2916059279565[/C][C]34[/C][/ROW]
[ROW][C]8[/C][C]1115.5[/C][C]12.2882057274445[/C][C]27[/C][/ROW]
[ROW][C]9[/C][C]1127.75[/C][C]17.9513230710162[/C][C]38[/C][/ROW]
[ROW][C]10[/C][C]1146.5[/C][C]13.2790561913614[/C][C]31[/C][/ROW]
[ROW][C]11[/C][C]1164.5[/C][C]21.142374511866[/C][C]51[/C][/ROW]
[ROW][C]12[/C][C]1181.5[/C][C]9.98331942124796[/C][C]24[/C][/ROW]
[ROW][C]13[/C][C]1180.25[/C][C]12.5797456254091[/C][C]30[/C][/ROW]
[ROW][C]14[/C][C]1182.5[/C][C]8.88819441731559[/C][C]21[/C][/ROW]
[ROW][C]15[/C][C]1192.5[/C][C]1[/C][C]2[/C][/ROW]
[ROW][C]16[/C][C]1214.25[/C][C]10.9658560997307[/C][C]24[/C][/ROW]
[ROW][C]17[/C][C]1252.25[/C][C]11.6153633893506[/C][C]25[/C][/ROW]
[ROW][C]18[/C][C]1292.25[/C][C]23.0126776654377[/C][C]56[/C][/ROW]
[/TABLE]
Source: https://freestatistics.org/blog/index.php?pk=257896&T=1

Globally Unique Identifier (entire table): ba.freestatistics.org/blog/index.php?pk=257896&T=1

As an alternative you can also use a QR Code:  

The GUIDs for individual cells are displayed in the table below:

Standard Deviation-Mean Plot
SectionMeanStandard DeviationRange
11164.517.01959654829341
2118712.569805089976529
311734.5460605656619511
41126.753.862210075418829
51127.2510.275375094532225
611309.5568474578876323
71124.7514.291605927956534
81115.512.288205727444527
91127.7517.951323071016238
101146.513.279056191361431
111164.521.14237451186651
121181.59.9833194212479624
131180.2512.579745625409130
141182.58.8881944173155921
151192.512
161214.2510.965856099730724
171252.2511.615363389350625
181292.2523.012677665437756


Regression: S.E.(k) = alpha + beta * Mean(k)
alpha-19.2166829156442
beta0.0265962106607931
S.D.0.0292254939706268
T-STAT0.910034598132842
p-value0.376310124581781

\begin{tabular}{lllllllll}
\hline
Regression: S.E.(k) = alpha + beta * Mean(k) \tabularnewline
alpha & -19.2166829156442 \tabularnewline
beta & 0.0265962106607931 \tabularnewline
S.D. & 0.0292254939706268 \tabularnewline
T-STAT & 0.910034598132842 \tabularnewline
p-value & 0.376310124581781 \tabularnewline
\hline
\end{tabular}
%Source: https://freestatistics.org/blog/index.php?pk=257896&T=2

[TABLE]
[ROW][C]Regression: S.E.(k) = alpha + beta * Mean(k)[/C][/ROW]
[ROW][C]alpha[/C][C]-19.2166829156442[/C][/ROW]
[ROW][C]beta[/C][C]0.0265962106607931[/C][/ROW]
[ROW][C]S.D.[/C][C]0.0292254939706268[/C][/ROW]
[ROW][C]T-STAT[/C][C]0.910034598132842[/C][/ROW]
[ROW][C]p-value[/C][C]0.376310124581781[/C][/ROW]
[/TABLE]
Source: https://freestatistics.org/blog/index.php?pk=257896&T=2

Globally Unique Identifier (entire table): ba.freestatistics.org/blog/index.php?pk=257896&T=2

As an alternative you can also use a QR Code:  

The GUIDs for individual cells are displayed in the table below:

Regression: S.E.(k) = alpha + beta * Mean(k)
alpha-19.2166829156442
beta0.0265962106607931
S.D.0.0292254939706268
T-STAT0.910034598132842
p-value0.376310124581781


Regression: ln S.E.(k) = alpha + beta * ln Mean(k)
alpha-6.72732835467071
beta1.27861846845596
S.D.4.63477538960069
T-STAT0.275874958541652
p-value0.786175503262478
Lambda-0.278618468455958

\begin{tabular}{lllllllll}
\hline
Regression: ln S.E.(k) = alpha + beta * ln Mean(k) \tabularnewline
alpha & -6.72732835467071 \tabularnewline
beta & 1.27861846845596 \tabularnewline
S.D. & 4.63477538960069 \tabularnewline
T-STAT & 0.275874958541652 \tabularnewline
p-value & 0.786175503262478 \tabularnewline
Lambda & -0.278618468455958 \tabularnewline
\hline
\end{tabular}
%Source: https://freestatistics.org/blog/index.php?pk=257896&T=3

[TABLE]
[ROW][C]Regression: ln S.E.(k) = alpha + beta * ln Mean(k)[/C][/ROW]
[ROW][C]alpha[/C][C]-6.72732835467071[/C][/ROW]
[ROW][C]beta[/C][C]1.27861846845596[/C][/ROW]
[ROW][C]S.D.[/C][C]4.63477538960069[/C][/ROW]
[ROW][C]T-STAT[/C][C]0.275874958541652[/C][/ROW]
[ROW][C]p-value[/C][C]0.786175503262478[/C][/ROW]
[ROW][C]Lambda[/C][C]-0.278618468455958[/C][/ROW]
[/TABLE]
Source: https://freestatistics.org/blog/index.php?pk=257896&T=3

Globally Unique Identifier (entire table): ba.freestatistics.org/blog/index.php?pk=257896&T=3

As an alternative you can also use a QR Code:  

The GUIDs for individual cells are displayed in the table below:

Regression: ln S.E.(k) = alpha + beta * ln Mean(k)
alpha-6.72732835467071
beta1.27861846845596
S.D.4.63477538960069
T-STAT0.275874958541652
p-value0.786175503262478
Lambda-0.278618468455958


Parameters (Session):
par1 = 4 ;
Parameters (R input):
par1 = 4 ;
R code (references can be found in the software module):
par1 <- as.numeric(par1)
(n <- length(x))
(np <- floor(n / par1))
arr <- array(NA,dim=c(par1,np))
j <- 0
k <- 1
for (i in 1:(np*par1))
{
j = j + 1
arr[j,k] <- x[i]
if (j == par1) {
j = 0
k=k+1
}
}
arr
arr.mean <- array(NA,dim=np)
arr.sd <- array(NA,dim=np)
arr.range <- array(NA,dim=np)
for (j in 1:np)
{
arr.mean[j] <- mean(arr[,j],na.rm=TRUE)
arr.sd[j] <- sd(arr[,j],na.rm=TRUE)
arr.range[j] <- max(arr[,j],na.rm=TRUE) - min(arr[,j],na.rm=TRUE)
}
arr.mean
arr.sd
arr.range
(lm1 <- lm(arr.sd~arr.mean))
(lnlm1 <- lm(log(arr.sd)~log(arr.mean)))
(lm2 <- lm(arr.range~arr.mean))
bitmap(file='test1.png')
plot(arr.mean,arr.sd,main='Standard Deviation-Mean Plot',xlab='mean',ylab='standard deviation')
dev.off()
bitmap(file='test2.png')
plot(arr.mean,arr.range,main='Range-Mean Plot',xlab='mean',ylab='range')
dev.off()
load(file='createtable')
a<-table.start()
a<-table.row.start(a)
a<-table.element(a,'Standard Deviation-Mean Plot',4,TRUE)
a<-table.row.end(a)
a<-table.row.start(a)
a<-table.element(a,'Section',header=TRUE)
a<-table.element(a,'Mean',header=TRUE)
a<-table.element(a,'Standard Deviation',header=TRUE)
a<-table.element(a,'Range',header=TRUE)
a<-table.row.end(a)
for (j in 1:np) {
a<-table.row.start(a)
a<-table.element(a,j,header=TRUE)
a<-table.element(a,arr.mean[j])
a<-table.element(a,arr.sd[j] )
a<-table.element(a,arr.range[j] )
a<-table.row.end(a)
}
a<-table.end(a)
table.save(a,file='mytable.tab')
a<-table.start()
a<-table.row.start(a)
a<-table.element(a,'Regression: S.E.(k) = alpha + beta * Mean(k)',2,TRUE)
a<-table.row.end(a)
a<-table.row.start(a)
a<-table.element(a,'alpha',header=TRUE)
a<-table.element(a,lm1$coefficients[[1]])
a<-table.row.end(a)
a<-table.row.start(a)
a<-table.element(a,'beta',header=TRUE)
a<-table.element(a,lm1$coefficients[[2]])
a<-table.row.end(a)
a<-table.row.start(a)
a<-table.element(a,'S.D.',header=TRUE)
a<-table.element(a,summary(lm1)$coefficients[2,2])
a<-table.row.end(a)
a<-table.row.start(a)
a<-table.element(a,'T-STAT',header=TRUE)
a<-table.element(a,summary(lm1)$coefficients[2,3])
a<-table.row.end(a)
a<-table.row.start(a)
a<-table.element(a,'p-value',header=TRUE)
a<-table.element(a,summary(lm1)$coefficients[2,4])
a<-table.row.end(a)
a<-table.end(a)
table.save(a,file='mytable1.tab')
a<-table.start()
a<-table.row.start(a)
a<-table.element(a,'Regression: ln S.E.(k) = alpha + beta * ln Mean(k)',2,TRUE)
a<-table.row.end(a)
a<-table.row.start(a)
a<-table.element(a,'alpha',header=TRUE)
a<-table.element(a,lnlm1$coefficients[[1]])
a<-table.row.end(a)
a<-table.row.start(a)
a<-table.element(a,'beta',header=TRUE)
a<-table.element(a,lnlm1$coefficients[[2]])
a<-table.row.end(a)
a<-table.row.start(a)
a<-table.element(a,'S.D.',header=TRUE)
a<-table.element(a,summary(lnlm1)$coefficients[2,2])
a<-table.row.end(a)
a<-table.row.start(a)
a<-table.element(a,'T-STAT',header=TRUE)
a<-table.element(a,summary(lnlm1)$coefficients[2,3])
a<-table.row.end(a)
a<-table.row.start(a)
a<-table.element(a,'p-value',header=TRUE)
a<-table.element(a,summary(lnlm1)$coefficients[2,4])
a<-table.row.end(a)
a<-table.row.start(a)
a<-table.element(a,'Lambda',header=TRUE)
a<-table.element(a,1-lnlm1$coefficients[[2]])
a<-table.row.end(a)
a<-table.end(a)
table.save(a,file='mytable2.tab')