Free Statistics

of Irreproducible Research!

Author's title

Author*Unverified author*
R Software Modulerwasp_autocorrelation.wasp
Title produced by software(Partial) Autocorrelation Function
Date of computationMon, 17 Mar 2014 18:43:56 -0400
Cite this page as followsStatistical Computations at FreeStatistics.org, Office for Research Development and Education, URL https://freestatistics.org/blog/index.php?v=date/2014/Mar/17/t1395096321wmlkjsjypof3fx8.htm/, Retrieved Tue, 14 May 2024 20:01:13 +0000
Statistical Computations at FreeStatistics.org, Office for Research Development and Education, URL https://freestatistics.org/blog/index.php?pk=234348, Retrieved Tue, 14 May 2024 20:01:13 +0000
QR Codes:

Original text written by user:
IsPrivate?No (this computation is public)
User-defined keywords
Estimated Impact54
Family? (F = Feedback message, R = changed R code, M = changed R Module, P = changed Parameters, D = changed Data)
-       [(Partial) Autocorrelation Function] [] [2014-03-17 22:43:56] [0b4002381e6bc6fac3755b1107da82aa] [Current]
Feedback Forum

Post a new message
Dataseries X:
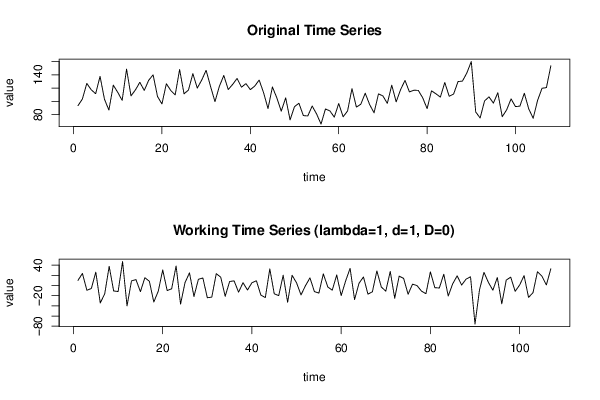
93.6
103.5
127
117.5
111.5
137.6
103.2
86.9
124.4
113.6
101.6
148.5
108.3
117.2
128.7
116.5
131.7
139.9
107.4
96.1
126.5
116.4
109.8
148
111.4
117
141.7
120
132.1
146.7
122.5
99.6
122.7
139
117.8
125.5
134.5
121.3
126.7
117.7
123
132.1
113.1
89.2
121.7
105.3
85.3
105.3
72.2
92.1
97.2
78.6
78.1
93
81
65.9
88.6
85.7
76.3
96.8
76.8
85.6
119.2
91.4
95.7
112.3
95.2
82.8
111.3
108.2
97
124.4
99.3
117.6
131.5
114.2
116.8
116.5
105.4
89.2
115.8
111.4
106.4
128.4
107.7
111
129.8
130.5
142.9
159.9
84.1
75
100.7
106.8
97.4
113
76.9
87.3
103.7
92.1
92.9
112.2
88.7
74.6
101.5
119.7
120.7
153.5


Summary of computational transaction
Raw Inputview raw input (R code)
Raw Outputview raw output of R engine
Computing time4 seconds
R Server'Gwilym Jenkins' @ jenkins.wessa.net

\begin{tabular}{lllllllll}
\hline
Summary of computational transaction \tabularnewline
Raw Input & view raw input (R code)  \tabularnewline
Raw Output & view raw output of R engine  \tabularnewline
Computing time & 4 seconds \tabularnewline
R Server & 'Gwilym Jenkins' @ jenkins.wessa.net \tabularnewline
\hline
\end{tabular}
%Source: https://freestatistics.org/blog/index.php?pk=234348&T=0

[TABLE]
[ROW][C]Summary of computational transaction[/C][/ROW]
[ROW][C]Raw Input[/C][C]view raw input (R code) [/C][/ROW]
[ROW][C]Raw Output[/C][C]view raw output of R engine [/C][/ROW]
[ROW][C]Computing time[/C][C]4 seconds[/C][/ROW]
[ROW][C]R Server[/C][C]'Gwilym Jenkins' @ jenkins.wessa.net[/C][/ROW]
[/TABLE]
Source: https://freestatistics.org/blog/index.php?pk=234348&T=0

Globally Unique Identifier (entire table): ba.freestatistics.org/blog/index.php?pk=234348&T=0

As an alternative you can also use a QR Code:  

The GUIDs for individual cells are displayed in the table below:

Summary of computational transaction
Raw Inputview raw input (R code)
Raw Outputview raw output of R engine
Computing time4 seconds
R Server'Gwilym Jenkins' @ jenkins.wessa.net


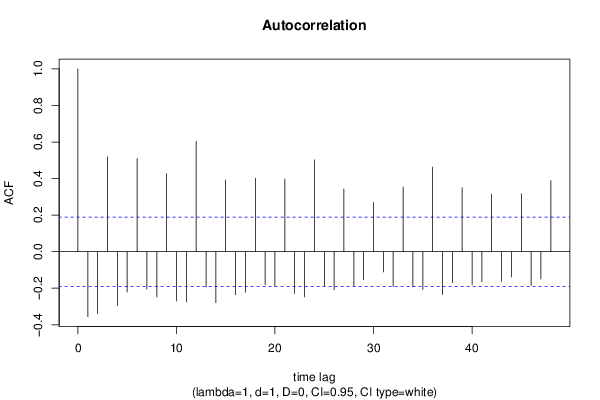
Autocorrelation Function
Time lag kACF(k)T-STATP-value
1-0.355627-3.67860.000184
2-0.33895-3.50610.000333
30.5181125.35940
4-0.294993-3.05140.001436
5-0.22122-2.28830.012042
60.5092865.26810
7-0.204834-2.11880.01821
8-0.247414-2.55930.005943
90.4272814.41981.2e-05
10-0.270279-2.79580.003069
11-0.274877-2.84330.002674
120.6033686.24130
13-0.193686-2.00350.023825
14-0.279005-2.88610.00236
150.391774.05254.8e-05
16-0.235484-2.43590.008254
17-0.222644-2.3030.011605
180.4017674.15593.3e-05
19-0.180385-1.86590.032396
20-0.18933-1.95840.026391
210.3972814.10953.9e-05
22-0.228142-2.35990.010046
23-0.248356-2.5690.005788
240.502235.19510
25-0.188465-1.94950.026927
26-0.208494-2.15670.016635
270.3428613.54660.00029
28-0.189363-1.95880.02637
29-0.152761-1.58020.058509
300.2692642.78530.003163
31-0.110603-1.14410.127571
32-0.190085-1.96630.02593
330.3531733.65320.000201
34-0.192692-1.99320.024391
35-0.207599-2.14740.017009
360.4632224.79163e-06
37-0.234536-2.42610.008468
38-0.169527-1.75360.041181
390.3497013.61730.000228
40-0.17963-1.85810.032951
41-0.163836-1.69470.046518
420.3156673.26530.000735
43-0.162623-1.68220.047725
44-0.138223-1.42980.077846
450.3163773.27260.000718
46-0.184944-1.91310.029206
47-0.149866-1.55020.062019
480.3887954.02175.4e-05

\begin{tabular}{lllllllll}
\hline
Autocorrelation Function \tabularnewline
Time lag k & ACF(k) & T-STAT & P-value \tabularnewline
1 & -0.355627 & -3.6786 & 0.000184 \tabularnewline
2 & -0.33895 & -3.5061 & 0.000333 \tabularnewline
3 & 0.518112 & 5.3594 & 0 \tabularnewline
4 & -0.294993 & -3.0514 & 0.001436 \tabularnewline
5 & -0.22122 & -2.2883 & 0.012042 \tabularnewline
6 & 0.509286 & 5.2681 & 0 \tabularnewline
7 & -0.204834 & -2.1188 & 0.01821 \tabularnewline
8 & -0.247414 & -2.5593 & 0.005943 \tabularnewline
9 & 0.427281 & 4.4198 & 1.2e-05 \tabularnewline
10 & -0.270279 & -2.7958 & 0.003069 \tabularnewline
11 & -0.274877 & -2.8433 & 0.002674 \tabularnewline
12 & 0.603368 & 6.2413 & 0 \tabularnewline
13 & -0.193686 & -2.0035 & 0.023825 \tabularnewline
14 & -0.279005 & -2.8861 & 0.00236 \tabularnewline
15 & 0.39177 & 4.0525 & 4.8e-05 \tabularnewline
16 & -0.235484 & -2.4359 & 0.008254 \tabularnewline
17 & -0.222644 & -2.303 & 0.011605 \tabularnewline
18 & 0.401767 & 4.1559 & 3.3e-05 \tabularnewline
19 & -0.180385 & -1.8659 & 0.032396 \tabularnewline
20 & -0.18933 & -1.9584 & 0.026391 \tabularnewline
21 & 0.397281 & 4.1095 & 3.9e-05 \tabularnewline
22 & -0.228142 & -2.3599 & 0.010046 \tabularnewline
23 & -0.248356 & -2.569 & 0.005788 \tabularnewline
24 & 0.50223 & 5.1951 & 0 \tabularnewline
25 & -0.188465 & -1.9495 & 0.026927 \tabularnewline
26 & -0.208494 & -2.1567 & 0.016635 \tabularnewline
27 & 0.342861 & 3.5466 & 0.00029 \tabularnewline
28 & -0.189363 & -1.9588 & 0.02637 \tabularnewline
29 & -0.152761 & -1.5802 & 0.058509 \tabularnewline
30 & 0.269264 & 2.7853 & 0.003163 \tabularnewline
31 & -0.110603 & -1.1441 & 0.127571 \tabularnewline
32 & -0.190085 & -1.9663 & 0.02593 \tabularnewline
33 & 0.353173 & 3.6532 & 0.000201 \tabularnewline
34 & -0.192692 & -1.9932 & 0.024391 \tabularnewline
35 & -0.207599 & -2.1474 & 0.017009 \tabularnewline
36 & 0.463222 & 4.7916 & 3e-06 \tabularnewline
37 & -0.234536 & -2.4261 & 0.008468 \tabularnewline
38 & -0.169527 & -1.7536 & 0.041181 \tabularnewline
39 & 0.349701 & 3.6173 & 0.000228 \tabularnewline
40 & -0.17963 & -1.8581 & 0.032951 \tabularnewline
41 & -0.163836 & -1.6947 & 0.046518 \tabularnewline
42 & 0.315667 & 3.2653 & 0.000735 \tabularnewline
43 & -0.162623 & -1.6822 & 0.047725 \tabularnewline
44 & -0.138223 & -1.4298 & 0.077846 \tabularnewline
45 & 0.316377 & 3.2726 & 0.000718 \tabularnewline
46 & -0.184944 & -1.9131 & 0.029206 \tabularnewline
47 & -0.149866 & -1.5502 & 0.062019 \tabularnewline
48 & 0.388795 & 4.0217 & 5.4e-05 \tabularnewline
\hline
\end{tabular}
%Source: https://freestatistics.org/blog/index.php?pk=234348&T=1

[TABLE]
[ROW][C]Autocorrelation Function[/C][/ROW]
[ROW][C]Time lag k[/C][C]ACF(k)[/C][C]T-STAT[/C][C]P-value[/C][/ROW]
[ROW][C]1[/C][C]-0.355627[/C][C]-3.6786[/C][C]0.000184[/C][/ROW]
[ROW][C]2[/C][C]-0.33895[/C][C]-3.5061[/C][C]0.000333[/C][/ROW]
[ROW][C]3[/C][C]0.518112[/C][C]5.3594[/C][C]0[/C][/ROW]
[ROW][C]4[/C][C]-0.294993[/C][C]-3.0514[/C][C]0.001436[/C][/ROW]
[ROW][C]5[/C][C]-0.22122[/C][C]-2.2883[/C][C]0.012042[/C][/ROW]
[ROW][C]6[/C][C]0.509286[/C][C]5.2681[/C][C]0[/C][/ROW]
[ROW][C]7[/C][C]-0.204834[/C][C]-2.1188[/C][C]0.01821[/C][/ROW]
[ROW][C]8[/C][C]-0.247414[/C][C]-2.5593[/C][C]0.005943[/C][/ROW]
[ROW][C]9[/C][C]0.427281[/C][C]4.4198[/C][C]1.2e-05[/C][/ROW]
[ROW][C]10[/C][C]-0.270279[/C][C]-2.7958[/C][C]0.003069[/C][/ROW]
[ROW][C]11[/C][C]-0.274877[/C][C]-2.8433[/C][C]0.002674[/C][/ROW]
[ROW][C]12[/C][C]0.603368[/C][C]6.2413[/C][C]0[/C][/ROW]
[ROW][C]13[/C][C]-0.193686[/C][C]-2.0035[/C][C]0.023825[/C][/ROW]
[ROW][C]14[/C][C]-0.279005[/C][C]-2.8861[/C][C]0.00236[/C][/ROW]
[ROW][C]15[/C][C]0.39177[/C][C]4.0525[/C][C]4.8e-05[/C][/ROW]
[ROW][C]16[/C][C]-0.235484[/C][C]-2.4359[/C][C]0.008254[/C][/ROW]
[ROW][C]17[/C][C]-0.222644[/C][C]-2.303[/C][C]0.011605[/C][/ROW]
[ROW][C]18[/C][C]0.401767[/C][C]4.1559[/C][C]3.3e-05[/C][/ROW]
[ROW][C]19[/C][C]-0.180385[/C][C]-1.8659[/C][C]0.032396[/C][/ROW]
[ROW][C]20[/C][C]-0.18933[/C][C]-1.9584[/C][C]0.026391[/C][/ROW]
[ROW][C]21[/C][C]0.397281[/C][C]4.1095[/C][C]3.9e-05[/C][/ROW]
[ROW][C]22[/C][C]-0.228142[/C][C]-2.3599[/C][C]0.010046[/C][/ROW]
[ROW][C]23[/C][C]-0.248356[/C][C]-2.569[/C][C]0.005788[/C][/ROW]
[ROW][C]24[/C][C]0.50223[/C][C]5.1951[/C][C]0[/C][/ROW]
[ROW][C]25[/C][C]-0.188465[/C][C]-1.9495[/C][C]0.026927[/C][/ROW]
[ROW][C]26[/C][C]-0.208494[/C][C]-2.1567[/C][C]0.016635[/C][/ROW]
[ROW][C]27[/C][C]0.342861[/C][C]3.5466[/C][C]0.00029[/C][/ROW]
[ROW][C]28[/C][C]-0.189363[/C][C]-1.9588[/C][C]0.02637[/C][/ROW]
[ROW][C]29[/C][C]-0.152761[/C][C]-1.5802[/C][C]0.058509[/C][/ROW]
[ROW][C]30[/C][C]0.269264[/C][C]2.7853[/C][C]0.003163[/C][/ROW]
[ROW][C]31[/C][C]-0.110603[/C][C]-1.1441[/C][C]0.127571[/C][/ROW]
[ROW][C]32[/C][C]-0.190085[/C][C]-1.9663[/C][C]0.02593[/C][/ROW]
[ROW][C]33[/C][C]0.353173[/C][C]3.6532[/C][C]0.000201[/C][/ROW]
[ROW][C]34[/C][C]-0.192692[/C][C]-1.9932[/C][C]0.024391[/C][/ROW]
[ROW][C]35[/C][C]-0.207599[/C][C]-2.1474[/C][C]0.017009[/C][/ROW]
[ROW][C]36[/C][C]0.463222[/C][C]4.7916[/C][C]3e-06[/C][/ROW]
[ROW][C]37[/C][C]-0.234536[/C][C]-2.4261[/C][C]0.008468[/C][/ROW]
[ROW][C]38[/C][C]-0.169527[/C][C]-1.7536[/C][C]0.041181[/C][/ROW]
[ROW][C]39[/C][C]0.349701[/C][C]3.6173[/C][C]0.000228[/C][/ROW]
[ROW][C]40[/C][C]-0.17963[/C][C]-1.8581[/C][C]0.032951[/C][/ROW]
[ROW][C]41[/C][C]-0.163836[/C][C]-1.6947[/C][C]0.046518[/C][/ROW]
[ROW][C]42[/C][C]0.315667[/C][C]3.2653[/C][C]0.000735[/C][/ROW]
[ROW][C]43[/C][C]-0.162623[/C][C]-1.6822[/C][C]0.047725[/C][/ROW]
[ROW][C]44[/C][C]-0.138223[/C][C]-1.4298[/C][C]0.077846[/C][/ROW]
[ROW][C]45[/C][C]0.316377[/C][C]3.2726[/C][C]0.000718[/C][/ROW]
[ROW][C]46[/C][C]-0.184944[/C][C]-1.9131[/C][C]0.029206[/C][/ROW]
[ROW][C]47[/C][C]-0.149866[/C][C]-1.5502[/C][C]0.062019[/C][/ROW]
[ROW][C]48[/C][C]0.388795[/C][C]4.0217[/C][C]5.4e-05[/C][/ROW]
[/TABLE]
Source: https://freestatistics.org/blog/index.php?pk=234348&T=1

Globally Unique Identifier (entire table): ba.freestatistics.org/blog/index.php?pk=234348&T=1

As an alternative you can also use a QR Code:  

The GUIDs for individual cells are displayed in the table below:

Autocorrelation Function
Time lag kACF(k)T-STATP-value
1-0.355627-3.67860.000184
2-0.33895-3.50610.000333
30.5181125.35940
4-0.294993-3.05140.001436
5-0.22122-2.28830.012042
60.5092865.26810
7-0.204834-2.11880.01821
8-0.247414-2.55930.005943
90.4272814.41981.2e-05
10-0.270279-2.79580.003069
11-0.274877-2.84330.002674
120.6033686.24130
13-0.193686-2.00350.023825
14-0.279005-2.88610.00236
150.391774.05254.8e-05
16-0.235484-2.43590.008254
17-0.222644-2.3030.011605
180.4017674.15593.3e-05
19-0.180385-1.86590.032396
20-0.18933-1.95840.026391
210.3972814.10953.9e-05
22-0.228142-2.35990.010046
23-0.248356-2.5690.005788
240.502235.19510
25-0.188465-1.94950.026927
26-0.208494-2.15670.016635
270.3428613.54660.00029
28-0.189363-1.95880.02637
29-0.152761-1.58020.058509
300.2692642.78530.003163
31-0.110603-1.14410.127571
32-0.190085-1.96630.02593
330.3531733.65320.000201
34-0.192692-1.99320.024391
35-0.207599-2.14740.017009
360.4632224.79163e-06
37-0.234536-2.42610.008468
38-0.169527-1.75360.041181
390.3497013.61730.000228
40-0.17963-1.85810.032951
41-0.163836-1.69470.046518
420.3156673.26530.000735
43-0.162623-1.68220.047725
44-0.138223-1.42980.077846
450.3163773.27260.000718
46-0.184944-1.91310.029206
47-0.149866-1.55020.062019
480.3887954.02175.4e-05


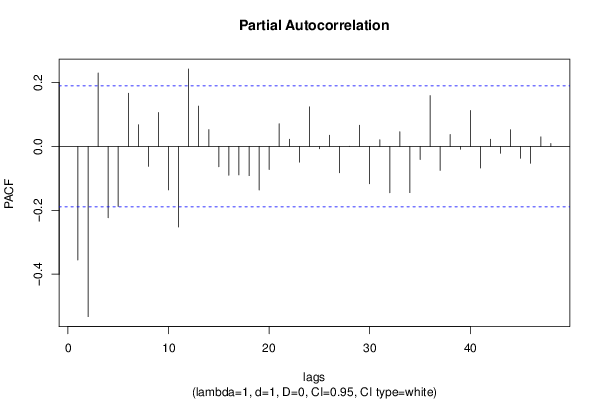
Partial Autocorrelation Function
Time lag kPACF(k)T-STATP-value
1-0.355627-3.67860.000184
2-0.532805-5.51140
30.2299852.3790.009566
4-0.223418-2.31110.011373
5-0.188235-1.94710.027071
60.1664471.72170.044003
70.0681590.7050.241158
8-0.062384-0.64530.260056
90.1060941.09740.137454
10-0.136055-1.40740.081109
11-0.252157-2.60830.005199
120.2426472.510.006786
130.1263271.30670.097052
140.0526830.5450.29346
15-0.063377-0.65560.256751
16-0.089945-0.93040.177131
17-0.089066-0.92130.179482
18-0.091433-0.94580.173193
19-0.136251-1.40940.08081
20-0.072369-0.74860.227874
210.0711490.7360.23168
220.0227980.23580.407011
23-0.049073-0.50760.306386
240.1238861.28150.101397
25-0.007387-0.07640.469616
260.0348690.36070.35952
27-0.082409-0.85240.197934
28-8.8e-05-9e-040.499637
290.0663820.68670.24689
30-0.116795-1.20810.114829
310.0207680.21480.415157
32-0.145073-1.50060.068196
330.0462010.47790.316844
34-0.144621-1.4960.068803
35-0.040817-0.42220.336857
360.1591281.6460.051346
37-0.074973-0.77550.219871
380.0377160.39010.348606
39-0.008571-0.08870.464761
400.1125111.16380.123543
41-0.067495-0.69820.243291
420.0226690.23450.407527
43-0.021098-0.21820.41383
440.0524420.54250.294313
45-0.036978-0.38250.351424
46-0.052444-0.54250.294307
470.0301340.31170.377936
480.009550.09880.460746

\begin{tabular}{lllllllll}
\hline
Partial Autocorrelation Function \tabularnewline
Time lag k & PACF(k) & T-STAT & P-value \tabularnewline
1 & -0.355627 & -3.6786 & 0.000184 \tabularnewline
2 & -0.532805 & -5.5114 & 0 \tabularnewline
3 & 0.229985 & 2.379 & 0.009566 \tabularnewline
4 & -0.223418 & -2.3111 & 0.011373 \tabularnewline
5 & -0.188235 & -1.9471 & 0.027071 \tabularnewline
6 & 0.166447 & 1.7217 & 0.044003 \tabularnewline
7 & 0.068159 & 0.705 & 0.241158 \tabularnewline
8 & -0.062384 & -0.6453 & 0.260056 \tabularnewline
9 & 0.106094 & 1.0974 & 0.137454 \tabularnewline
10 & -0.136055 & -1.4074 & 0.081109 \tabularnewline
11 & -0.252157 & -2.6083 & 0.005199 \tabularnewline
12 & 0.242647 & 2.51 & 0.006786 \tabularnewline
13 & 0.126327 & 1.3067 & 0.097052 \tabularnewline
14 & 0.052683 & 0.545 & 0.29346 \tabularnewline
15 & -0.063377 & -0.6556 & 0.256751 \tabularnewline
16 & -0.089945 & -0.9304 & 0.177131 \tabularnewline
17 & -0.089066 & -0.9213 & 0.179482 \tabularnewline
18 & -0.091433 & -0.9458 & 0.173193 \tabularnewline
19 & -0.136251 & -1.4094 & 0.08081 \tabularnewline
20 & -0.072369 & -0.7486 & 0.227874 \tabularnewline
21 & 0.071149 & 0.736 & 0.23168 \tabularnewline
22 & 0.022798 & 0.2358 & 0.407011 \tabularnewline
23 & -0.049073 & -0.5076 & 0.306386 \tabularnewline
24 & 0.123886 & 1.2815 & 0.101397 \tabularnewline
25 & -0.007387 & -0.0764 & 0.469616 \tabularnewline
26 & 0.034869 & 0.3607 & 0.35952 \tabularnewline
27 & -0.082409 & -0.8524 & 0.197934 \tabularnewline
28 & -8.8e-05 & -9e-04 & 0.499637 \tabularnewline
29 & 0.066382 & 0.6867 & 0.24689 \tabularnewline
30 & -0.116795 & -1.2081 & 0.114829 \tabularnewline
31 & 0.020768 & 0.2148 & 0.415157 \tabularnewline
32 & -0.145073 & -1.5006 & 0.068196 \tabularnewline
33 & 0.046201 & 0.4779 & 0.316844 \tabularnewline
34 & -0.144621 & -1.496 & 0.068803 \tabularnewline
35 & -0.040817 & -0.4222 & 0.336857 \tabularnewline
36 & 0.159128 & 1.646 & 0.051346 \tabularnewline
37 & -0.074973 & -0.7755 & 0.219871 \tabularnewline
38 & 0.037716 & 0.3901 & 0.348606 \tabularnewline
39 & -0.008571 & -0.0887 & 0.464761 \tabularnewline
40 & 0.112511 & 1.1638 & 0.123543 \tabularnewline
41 & -0.067495 & -0.6982 & 0.243291 \tabularnewline
42 & 0.022669 & 0.2345 & 0.407527 \tabularnewline
43 & -0.021098 & -0.2182 & 0.41383 \tabularnewline
44 & 0.052442 & 0.5425 & 0.294313 \tabularnewline
45 & -0.036978 & -0.3825 & 0.351424 \tabularnewline
46 & -0.052444 & -0.5425 & 0.294307 \tabularnewline
47 & 0.030134 & 0.3117 & 0.377936 \tabularnewline
48 & 0.00955 & 0.0988 & 0.460746 \tabularnewline
\hline
\end{tabular}
%Source: https://freestatistics.org/blog/index.php?pk=234348&T=2

[TABLE]
[ROW][C]Partial Autocorrelation Function[/C][/ROW]
[ROW][C]Time lag k[/C][C]PACF(k)[/C][C]T-STAT[/C][C]P-value[/C][/ROW]
[ROW][C]1[/C][C]-0.355627[/C][C]-3.6786[/C][C]0.000184[/C][/ROW]
[ROW][C]2[/C][C]-0.532805[/C][C]-5.5114[/C][C]0[/C][/ROW]
[ROW][C]3[/C][C]0.229985[/C][C]2.379[/C][C]0.009566[/C][/ROW]
[ROW][C]4[/C][C]-0.223418[/C][C]-2.3111[/C][C]0.011373[/C][/ROW]
[ROW][C]5[/C][C]-0.188235[/C][C]-1.9471[/C][C]0.027071[/C][/ROW]
[ROW][C]6[/C][C]0.166447[/C][C]1.7217[/C][C]0.044003[/C][/ROW]
[ROW][C]7[/C][C]0.068159[/C][C]0.705[/C][C]0.241158[/C][/ROW]
[ROW][C]8[/C][C]-0.062384[/C][C]-0.6453[/C][C]0.260056[/C][/ROW]
[ROW][C]9[/C][C]0.106094[/C][C]1.0974[/C][C]0.137454[/C][/ROW]
[ROW][C]10[/C][C]-0.136055[/C][C]-1.4074[/C][C]0.081109[/C][/ROW]
[ROW][C]11[/C][C]-0.252157[/C][C]-2.6083[/C][C]0.005199[/C][/ROW]
[ROW][C]12[/C][C]0.242647[/C][C]2.51[/C][C]0.006786[/C][/ROW]
[ROW][C]13[/C][C]0.126327[/C][C]1.3067[/C][C]0.097052[/C][/ROW]
[ROW][C]14[/C][C]0.052683[/C][C]0.545[/C][C]0.29346[/C][/ROW]
[ROW][C]15[/C][C]-0.063377[/C][C]-0.6556[/C][C]0.256751[/C][/ROW]
[ROW][C]16[/C][C]-0.089945[/C][C]-0.9304[/C][C]0.177131[/C][/ROW]
[ROW][C]17[/C][C]-0.089066[/C][C]-0.9213[/C][C]0.179482[/C][/ROW]
[ROW][C]18[/C][C]-0.091433[/C][C]-0.9458[/C][C]0.173193[/C][/ROW]
[ROW][C]19[/C][C]-0.136251[/C][C]-1.4094[/C][C]0.08081[/C][/ROW]
[ROW][C]20[/C][C]-0.072369[/C][C]-0.7486[/C][C]0.227874[/C][/ROW]
[ROW][C]21[/C][C]0.071149[/C][C]0.736[/C][C]0.23168[/C][/ROW]
[ROW][C]22[/C][C]0.022798[/C][C]0.2358[/C][C]0.407011[/C][/ROW]
[ROW][C]23[/C][C]-0.049073[/C][C]-0.5076[/C][C]0.306386[/C][/ROW]
[ROW][C]24[/C][C]0.123886[/C][C]1.2815[/C][C]0.101397[/C][/ROW]
[ROW][C]25[/C][C]-0.007387[/C][C]-0.0764[/C][C]0.469616[/C][/ROW]
[ROW][C]26[/C][C]0.034869[/C][C]0.3607[/C][C]0.35952[/C][/ROW]
[ROW][C]27[/C][C]-0.082409[/C][C]-0.8524[/C][C]0.197934[/C][/ROW]
[ROW][C]28[/C][C]-8.8e-05[/C][C]-9e-04[/C][C]0.499637[/C][/ROW]
[ROW][C]29[/C][C]0.066382[/C][C]0.6867[/C][C]0.24689[/C][/ROW]
[ROW][C]30[/C][C]-0.116795[/C][C]-1.2081[/C][C]0.114829[/C][/ROW]
[ROW][C]31[/C][C]0.020768[/C][C]0.2148[/C][C]0.415157[/C][/ROW]
[ROW][C]32[/C][C]-0.145073[/C][C]-1.5006[/C][C]0.068196[/C][/ROW]
[ROW][C]33[/C][C]0.046201[/C][C]0.4779[/C][C]0.316844[/C][/ROW]
[ROW][C]34[/C][C]-0.144621[/C][C]-1.496[/C][C]0.068803[/C][/ROW]
[ROW][C]35[/C][C]-0.040817[/C][C]-0.4222[/C][C]0.336857[/C][/ROW]
[ROW][C]36[/C][C]0.159128[/C][C]1.646[/C][C]0.051346[/C][/ROW]
[ROW][C]37[/C][C]-0.074973[/C][C]-0.7755[/C][C]0.219871[/C][/ROW]
[ROW][C]38[/C][C]0.037716[/C][C]0.3901[/C][C]0.348606[/C][/ROW]
[ROW][C]39[/C][C]-0.008571[/C][C]-0.0887[/C][C]0.464761[/C][/ROW]
[ROW][C]40[/C][C]0.112511[/C][C]1.1638[/C][C]0.123543[/C][/ROW]
[ROW][C]41[/C][C]-0.067495[/C][C]-0.6982[/C][C]0.243291[/C][/ROW]
[ROW][C]42[/C][C]0.022669[/C][C]0.2345[/C][C]0.407527[/C][/ROW]
[ROW][C]43[/C][C]-0.021098[/C][C]-0.2182[/C][C]0.41383[/C][/ROW]
[ROW][C]44[/C][C]0.052442[/C][C]0.5425[/C][C]0.294313[/C][/ROW]
[ROW][C]45[/C][C]-0.036978[/C][C]-0.3825[/C][C]0.351424[/C][/ROW]
[ROW][C]46[/C][C]-0.052444[/C][C]-0.5425[/C][C]0.294307[/C][/ROW]
[ROW][C]47[/C][C]0.030134[/C][C]0.3117[/C][C]0.377936[/C][/ROW]
[ROW][C]48[/C][C]0.00955[/C][C]0.0988[/C][C]0.460746[/C][/ROW]
[/TABLE]
Source: https://freestatistics.org/blog/index.php?pk=234348&T=2

Globally Unique Identifier (entire table): ba.freestatistics.org/blog/index.php?pk=234348&T=2

As an alternative you can also use a QR Code:  

The GUIDs for individual cells are displayed in the table below:

Partial Autocorrelation Function
Time lag kPACF(k)T-STATP-value
1-0.355627-3.67860.000184
2-0.532805-5.51140
30.2299852.3790.009566
4-0.223418-2.31110.011373
5-0.188235-1.94710.027071
60.1664471.72170.044003
70.0681590.7050.241158
8-0.062384-0.64530.260056
90.1060941.09740.137454
10-0.136055-1.40740.081109
11-0.252157-2.60830.005199
120.2426472.510.006786
130.1263271.30670.097052
140.0526830.5450.29346
15-0.063377-0.65560.256751
16-0.089945-0.93040.177131
17-0.089066-0.92130.179482
18-0.091433-0.94580.173193
19-0.136251-1.40940.08081
20-0.072369-0.74860.227874
210.0711490.7360.23168
220.0227980.23580.407011
23-0.049073-0.50760.306386
240.1238861.28150.101397
25-0.007387-0.07640.469616
260.0348690.36070.35952
27-0.082409-0.85240.197934
28-8.8e-05-9e-040.499637
290.0663820.68670.24689
30-0.116795-1.20810.114829
310.0207680.21480.415157
32-0.145073-1.50060.068196
330.0462010.47790.316844
34-0.144621-1.4960.068803
35-0.040817-0.42220.336857
360.1591281.6460.051346
37-0.074973-0.77550.219871
380.0377160.39010.348606
39-0.008571-0.08870.464761
400.1125111.16380.123543
41-0.067495-0.69820.243291
420.0226690.23450.407527
43-0.021098-0.21820.41383
440.0524420.54250.294313
45-0.036978-0.38250.351424
46-0.052444-0.54250.294307
470.0301340.31170.377936
480.009550.09880.460746


Parameters (Session):
par1 = 48 ; par2 = 1 ; par3 = 1 ; par4 = 0 ; par5 = 12 ; par6 = White Noise ; par7 = 0.95 ;
Parameters (R input):
par1 = 48 ; par2 = 1 ; par3 = 1 ; par4 = 0 ; par5 = 12 ; par6 = White Noise ; par7 = 0.95 ; par8 = ;
R code (references can be found in the software module):
par8 <- ''
par7 <- '0.95'
par6 <- 'White Noise'
par5 <- '12'
par4 <- '0'
par3 <- '0'
par2 <- '1'
par1 <- '48'
if (par1 == 'Default') {
par1 = 10*log10(length(x))
} else {
par1 <- as.numeric(par1)
}
par2 <- as.numeric(par2)
par3 <- as.numeric(par3)
par4 <- as.numeric(par4)
par5 <- as.numeric(par5)
if (par6 == 'White Noise') par6 <- 'white' else par6 <- 'ma'
par7 <- as.numeric(par7)
if (par8 != '') par8 <- as.numeric(par8)
ox <- x
if (par8 == '') {
if (par2 == 0) {
x <- log(x)
} else {
x <- (x ^ par2 - 1) / par2
}
} else {
x <- log(x,base=par8)
}
if (par3 > 0) x <- diff(x,lag=1,difference=par3)
if (par4 > 0) x <- diff(x,lag=par5,difference=par4)
bitmap(file='picts.png')
op <- par(mfrow=c(2,1))
plot(ox,type='l',main='Original Time Series',xlab='time',ylab='value')
if (par8=='') {
mytitle <- paste('Working Time Series (lambda=',par2,', d=',par3,', D=',par4,')',sep='')
mysub <- paste('(lambda=',par2,', d=',par3,', D=',par4,', CI=', par7, ', CI type=',par6,')',sep='')
} else {
mytitle <- paste('Working Time Series (base=',par8,', d=',par3,', D=',par4,')',sep='')
mysub <- paste('(base=',par8,', d=',par3,', D=',par4,', CI=', par7, ', CI type=',par6,')',sep='')
}
plot(x,type='l', main=mytitle,xlab='time',ylab='value')
par(op)
dev.off()
bitmap(file='pic1.png')
racf <- acf(x, par1, main='Autocorrelation', xlab='time lag', ylab='ACF', ci.type=par6, ci=par7, sub=mysub)
dev.off()
bitmap(file='pic2.png')
rpacf <- pacf(x,par1,main='Partial Autocorrelation',xlab='lags',ylab='PACF',sub=mysub)
dev.off()
(myacf <- c(racf$acf))
(mypacf <- c(rpacf$acf))
lengthx <- length(x)
sqrtn <- sqrt(lengthx)
load(file='createtable')
a<-table.start()
a<-table.row.start(a)
a<-table.element(a,'Autocorrelation Function',4,TRUE)
a<-table.row.end(a)
a<-table.row.start(a)
a<-table.element(a,'Time lag k',header=TRUE)
a<-table.element(a,hyperlink('basics.htm','ACF(k)','click here for more information about the Autocorrelation Function'),header=TRUE)
a<-table.element(a,'T-STAT',header=TRUE)
a<-table.element(a,'P-value',header=TRUE)
a<-table.row.end(a)
for (i in 2:(par1+1)) {
a<-table.row.start(a)
a<-table.element(a,i-1,header=TRUE)
a<-table.element(a,round(myacf[i],6))
mytstat <- myacf[i]*sqrtn
a<-table.element(a,round(mytstat,4))
a<-table.element(a,round(1-pt(abs(mytstat),lengthx),6))
a<-table.row.end(a)
}
a<-table.end(a)
table.save(a,file='mytable.tab')
a<-table.start()
a<-table.row.start(a)
a<-table.element(a,'Partial Autocorrelation Function',4,TRUE)
a<-table.row.end(a)
a<-table.row.start(a)
a<-table.element(a,'Time lag k',header=TRUE)
a<-table.element(a,hyperlink('basics.htm','PACF(k)','click here for more information about the Partial Autocorrelation Function'),header=TRUE)
a<-table.element(a,'T-STAT',header=TRUE)
a<-table.element(a,'P-value',header=TRUE)
a<-table.row.end(a)
for (i in 1:par1) {
a<-table.row.start(a)
a<-table.element(a,i,header=TRUE)
a<-table.element(a,round(mypacf[i],6))
mytstat <- mypacf[i]*sqrtn
a<-table.element(a,round(mytstat,4))
a<-table.element(a,round(1-pt(abs(mytstat),lengthx),6))
a<-table.row.end(a)
}
a<-table.end(a)
table.save(a,file='mytable1.tab')