Free Statistics

of Irreproducible Research!

Author's title

Author*Unverified author*
R Software Modulerwasp_autocorrelation.wasp
Title produced by software(Partial) Autocorrelation Function
Date of computationMon, 17 Mar 2014 18:43:06 -0400
Cite this page as followsStatistical Computations at FreeStatistics.org, Office for Research Development and Education, URL https://freestatistics.org/blog/index.php?v=date/2014/Mar/17/t1395096197tkeczgrp753x74y.htm/, Retrieved Tue, 14 May 2024 09:33:22 +0000
Statistical Computations at FreeStatistics.org, Office for Research Development and Education, URL https://freestatistics.org/blog/index.php?pk=234347, Retrieved Tue, 14 May 2024 09:33:22 +0000
QR Codes:

Original text written by user:
IsPrivate?No (this computation is public)
User-defined keywords
Estimated Impact53
Family? (F = Feedback message, R = changed R code, M = changed R Module, P = changed Parameters, D = changed Data)
-       [(Partial) Autocorrelation Function] [] [2014-03-17 22:43:06] [0b4002381e6bc6fac3755b1107da82aa] [Current]
Feedback Forum

Post a new message
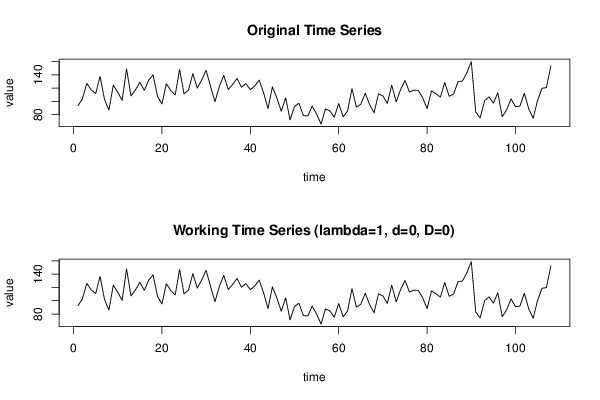
Dataseries X:
93.6
103.5
127
117.5
111.5
137.6
103.2
86.9
124.4
113.6
101.6
148.5
108.3
117.2
128.7
116.5
131.7
139.9
107.4
96.1
126.5
116.4
109.8
148
111.4
117
141.7
120
132.1
146.7
122.5
99.6
122.7
139
117.8
125.5
134.5
121.3
126.7
117.7
123
132.1
113.1
89.2
121.7
105.3
85.3
105.3
72.2
92.1
97.2
78.6
78.1
93
81
65.9
88.6
85.7
76.3
96.8
76.8
85.6
119.2
91.4
95.7
112.3
95.2
82.8
111.3
108.2
97
124.4
99.3
117.6
131.5
114.2
116.8
116.5
105.4
89.2
115.8
111.4
106.4
128.4
107.7
111
129.8
130.5
142.9
159.9
84.1
75
100.7
106.8
97.4
113
76.9
87.3
103.7
92.1
92.9
112.2
88.7
74.6
101.5
119.7
120.7
153,5


Summary of computational transaction
Raw Inputview raw input (R code)
Raw Outputview raw output of R engine
Computing time4 seconds
R Server'Herman Ole Andreas Wold' @ wold.wessa.net

\begin{tabular}{lllllllll}
\hline
Summary of computational transaction \tabularnewline
Raw Input & view raw input (R code)  \tabularnewline
Raw Output & view raw output of R engine  \tabularnewline
Computing time & 4 seconds \tabularnewline
R Server & 'Herman Ole Andreas Wold' @ wold.wessa.net \tabularnewline
\hline
\end{tabular}
%Source: https://freestatistics.org/blog/index.php?pk=234347&T=0

[TABLE]
[ROW][C]Summary of computational transaction[/C][/ROW]
[ROW][C]Raw Input[/C][C]view raw input (R code) [/C][/ROW]
[ROW][C]Raw Output[/C][C]view raw output of R engine [/C][/ROW]
[ROW][C]Computing time[/C][C]4 seconds[/C][/ROW]
[ROW][C]R Server[/C][C]'Herman Ole Andreas Wold' @ wold.wessa.net[/C][/ROW]
[/TABLE]
Source: https://freestatistics.org/blog/index.php?pk=234347&T=0

Globally Unique Identifier (entire table): ba.freestatistics.org/blog/index.php?pk=234347&T=0

As an alternative you can also use a QR Code:  

The GUIDs for individual cells are displayed in the table below:

Summary of computational transaction
Raw Inputview raw input (R code)
Raw Outputview raw output of R engine
Computing time4 seconds
R Server'Herman Ole Andreas Wold' @ wold.wessa.net


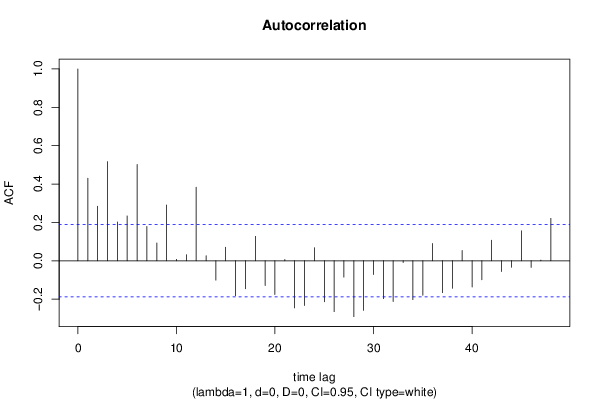
Autocorrelation Function
Time lag kACF(k)T-STATP-value
10.4299824.46851e-05
20.2842932.95450.001923
30.5171855.37470
40.2021272.10060.019004
50.2340422.43220.008325
60.5023165.22020
70.1792051.86240.032636
80.092660.96290.168862
90.2904823.01880.001583
100.0075640.07860.468746
110.0312350.32460.373053
120.3831463.98186.2e-05
130.0260940.27120.393387
14-0.100596-1.04540.149081
150.0708920.73670.231442
16-0.181845-1.88980.030734
17-0.145435-1.51140.066803
180.1273531.32350.094233
19-0.128597-1.33640.092111
20-0.17571-1.8260.035304
210.0071890.07470.47029
22-0.245379-2.55010.006086
23-0.232956-2.4210.008574
240.0677150.70370.241562
25-0.213481-2.21860.014304
26-0.264794-2.75180.003476
27-0.085062-0.8840.189333
28-0.291082-3.0250.001554
29-0.258616-2.68760.004168
30-0.071025-0.73810.231023
31-0.197044-2.04770.021506
32-0.212148-2.20470.014798
33-0.009267-0.09630.461728
34-0.202477-2.10420.018841
35-0.179896-1.86950.032128
360.0904540.940.17465
37-0.165806-1.72310.043865
38-0.14344-1.49070.069481
390.0536540.55760.289139
40-0.13638-1.41730.079637
41-0.099218-1.03110.152397
420.1068461.11040.134652
43-0.055603-0.57780.282286
44-0.033328-0.34640.364876
450.1560281.62150.053915
46-0.034258-0.3560.361259
470.0036430.03790.484936
480.2212192.2990.011715

\begin{tabular}{lllllllll}
\hline
Autocorrelation Function \tabularnewline
Time lag k & ACF(k) & T-STAT & P-value \tabularnewline
1 & 0.429982 & 4.4685 & 1e-05 \tabularnewline
2 & 0.284293 & 2.9545 & 0.001923 \tabularnewline
3 & 0.517185 & 5.3747 & 0 \tabularnewline
4 & 0.202127 & 2.1006 & 0.019004 \tabularnewline
5 & 0.234042 & 2.4322 & 0.008325 \tabularnewline
6 & 0.502316 & 5.2202 & 0 \tabularnewline
7 & 0.179205 & 1.8624 & 0.032636 \tabularnewline
8 & 0.09266 & 0.9629 & 0.168862 \tabularnewline
9 & 0.290482 & 3.0188 & 0.001583 \tabularnewline
10 & 0.007564 & 0.0786 & 0.468746 \tabularnewline
11 & 0.031235 & 0.3246 & 0.373053 \tabularnewline
12 & 0.383146 & 3.9818 & 6.2e-05 \tabularnewline
13 & 0.026094 & 0.2712 & 0.393387 \tabularnewline
14 & -0.100596 & -1.0454 & 0.149081 \tabularnewline
15 & 0.070892 & 0.7367 & 0.231442 \tabularnewline
16 & -0.181845 & -1.8898 & 0.030734 \tabularnewline
17 & -0.145435 & -1.5114 & 0.066803 \tabularnewline
18 & 0.127353 & 1.3235 & 0.094233 \tabularnewline
19 & -0.128597 & -1.3364 & 0.092111 \tabularnewline
20 & -0.17571 & -1.826 & 0.035304 \tabularnewline
21 & 0.007189 & 0.0747 & 0.47029 \tabularnewline
22 & -0.245379 & -2.5501 & 0.006086 \tabularnewline
23 & -0.232956 & -2.421 & 0.008574 \tabularnewline
24 & 0.067715 & 0.7037 & 0.241562 \tabularnewline
25 & -0.213481 & -2.2186 & 0.014304 \tabularnewline
26 & -0.264794 & -2.7518 & 0.003476 \tabularnewline
27 & -0.085062 & -0.884 & 0.189333 \tabularnewline
28 & -0.291082 & -3.025 & 0.001554 \tabularnewline
29 & -0.258616 & -2.6876 & 0.004168 \tabularnewline
30 & -0.071025 & -0.7381 & 0.231023 \tabularnewline
31 & -0.197044 & -2.0477 & 0.021506 \tabularnewline
32 & -0.212148 & -2.2047 & 0.014798 \tabularnewline
33 & -0.009267 & -0.0963 & 0.461728 \tabularnewline
34 & -0.202477 & -2.1042 & 0.018841 \tabularnewline
35 & -0.179896 & -1.8695 & 0.032128 \tabularnewline
36 & 0.090454 & 0.94 & 0.17465 \tabularnewline
37 & -0.165806 & -1.7231 & 0.043865 \tabularnewline
38 & -0.14344 & -1.4907 & 0.069481 \tabularnewline
39 & 0.053654 & 0.5576 & 0.289139 \tabularnewline
40 & -0.13638 & -1.4173 & 0.079637 \tabularnewline
41 & -0.099218 & -1.0311 & 0.152397 \tabularnewline
42 & 0.106846 & 1.1104 & 0.134652 \tabularnewline
43 & -0.055603 & -0.5778 & 0.282286 \tabularnewline
44 & -0.033328 & -0.3464 & 0.364876 \tabularnewline
45 & 0.156028 & 1.6215 & 0.053915 \tabularnewline
46 & -0.034258 & -0.356 & 0.361259 \tabularnewline
47 & 0.003643 & 0.0379 & 0.484936 \tabularnewline
48 & 0.221219 & 2.299 & 0.011715 \tabularnewline
\hline
\end{tabular}
%Source: https://freestatistics.org/blog/index.php?pk=234347&T=1

[TABLE]
[ROW][C]Autocorrelation Function[/C][/ROW]
[ROW][C]Time lag k[/C][C]ACF(k)[/C][C]T-STAT[/C][C]P-value[/C][/ROW]
[ROW][C]1[/C][C]0.429982[/C][C]4.4685[/C][C]1e-05[/C][/ROW]
[ROW][C]2[/C][C]0.284293[/C][C]2.9545[/C][C]0.001923[/C][/ROW]
[ROW][C]3[/C][C]0.517185[/C][C]5.3747[/C][C]0[/C][/ROW]
[ROW][C]4[/C][C]0.202127[/C][C]2.1006[/C][C]0.019004[/C][/ROW]
[ROW][C]5[/C][C]0.234042[/C][C]2.4322[/C][C]0.008325[/C][/ROW]
[ROW][C]6[/C][C]0.502316[/C][C]5.2202[/C][C]0[/C][/ROW]
[ROW][C]7[/C][C]0.179205[/C][C]1.8624[/C][C]0.032636[/C][/ROW]
[ROW][C]8[/C][C]0.09266[/C][C]0.9629[/C][C]0.168862[/C][/ROW]
[ROW][C]9[/C][C]0.290482[/C][C]3.0188[/C][C]0.001583[/C][/ROW]
[ROW][C]10[/C][C]0.007564[/C][C]0.0786[/C][C]0.468746[/C][/ROW]
[ROW][C]11[/C][C]0.031235[/C][C]0.3246[/C][C]0.373053[/C][/ROW]
[ROW][C]12[/C][C]0.383146[/C][C]3.9818[/C][C]6.2e-05[/C][/ROW]
[ROW][C]13[/C][C]0.026094[/C][C]0.2712[/C][C]0.393387[/C][/ROW]
[ROW][C]14[/C][C]-0.100596[/C][C]-1.0454[/C][C]0.149081[/C][/ROW]
[ROW][C]15[/C][C]0.070892[/C][C]0.7367[/C][C]0.231442[/C][/ROW]
[ROW][C]16[/C][C]-0.181845[/C][C]-1.8898[/C][C]0.030734[/C][/ROW]
[ROW][C]17[/C][C]-0.145435[/C][C]-1.5114[/C][C]0.066803[/C][/ROW]
[ROW][C]18[/C][C]0.127353[/C][C]1.3235[/C][C]0.094233[/C][/ROW]
[ROW][C]19[/C][C]-0.128597[/C][C]-1.3364[/C][C]0.092111[/C][/ROW]
[ROW][C]20[/C][C]-0.17571[/C][C]-1.826[/C][C]0.035304[/C][/ROW]
[ROW][C]21[/C][C]0.007189[/C][C]0.0747[/C][C]0.47029[/C][/ROW]
[ROW][C]22[/C][C]-0.245379[/C][C]-2.5501[/C][C]0.006086[/C][/ROW]
[ROW][C]23[/C][C]-0.232956[/C][C]-2.421[/C][C]0.008574[/C][/ROW]
[ROW][C]24[/C][C]0.067715[/C][C]0.7037[/C][C]0.241562[/C][/ROW]
[ROW][C]25[/C][C]-0.213481[/C][C]-2.2186[/C][C]0.014304[/C][/ROW]
[ROW][C]26[/C][C]-0.264794[/C][C]-2.7518[/C][C]0.003476[/C][/ROW]
[ROW][C]27[/C][C]-0.085062[/C][C]-0.884[/C][C]0.189333[/C][/ROW]
[ROW][C]28[/C][C]-0.291082[/C][C]-3.025[/C][C]0.001554[/C][/ROW]
[ROW][C]29[/C][C]-0.258616[/C][C]-2.6876[/C][C]0.004168[/C][/ROW]
[ROW][C]30[/C][C]-0.071025[/C][C]-0.7381[/C][C]0.231023[/C][/ROW]
[ROW][C]31[/C][C]-0.197044[/C][C]-2.0477[/C][C]0.021506[/C][/ROW]
[ROW][C]32[/C][C]-0.212148[/C][C]-2.2047[/C][C]0.014798[/C][/ROW]
[ROW][C]33[/C][C]-0.009267[/C][C]-0.0963[/C][C]0.461728[/C][/ROW]
[ROW][C]34[/C][C]-0.202477[/C][C]-2.1042[/C][C]0.018841[/C][/ROW]
[ROW][C]35[/C][C]-0.179896[/C][C]-1.8695[/C][C]0.032128[/C][/ROW]
[ROW][C]36[/C][C]0.090454[/C][C]0.94[/C][C]0.17465[/C][/ROW]
[ROW][C]37[/C][C]-0.165806[/C][C]-1.7231[/C][C]0.043865[/C][/ROW]
[ROW][C]38[/C][C]-0.14344[/C][C]-1.4907[/C][C]0.069481[/C][/ROW]
[ROW][C]39[/C][C]0.053654[/C][C]0.5576[/C][C]0.289139[/C][/ROW]
[ROW][C]40[/C][C]-0.13638[/C][C]-1.4173[/C][C]0.079637[/C][/ROW]
[ROW][C]41[/C][C]-0.099218[/C][C]-1.0311[/C][C]0.152397[/C][/ROW]
[ROW][C]42[/C][C]0.106846[/C][C]1.1104[/C][C]0.134652[/C][/ROW]
[ROW][C]43[/C][C]-0.055603[/C][C]-0.5778[/C][C]0.282286[/C][/ROW]
[ROW][C]44[/C][C]-0.033328[/C][C]-0.3464[/C][C]0.364876[/C][/ROW]
[ROW][C]45[/C][C]0.156028[/C][C]1.6215[/C][C]0.053915[/C][/ROW]
[ROW][C]46[/C][C]-0.034258[/C][C]-0.356[/C][C]0.361259[/C][/ROW]
[ROW][C]47[/C][C]0.003643[/C][C]0.0379[/C][C]0.484936[/C][/ROW]
[ROW][C]48[/C][C]0.221219[/C][C]2.299[/C][C]0.011715[/C][/ROW]
[/TABLE]
Source: https://freestatistics.org/blog/index.php?pk=234347&T=1

Globally Unique Identifier (entire table): ba.freestatistics.org/blog/index.php?pk=234347&T=1

As an alternative you can also use a QR Code:  

The GUIDs for individual cells are displayed in the table below:

Autocorrelation Function
Time lag kACF(k)T-STATP-value
10.4299824.46851e-05
20.2842932.95450.001923
30.5171855.37470
40.2021272.10060.019004
50.2340422.43220.008325
60.5023165.22020
70.1792051.86240.032636
80.092660.96290.168862
90.2904823.01880.001583
100.0075640.07860.468746
110.0312350.32460.373053
120.3831463.98186.2e-05
130.0260940.27120.393387
14-0.100596-1.04540.149081
150.0708920.73670.231442
16-0.181845-1.88980.030734
17-0.145435-1.51140.066803
180.1273531.32350.094233
19-0.128597-1.33640.092111
20-0.17571-1.8260.035304
210.0071890.07470.47029
22-0.245379-2.55010.006086
23-0.232956-2.4210.008574
240.0677150.70370.241562
25-0.213481-2.21860.014304
26-0.264794-2.75180.003476
27-0.085062-0.8840.189333
28-0.291082-3.0250.001554
29-0.258616-2.68760.004168
30-0.071025-0.73810.231023
31-0.197044-2.04770.021506
32-0.212148-2.20470.014798
33-0.009267-0.09630.461728
34-0.202477-2.10420.018841
35-0.179896-1.86950.032128
360.0904540.940.17465
37-0.165806-1.72310.043865
38-0.14344-1.49070.069481
390.0536540.55760.289139
40-0.13638-1.41730.079637
41-0.099218-1.03110.152397
420.1068461.11040.134652
43-0.055603-0.57780.282286
44-0.033328-0.34640.364876
450.1560281.62150.053915
46-0.034258-0.3560.361259
470.0036430.03790.484936
480.2212192.2990.011715


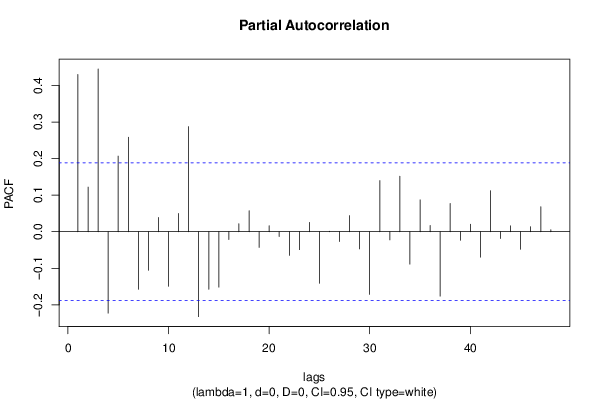
Partial Autocorrelation Function
Time lag kPACF(k)T-STATP-value
10.4299824.46851e-05
20.1219571.26740.103867
30.4451024.62565e-06
4-0.222613-2.31350.011296
50.2067652.14880.016943
60.258542.68680.004177
7-0.157414-1.63590.052387
8-0.105369-1.0950.13797
90.0388160.40340.343728
10-0.149075-1.54920.062126
110.0498060.51760.3029
120.2874032.98680.001745
13-0.232257-2.41370.008737
14-0.157217-1.63380.052602
15-0.151463-1.5740.059201
16-0.021243-0.22080.412846
170.0216190.22470.411331
180.0573730.59620.276133
19-0.042788-0.44470.328727
200.0163870.17030.432547
21-0.013001-0.13510.44639
22-0.064725-0.67260.251307
23-0.048994-0.50920.305839
240.0254840.26480.395818
25-0.141011-1.46540.072855
260.0012120.01260.494989
27-0.026645-0.27690.391193
280.0440810.45810.323898
29-0.046984-0.48830.313172
30-0.171434-1.78160.038813
310.1396671.45150.074775
32-0.022298-0.23170.408593
330.1515341.57480.059116
34-0.088658-0.92140.179458
350.0871670.90590.183511
360.016920.17580.430375
37-0.176201-1.83110.034918
380.0771290.80150.212288
39-0.02319-0.2410.405008
400.0202840.21080.41672
41-0.069443-0.72170.236028
420.1120681.16460.123364
43-0.018531-0.19260.423823
440.0159660.16590.434265
45-0.047991-0.49870.309489
460.0134390.13970.444594
470.0684250.71110.23928
480.0055350.05750.477116

\begin{tabular}{lllllllll}
\hline
Partial Autocorrelation Function \tabularnewline
Time lag k & PACF(k) & T-STAT & P-value \tabularnewline
1 & 0.429982 & 4.4685 & 1e-05 \tabularnewline
2 & 0.121957 & 1.2674 & 0.103867 \tabularnewline
3 & 0.445102 & 4.6256 & 5e-06 \tabularnewline
4 & -0.222613 & -2.3135 & 0.011296 \tabularnewline
5 & 0.206765 & 2.1488 & 0.016943 \tabularnewline
6 & 0.25854 & 2.6868 & 0.004177 \tabularnewline
7 & -0.157414 & -1.6359 & 0.052387 \tabularnewline
8 & -0.105369 & -1.095 & 0.13797 \tabularnewline
9 & 0.038816 & 0.4034 & 0.343728 \tabularnewline
10 & -0.149075 & -1.5492 & 0.062126 \tabularnewline
11 & 0.049806 & 0.5176 & 0.3029 \tabularnewline
12 & 0.287403 & 2.9868 & 0.001745 \tabularnewline
13 & -0.232257 & -2.4137 & 0.008737 \tabularnewline
14 & -0.157217 & -1.6338 & 0.052602 \tabularnewline
15 & -0.151463 & -1.574 & 0.059201 \tabularnewline
16 & -0.021243 & -0.2208 & 0.412846 \tabularnewline
17 & 0.021619 & 0.2247 & 0.411331 \tabularnewline
18 & 0.057373 & 0.5962 & 0.276133 \tabularnewline
19 & -0.042788 & -0.4447 & 0.328727 \tabularnewline
20 & 0.016387 & 0.1703 & 0.432547 \tabularnewline
21 & -0.013001 & -0.1351 & 0.44639 \tabularnewline
22 & -0.064725 & -0.6726 & 0.251307 \tabularnewline
23 & -0.048994 & -0.5092 & 0.305839 \tabularnewline
24 & 0.025484 & 0.2648 & 0.395818 \tabularnewline
25 & -0.141011 & -1.4654 & 0.072855 \tabularnewline
26 & 0.001212 & 0.0126 & 0.494989 \tabularnewline
27 & -0.026645 & -0.2769 & 0.391193 \tabularnewline
28 & 0.044081 & 0.4581 & 0.323898 \tabularnewline
29 & -0.046984 & -0.4883 & 0.313172 \tabularnewline
30 & -0.171434 & -1.7816 & 0.038813 \tabularnewline
31 & 0.139667 & 1.4515 & 0.074775 \tabularnewline
32 & -0.022298 & -0.2317 & 0.408593 \tabularnewline
33 & 0.151534 & 1.5748 & 0.059116 \tabularnewline
34 & -0.088658 & -0.9214 & 0.179458 \tabularnewline
35 & 0.087167 & 0.9059 & 0.183511 \tabularnewline
36 & 0.01692 & 0.1758 & 0.430375 \tabularnewline
37 & -0.176201 & -1.8311 & 0.034918 \tabularnewline
38 & 0.077129 & 0.8015 & 0.212288 \tabularnewline
39 & -0.02319 & -0.241 & 0.405008 \tabularnewline
40 & 0.020284 & 0.2108 & 0.41672 \tabularnewline
41 & -0.069443 & -0.7217 & 0.236028 \tabularnewline
42 & 0.112068 & 1.1646 & 0.123364 \tabularnewline
43 & -0.018531 & -0.1926 & 0.423823 \tabularnewline
44 & 0.015966 & 0.1659 & 0.434265 \tabularnewline
45 & -0.047991 & -0.4987 & 0.309489 \tabularnewline
46 & 0.013439 & 0.1397 & 0.444594 \tabularnewline
47 & 0.068425 & 0.7111 & 0.23928 \tabularnewline
48 & 0.005535 & 0.0575 & 0.477116 \tabularnewline
\hline
\end{tabular}
%Source: https://freestatistics.org/blog/index.php?pk=234347&T=2

[TABLE]
[ROW][C]Partial Autocorrelation Function[/C][/ROW]
[ROW][C]Time lag k[/C][C]PACF(k)[/C][C]T-STAT[/C][C]P-value[/C][/ROW]
[ROW][C]1[/C][C]0.429982[/C][C]4.4685[/C][C]1e-05[/C][/ROW]
[ROW][C]2[/C][C]0.121957[/C][C]1.2674[/C][C]0.103867[/C][/ROW]
[ROW][C]3[/C][C]0.445102[/C][C]4.6256[/C][C]5e-06[/C][/ROW]
[ROW][C]4[/C][C]-0.222613[/C][C]-2.3135[/C][C]0.011296[/C][/ROW]
[ROW][C]5[/C][C]0.206765[/C][C]2.1488[/C][C]0.016943[/C][/ROW]
[ROW][C]6[/C][C]0.25854[/C][C]2.6868[/C][C]0.004177[/C][/ROW]
[ROW][C]7[/C][C]-0.157414[/C][C]-1.6359[/C][C]0.052387[/C][/ROW]
[ROW][C]8[/C][C]-0.105369[/C][C]-1.095[/C][C]0.13797[/C][/ROW]
[ROW][C]9[/C][C]0.038816[/C][C]0.4034[/C][C]0.343728[/C][/ROW]
[ROW][C]10[/C][C]-0.149075[/C][C]-1.5492[/C][C]0.062126[/C][/ROW]
[ROW][C]11[/C][C]0.049806[/C][C]0.5176[/C][C]0.3029[/C][/ROW]
[ROW][C]12[/C][C]0.287403[/C][C]2.9868[/C][C]0.001745[/C][/ROW]
[ROW][C]13[/C][C]-0.232257[/C][C]-2.4137[/C][C]0.008737[/C][/ROW]
[ROW][C]14[/C][C]-0.157217[/C][C]-1.6338[/C][C]0.052602[/C][/ROW]
[ROW][C]15[/C][C]-0.151463[/C][C]-1.574[/C][C]0.059201[/C][/ROW]
[ROW][C]16[/C][C]-0.021243[/C][C]-0.2208[/C][C]0.412846[/C][/ROW]
[ROW][C]17[/C][C]0.021619[/C][C]0.2247[/C][C]0.411331[/C][/ROW]
[ROW][C]18[/C][C]0.057373[/C][C]0.5962[/C][C]0.276133[/C][/ROW]
[ROW][C]19[/C][C]-0.042788[/C][C]-0.4447[/C][C]0.328727[/C][/ROW]
[ROW][C]20[/C][C]0.016387[/C][C]0.1703[/C][C]0.432547[/C][/ROW]
[ROW][C]21[/C][C]-0.013001[/C][C]-0.1351[/C][C]0.44639[/C][/ROW]
[ROW][C]22[/C][C]-0.064725[/C][C]-0.6726[/C][C]0.251307[/C][/ROW]
[ROW][C]23[/C][C]-0.048994[/C][C]-0.5092[/C][C]0.305839[/C][/ROW]
[ROW][C]24[/C][C]0.025484[/C][C]0.2648[/C][C]0.395818[/C][/ROW]
[ROW][C]25[/C][C]-0.141011[/C][C]-1.4654[/C][C]0.072855[/C][/ROW]
[ROW][C]26[/C][C]0.001212[/C][C]0.0126[/C][C]0.494989[/C][/ROW]
[ROW][C]27[/C][C]-0.026645[/C][C]-0.2769[/C][C]0.391193[/C][/ROW]
[ROW][C]28[/C][C]0.044081[/C][C]0.4581[/C][C]0.323898[/C][/ROW]
[ROW][C]29[/C][C]-0.046984[/C][C]-0.4883[/C][C]0.313172[/C][/ROW]
[ROW][C]30[/C][C]-0.171434[/C][C]-1.7816[/C][C]0.038813[/C][/ROW]
[ROW][C]31[/C][C]0.139667[/C][C]1.4515[/C][C]0.074775[/C][/ROW]
[ROW][C]32[/C][C]-0.022298[/C][C]-0.2317[/C][C]0.408593[/C][/ROW]
[ROW][C]33[/C][C]0.151534[/C][C]1.5748[/C][C]0.059116[/C][/ROW]
[ROW][C]34[/C][C]-0.088658[/C][C]-0.9214[/C][C]0.179458[/C][/ROW]
[ROW][C]35[/C][C]0.087167[/C][C]0.9059[/C][C]0.183511[/C][/ROW]
[ROW][C]36[/C][C]0.01692[/C][C]0.1758[/C][C]0.430375[/C][/ROW]
[ROW][C]37[/C][C]-0.176201[/C][C]-1.8311[/C][C]0.034918[/C][/ROW]
[ROW][C]38[/C][C]0.077129[/C][C]0.8015[/C][C]0.212288[/C][/ROW]
[ROW][C]39[/C][C]-0.02319[/C][C]-0.241[/C][C]0.405008[/C][/ROW]
[ROW][C]40[/C][C]0.020284[/C][C]0.2108[/C][C]0.41672[/C][/ROW]
[ROW][C]41[/C][C]-0.069443[/C][C]-0.7217[/C][C]0.236028[/C][/ROW]
[ROW][C]42[/C][C]0.112068[/C][C]1.1646[/C][C]0.123364[/C][/ROW]
[ROW][C]43[/C][C]-0.018531[/C][C]-0.1926[/C][C]0.423823[/C][/ROW]
[ROW][C]44[/C][C]0.015966[/C][C]0.1659[/C][C]0.434265[/C][/ROW]
[ROW][C]45[/C][C]-0.047991[/C][C]-0.4987[/C][C]0.309489[/C][/ROW]
[ROW][C]46[/C][C]0.013439[/C][C]0.1397[/C][C]0.444594[/C][/ROW]
[ROW][C]47[/C][C]0.068425[/C][C]0.7111[/C][C]0.23928[/C][/ROW]
[ROW][C]48[/C][C]0.005535[/C][C]0.0575[/C][C]0.477116[/C][/ROW]
[/TABLE]
Source: https://freestatistics.org/blog/index.php?pk=234347&T=2

Globally Unique Identifier (entire table): ba.freestatistics.org/blog/index.php?pk=234347&T=2

As an alternative you can also use a QR Code:  

The GUIDs for individual cells are displayed in the table below:

Partial Autocorrelation Function
Time lag kPACF(k)T-STATP-value
10.4299824.46851e-05
20.1219571.26740.103867
30.4451024.62565e-06
4-0.222613-2.31350.011296
50.2067652.14880.016943
60.258542.68680.004177
7-0.157414-1.63590.052387
8-0.105369-1.0950.13797
90.0388160.40340.343728
10-0.149075-1.54920.062126
110.0498060.51760.3029
120.2874032.98680.001745
13-0.232257-2.41370.008737
14-0.157217-1.63380.052602
15-0.151463-1.5740.059201
16-0.021243-0.22080.412846
170.0216190.22470.411331
180.0573730.59620.276133
19-0.042788-0.44470.328727
200.0163870.17030.432547
21-0.013001-0.13510.44639
22-0.064725-0.67260.251307
23-0.048994-0.50920.305839
240.0254840.26480.395818
25-0.141011-1.46540.072855
260.0012120.01260.494989
27-0.026645-0.27690.391193
280.0440810.45810.323898
29-0.046984-0.48830.313172
30-0.171434-1.78160.038813
310.1396671.45150.074775
32-0.022298-0.23170.408593
330.1515341.57480.059116
34-0.088658-0.92140.179458
350.0871670.90590.183511
360.016920.17580.430375
37-0.176201-1.83110.034918
380.0771290.80150.212288
39-0.02319-0.2410.405008
400.0202840.21080.41672
41-0.069443-0.72170.236028
420.1120681.16460.123364
43-0.018531-0.19260.423823
440.0159660.16590.434265
45-0.047991-0.49870.309489
460.0134390.13970.444594
470.0684250.71110.23928
480.0055350.05750.477116


Parameters (Session):
par1 = 48 ; par2 = 1 ; par3 = 0 ; par4 = 0 ; par5 = 12 ; par6 = White Noise ; par7 = 0.95 ;
Parameters (R input):
par1 = 48 ; par2 = 1 ; par3 = 0 ; par4 = 0 ; par5 = 12 ; par6 = White Noise ; par7 = 0.95 ; par8 = ;
R code (references can be found in the software module):
if (par1 == 'Default') {
par1 = 10*log10(length(x))
} else {
par1 <- as.numeric(par1)
}
par2 <- as.numeric(par2)
par3 <- as.numeric(par3)
par4 <- as.numeric(par4)
par5 <- as.numeric(par5)
if (par6 == 'White Noise') par6 <- 'white' else par6 <- 'ma'
par7 <- as.numeric(par7)
if (par8 != '') par8 <- as.numeric(par8)
ox <- x
if (par8 == '') {
if (par2 == 0) {
x <- log(x)
} else {
x <- (x ^ par2 - 1) / par2
}
} else {
x <- log(x,base=par8)
}
if (par3 > 0) x <- diff(x,lag=1,difference=par3)
if (par4 > 0) x <- diff(x,lag=par5,difference=par4)
bitmap(file='picts.png')
op <- par(mfrow=c(2,1))
plot(ox,type='l',main='Original Time Series',xlab='time',ylab='value')
if (par8=='') {
mytitle <- paste('Working Time Series (lambda=',par2,', d=',par3,', D=',par4,')',sep='')
mysub <- paste('(lambda=',par2,', d=',par3,', D=',par4,', CI=', par7, ', CI type=',par6,')',sep='')
} else {
mytitle <- paste('Working Time Series (base=',par8,', d=',par3,', D=',par4,')',sep='')
mysub <- paste('(base=',par8,', d=',par3,', D=',par4,', CI=', par7, ', CI type=',par6,')',sep='')
}
plot(x,type='l', main=mytitle,xlab='time',ylab='value')
par(op)
dev.off()
bitmap(file='pic1.png')
racf <- acf(x, par1, main='Autocorrelation', xlab='time lag', ylab='ACF', ci.type=par6, ci=par7, sub=mysub)
dev.off()
bitmap(file='pic2.png')
rpacf <- pacf(x,par1,main='Partial Autocorrelation',xlab='lags',ylab='PACF',sub=mysub)
dev.off()
(myacf <- c(racf$acf))
(mypacf <- c(rpacf$acf))
lengthx <- length(x)
sqrtn <- sqrt(lengthx)
load(file='createtable')
a<-table.start()
a<-table.row.start(a)
a<-table.element(a,'Autocorrelation Function',4,TRUE)
a<-table.row.end(a)
a<-table.row.start(a)
a<-table.element(a,'Time lag k',header=TRUE)
a<-table.element(a,hyperlink('basics.htm','ACF(k)','click here for more information about the Autocorrelation Function'),header=TRUE)
a<-table.element(a,'T-STAT',header=TRUE)
a<-table.element(a,'P-value',header=TRUE)
a<-table.row.end(a)
for (i in 2:(par1+1)) {
a<-table.row.start(a)
a<-table.element(a,i-1,header=TRUE)
a<-table.element(a,round(myacf[i],6))
mytstat <- myacf[i]*sqrtn
a<-table.element(a,round(mytstat,4))
a<-table.element(a,round(1-pt(abs(mytstat),lengthx),6))
a<-table.row.end(a)
}
a<-table.end(a)
table.save(a,file='mytable.tab')
a<-table.start()
a<-table.row.start(a)
a<-table.element(a,'Partial Autocorrelation Function',4,TRUE)
a<-table.row.end(a)
a<-table.row.start(a)
a<-table.element(a,'Time lag k',header=TRUE)
a<-table.element(a,hyperlink('basics.htm','PACF(k)','click here for more information about the Partial Autocorrelation Function'),header=TRUE)
a<-table.element(a,'T-STAT',header=TRUE)
a<-table.element(a,'P-value',header=TRUE)
a<-table.row.end(a)
for (i in 1:par1) {
a<-table.row.start(a)
a<-table.element(a,i,header=TRUE)
a<-table.element(a,round(mypacf[i],6))
mytstat <- mypacf[i]*sqrtn
a<-table.element(a,round(mytstat,4))
a<-table.element(a,round(1-pt(abs(mytstat),lengthx),6))
a<-table.row.end(a)
}
a<-table.end(a)
table.save(a,file='mytable1.tab')