Free Statistics

of Irreproducible Research!

Author's title

Author*Unverified author*
R Software Modulerwasp_autocorrelation.wasp
Title produced by software(Partial) Autocorrelation Function
Date of computationMon, 17 Mar 2014 18:12:28 -0400
Cite this page as followsStatistical Computations at FreeStatistics.org, Office for Research Development and Education, URL https://freestatistics.org/blog/index.php?v=date/2014/Mar/17/t1395094381wzndyawrem4g4w0.htm/, Retrieved Tue, 14 May 2024 04:39:56 +0000
Statistical Computations at FreeStatistics.org, Office for Research Development and Education, URL https://freestatistics.org/blog/index.php?pk=234335, Retrieved Tue, 14 May 2024 04:39:56 +0000
QR Codes:

Original text written by user:
IsPrivate?No (this computation is public)
User-defined keywords
Estimated Impact62
Family? (F = Feedback message, R = changed R code, M = changed R Module, P = changed Parameters, D = changed Data)
-       [(Partial) Autocorrelation Function] [] [2014-03-17 22:12:28] [e610340e7a3184c9e0a1f377a12e8a83] [Current]
Feedback Forum

Post a new message
Dataseries X:
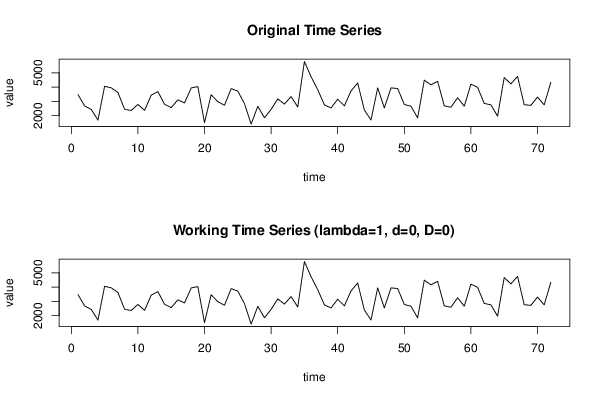
3477
2685
2438
1692
4054
3946
3623
2455
2362
2791
2369
3438
3682
2801
2563
3108
2890
3940
4036
1514
3461
2980
2728
3891
3715
2843
1416
2657
1856
2441
3172
2813
3335
2608
5784
4726
3817
2755
2541
3154
2684
3732
4286
2394
1698
3945
2549
3943
3899
2783
2660
1848
4482
4157
4404
2686
2593
3254
2664
4203
3985
2861
2758
1968
4666
4226
4748
2767
2723
3297
2758
4338


Summary of computational transaction
Raw Inputview raw input (R code)
Raw Outputview raw output of R engine
Computing time4 seconds
R Server'Gertrude Mary Cox' @ cox.wessa.net

\begin{tabular}{lllllllll}
\hline
Summary of computational transaction \tabularnewline
Raw Input & view raw input (R code)  \tabularnewline
Raw Output & view raw output of R engine  \tabularnewline
Computing time & 4 seconds \tabularnewline
R Server & 'Gertrude Mary Cox' @ cox.wessa.net \tabularnewline
\hline
\end{tabular}
%Source: https://freestatistics.org/blog/index.php?pk=234335&T=0

[TABLE]
[ROW][C]Summary of computational transaction[/C][/ROW]
[ROW][C]Raw Input[/C][C]view raw input (R code) [/C][/ROW]
[ROW][C]Raw Output[/C][C]view raw output of R engine [/C][/ROW]
[ROW][C]Computing time[/C][C]4 seconds[/C][/ROW]
[ROW][C]R Server[/C][C]'Gertrude Mary Cox' @ cox.wessa.net[/C][/ROW]
[/TABLE]
Source: https://freestatistics.org/blog/index.php?pk=234335&T=0

Globally Unique Identifier (entire table): ba.freestatistics.org/blog/index.php?pk=234335&T=0

As an alternative you can also use a QR Code:  

The GUIDs for individual cells are displayed in the table below:

Summary of computational transaction
Raw Inputview raw input (R code)
Raw Outputview raw output of R engine
Computing time4 seconds
R Server'Gertrude Mary Cox' @ cox.wessa.net


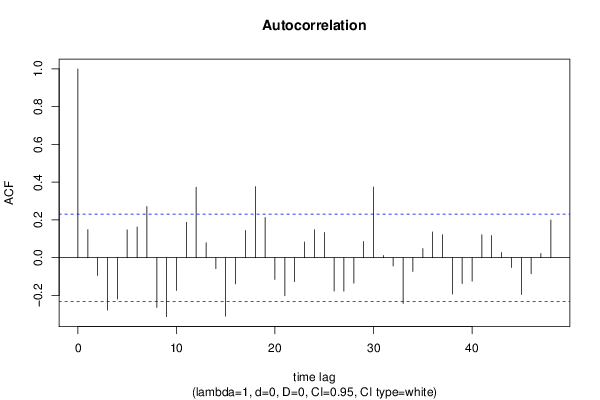
Autocorrelation Function
Time lag kACF(k)T-STATP-value
10.1488041.26260.105396
2-0.094478-0.80170.212691
3-0.277848-2.35760.010557
4-0.219403-1.86170.033363
50.1473031.24990.10769
60.1623461.37750.086305
70.2704742.29510.012323
8-0.263161-2.2330.014329
9-0.312388-2.65070.004935
10-0.174327-1.47920.071722
110.1870141.58690.058462
120.3729483.16460.001138
130.0793710.67350.251398
14-0.058195-0.49380.311474
15-0.309834-2.6290.005231
16-0.138628-1.17630.121676
170.1440971.22270.112714
180.3765533.19520.001038
190.2126851.80470.037652
20-0.115129-0.97690.165944
21-0.201366-1.70860.045912
22-0.126683-1.07490.142994
230.0828670.70320.242115
240.1476711.2530.107125
250.1331211.12960.131204
26-0.177031-1.50220.068714
27-0.177354-1.50490.068362
28-0.134995-1.14550.127904
290.085630.72660.234914
300.3747483.17980.001087
310.011320.09610.461872
32-0.043638-0.37030.356129
33-0.242402-2.05690.021662
34-0.072764-0.61740.269453
350.0481680.40870.341981
360.1364051.15740.125461
370.1211831.02830.153633
38-0.19218-1.63070.05366
39-0.137184-1.1640.124125
40-0.124262-1.05440.147613
410.1212271.02860.153545
420.1173960.99610.16126
430.0277380.23540.407297
44-0.052296-0.44370.32928
45-0.195336-1.65750.050887
46-0.085045-0.72160.236429
470.0223810.18990.424958
480.1998051.69540.04716

\begin{tabular}{lllllllll}
\hline
Autocorrelation Function \tabularnewline
Time lag k & ACF(k) & T-STAT & P-value \tabularnewline
1 & 0.148804 & 1.2626 & 0.105396 \tabularnewline
2 & -0.094478 & -0.8017 & 0.212691 \tabularnewline
3 & -0.277848 & -2.3576 & 0.010557 \tabularnewline
4 & -0.219403 & -1.8617 & 0.033363 \tabularnewline
5 & 0.147303 & 1.2499 & 0.10769 \tabularnewline
6 & 0.162346 & 1.3775 & 0.086305 \tabularnewline
7 & 0.270474 & 2.2951 & 0.012323 \tabularnewline
8 & -0.263161 & -2.233 & 0.014329 \tabularnewline
9 & -0.312388 & -2.6507 & 0.004935 \tabularnewline
10 & -0.174327 & -1.4792 & 0.071722 \tabularnewline
11 & 0.187014 & 1.5869 & 0.058462 \tabularnewline
12 & 0.372948 & 3.1646 & 0.001138 \tabularnewline
13 & 0.079371 & 0.6735 & 0.251398 \tabularnewline
14 & -0.058195 & -0.4938 & 0.311474 \tabularnewline
15 & -0.309834 & -2.629 & 0.005231 \tabularnewline
16 & -0.138628 & -1.1763 & 0.121676 \tabularnewline
17 & 0.144097 & 1.2227 & 0.112714 \tabularnewline
18 & 0.376553 & 3.1952 & 0.001038 \tabularnewline
19 & 0.212685 & 1.8047 & 0.037652 \tabularnewline
20 & -0.115129 & -0.9769 & 0.165944 \tabularnewline
21 & -0.201366 & -1.7086 & 0.045912 \tabularnewline
22 & -0.126683 & -1.0749 & 0.142994 \tabularnewline
23 & 0.082867 & 0.7032 & 0.242115 \tabularnewline
24 & 0.147671 & 1.253 & 0.107125 \tabularnewline
25 & 0.133121 & 1.1296 & 0.131204 \tabularnewline
26 & -0.177031 & -1.5022 & 0.068714 \tabularnewline
27 & -0.177354 & -1.5049 & 0.068362 \tabularnewline
28 & -0.134995 & -1.1455 & 0.127904 \tabularnewline
29 & 0.08563 & 0.7266 & 0.234914 \tabularnewline
30 & 0.374748 & 3.1798 & 0.001087 \tabularnewline
31 & 0.01132 & 0.0961 & 0.461872 \tabularnewline
32 & -0.043638 & -0.3703 & 0.356129 \tabularnewline
33 & -0.242402 & -2.0569 & 0.021662 \tabularnewline
34 & -0.072764 & -0.6174 & 0.269453 \tabularnewline
35 & 0.048168 & 0.4087 & 0.341981 \tabularnewline
36 & 0.136405 & 1.1574 & 0.125461 \tabularnewline
37 & 0.121183 & 1.0283 & 0.153633 \tabularnewline
38 & -0.19218 & -1.6307 & 0.05366 \tabularnewline
39 & -0.137184 & -1.164 & 0.124125 \tabularnewline
40 & -0.124262 & -1.0544 & 0.147613 \tabularnewline
41 & 0.121227 & 1.0286 & 0.153545 \tabularnewline
42 & 0.117396 & 0.9961 & 0.16126 \tabularnewline
43 & 0.027738 & 0.2354 & 0.407297 \tabularnewline
44 & -0.052296 & -0.4437 & 0.32928 \tabularnewline
45 & -0.195336 & -1.6575 & 0.050887 \tabularnewline
46 & -0.085045 & -0.7216 & 0.236429 \tabularnewline
47 & 0.022381 & 0.1899 & 0.424958 \tabularnewline
48 & 0.199805 & 1.6954 & 0.04716 \tabularnewline
\hline
\end{tabular}
%Source: https://freestatistics.org/blog/index.php?pk=234335&T=1

[TABLE]
[ROW][C]Autocorrelation Function[/C][/ROW]
[ROW][C]Time lag k[/C][C]ACF(k)[/C][C]T-STAT[/C][C]P-value[/C][/ROW]
[ROW][C]1[/C][C]0.148804[/C][C]1.2626[/C][C]0.105396[/C][/ROW]
[ROW][C]2[/C][C]-0.094478[/C][C]-0.8017[/C][C]0.212691[/C][/ROW]
[ROW][C]3[/C][C]-0.277848[/C][C]-2.3576[/C][C]0.010557[/C][/ROW]
[ROW][C]4[/C][C]-0.219403[/C][C]-1.8617[/C][C]0.033363[/C][/ROW]
[ROW][C]5[/C][C]0.147303[/C][C]1.2499[/C][C]0.10769[/C][/ROW]
[ROW][C]6[/C][C]0.162346[/C][C]1.3775[/C][C]0.086305[/C][/ROW]
[ROW][C]7[/C][C]0.270474[/C][C]2.2951[/C][C]0.012323[/C][/ROW]
[ROW][C]8[/C][C]-0.263161[/C][C]-2.233[/C][C]0.014329[/C][/ROW]
[ROW][C]9[/C][C]-0.312388[/C][C]-2.6507[/C][C]0.004935[/C][/ROW]
[ROW][C]10[/C][C]-0.174327[/C][C]-1.4792[/C][C]0.071722[/C][/ROW]
[ROW][C]11[/C][C]0.187014[/C][C]1.5869[/C][C]0.058462[/C][/ROW]
[ROW][C]12[/C][C]0.372948[/C][C]3.1646[/C][C]0.001138[/C][/ROW]
[ROW][C]13[/C][C]0.079371[/C][C]0.6735[/C][C]0.251398[/C][/ROW]
[ROW][C]14[/C][C]-0.058195[/C][C]-0.4938[/C][C]0.311474[/C][/ROW]
[ROW][C]15[/C][C]-0.309834[/C][C]-2.629[/C][C]0.005231[/C][/ROW]
[ROW][C]16[/C][C]-0.138628[/C][C]-1.1763[/C][C]0.121676[/C][/ROW]
[ROW][C]17[/C][C]0.144097[/C][C]1.2227[/C][C]0.112714[/C][/ROW]
[ROW][C]18[/C][C]0.376553[/C][C]3.1952[/C][C]0.001038[/C][/ROW]
[ROW][C]19[/C][C]0.212685[/C][C]1.8047[/C][C]0.037652[/C][/ROW]
[ROW][C]20[/C][C]-0.115129[/C][C]-0.9769[/C][C]0.165944[/C][/ROW]
[ROW][C]21[/C][C]-0.201366[/C][C]-1.7086[/C][C]0.045912[/C][/ROW]
[ROW][C]22[/C][C]-0.126683[/C][C]-1.0749[/C][C]0.142994[/C][/ROW]
[ROW][C]23[/C][C]0.082867[/C][C]0.7032[/C][C]0.242115[/C][/ROW]
[ROW][C]24[/C][C]0.147671[/C][C]1.253[/C][C]0.107125[/C][/ROW]
[ROW][C]25[/C][C]0.133121[/C][C]1.1296[/C][C]0.131204[/C][/ROW]
[ROW][C]26[/C][C]-0.177031[/C][C]-1.5022[/C][C]0.068714[/C][/ROW]
[ROW][C]27[/C][C]-0.177354[/C][C]-1.5049[/C][C]0.068362[/C][/ROW]
[ROW][C]28[/C][C]-0.134995[/C][C]-1.1455[/C][C]0.127904[/C][/ROW]
[ROW][C]29[/C][C]0.08563[/C][C]0.7266[/C][C]0.234914[/C][/ROW]
[ROW][C]30[/C][C]0.374748[/C][C]3.1798[/C][C]0.001087[/C][/ROW]
[ROW][C]31[/C][C]0.01132[/C][C]0.0961[/C][C]0.461872[/C][/ROW]
[ROW][C]32[/C][C]-0.043638[/C][C]-0.3703[/C][C]0.356129[/C][/ROW]
[ROW][C]33[/C][C]-0.242402[/C][C]-2.0569[/C][C]0.021662[/C][/ROW]
[ROW][C]34[/C][C]-0.072764[/C][C]-0.6174[/C][C]0.269453[/C][/ROW]
[ROW][C]35[/C][C]0.048168[/C][C]0.4087[/C][C]0.341981[/C][/ROW]
[ROW][C]36[/C][C]0.136405[/C][C]1.1574[/C][C]0.125461[/C][/ROW]
[ROW][C]37[/C][C]0.121183[/C][C]1.0283[/C][C]0.153633[/C][/ROW]
[ROW][C]38[/C][C]-0.19218[/C][C]-1.6307[/C][C]0.05366[/C][/ROW]
[ROW][C]39[/C][C]-0.137184[/C][C]-1.164[/C][C]0.124125[/C][/ROW]
[ROW][C]40[/C][C]-0.124262[/C][C]-1.0544[/C][C]0.147613[/C][/ROW]
[ROW][C]41[/C][C]0.121227[/C][C]1.0286[/C][C]0.153545[/C][/ROW]
[ROW][C]42[/C][C]0.117396[/C][C]0.9961[/C][C]0.16126[/C][/ROW]
[ROW][C]43[/C][C]0.027738[/C][C]0.2354[/C][C]0.407297[/C][/ROW]
[ROW][C]44[/C][C]-0.052296[/C][C]-0.4437[/C][C]0.32928[/C][/ROW]
[ROW][C]45[/C][C]-0.195336[/C][C]-1.6575[/C][C]0.050887[/C][/ROW]
[ROW][C]46[/C][C]-0.085045[/C][C]-0.7216[/C][C]0.236429[/C][/ROW]
[ROW][C]47[/C][C]0.022381[/C][C]0.1899[/C][C]0.424958[/C][/ROW]
[ROW][C]48[/C][C]0.199805[/C][C]1.6954[/C][C]0.04716[/C][/ROW]
[/TABLE]
Source: https://freestatistics.org/blog/index.php?pk=234335&T=1

Globally Unique Identifier (entire table): ba.freestatistics.org/blog/index.php?pk=234335&T=1

As an alternative you can also use a QR Code:  

The GUIDs for individual cells are displayed in the table below:

Autocorrelation Function
Time lag kACF(k)T-STATP-value
10.1488041.26260.105396
2-0.094478-0.80170.212691
3-0.277848-2.35760.010557
4-0.219403-1.86170.033363
50.1473031.24990.10769
60.1623461.37750.086305
70.2704742.29510.012323
8-0.263161-2.2330.014329
9-0.312388-2.65070.004935
10-0.174327-1.47920.071722
110.1870141.58690.058462
120.3729483.16460.001138
130.0793710.67350.251398
14-0.058195-0.49380.311474
15-0.309834-2.6290.005231
16-0.138628-1.17630.121676
170.1440971.22270.112714
180.3765533.19520.001038
190.2126851.80470.037652
20-0.115129-0.97690.165944
21-0.201366-1.70860.045912
22-0.126683-1.07490.142994
230.0828670.70320.242115
240.1476711.2530.107125
250.1331211.12960.131204
26-0.177031-1.50220.068714
27-0.177354-1.50490.068362
28-0.134995-1.14550.127904
290.085630.72660.234914
300.3747483.17980.001087
310.011320.09610.461872
32-0.043638-0.37030.356129
33-0.242402-2.05690.021662
34-0.072764-0.61740.269453
350.0481680.40870.341981
360.1364051.15740.125461
370.1211831.02830.153633
38-0.19218-1.63070.05366
39-0.137184-1.1640.124125
40-0.124262-1.05440.147613
410.1212271.02860.153545
420.1173960.99610.16126
430.0277380.23540.407297
44-0.052296-0.44370.32928
45-0.195336-1.65750.050887
46-0.085045-0.72160.236429
470.0223810.18990.424958
480.1998051.69540.04716


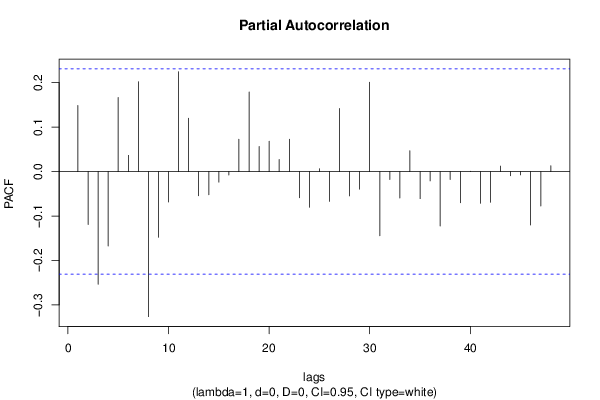
Partial Autocorrelation Function
Time lag kPACF(k)T-STATP-value
10.1488041.26260.105396
2-0.119261-1.0120.157472
3-0.253505-2.15110.017414
4-0.167499-1.42130.079777
50.1665761.41340.080918
60.0364740.30950.378922
70.2023321.71680.045154
8-0.326418-2.76970.003566
9-0.147828-1.25440.106884
10-0.068552-0.58170.281298
110.2246591.90630.030302
120.1200661.01880.155856
13-0.054533-0.46270.322477
14-0.052122-0.44230.32981
15-0.023733-0.20140.420484
16-0.007748-0.06570.473882
170.0727380.61720.269525
180.1790231.51910.066563
190.0564330.47880.31675
200.0683670.58010.281826
210.0271860.23070.40911
220.0727820.61760.269401
23-0.058987-0.50050.309118
24-0.080132-0.67990.249359
250.0062870.05330.478802
26-0.067007-0.56860.285708
270.1418461.20360.116343
28-0.054604-0.46330.322262
29-0.039403-0.33430.369547
300.2010831.70620.046137
31-0.144537-1.22640.112015
32-0.017904-0.15190.439839
33-0.059308-0.50320.308163
340.0468270.39730.346146
35-0.060841-0.51630.30363
36-0.020993-0.17810.429559
37-0.122594-1.04020.150854
38-0.017629-0.14960.440754
39-0.070224-0.59590.276564
400.0005380.00460.498186
41-0.071068-0.6030.27419
42-0.069159-0.58680.279575
430.012340.10470.458448
44-0.009505-0.08070.467972
45-0.007481-0.06350.47478
46-0.120113-1.01920.155761
47-0.077282-0.65580.257035
480.013170.11180.455665

\begin{tabular}{lllllllll}
\hline
Partial Autocorrelation Function \tabularnewline
Time lag k & PACF(k) & T-STAT & P-value \tabularnewline
1 & 0.148804 & 1.2626 & 0.105396 \tabularnewline
2 & -0.119261 & -1.012 & 0.157472 \tabularnewline
3 & -0.253505 & -2.1511 & 0.017414 \tabularnewline
4 & -0.167499 & -1.4213 & 0.079777 \tabularnewline
5 & 0.166576 & 1.4134 & 0.080918 \tabularnewline
6 & 0.036474 & 0.3095 & 0.378922 \tabularnewline
7 & 0.202332 & 1.7168 & 0.045154 \tabularnewline
8 & -0.326418 & -2.7697 & 0.003566 \tabularnewline
9 & -0.147828 & -1.2544 & 0.106884 \tabularnewline
10 & -0.068552 & -0.5817 & 0.281298 \tabularnewline
11 & 0.224659 & 1.9063 & 0.030302 \tabularnewline
12 & 0.120066 & 1.0188 & 0.155856 \tabularnewline
13 & -0.054533 & -0.4627 & 0.322477 \tabularnewline
14 & -0.052122 & -0.4423 & 0.32981 \tabularnewline
15 & -0.023733 & -0.2014 & 0.420484 \tabularnewline
16 & -0.007748 & -0.0657 & 0.473882 \tabularnewline
17 & 0.072738 & 0.6172 & 0.269525 \tabularnewline
18 & 0.179023 & 1.5191 & 0.066563 \tabularnewline
19 & 0.056433 & 0.4788 & 0.31675 \tabularnewline
20 & 0.068367 & 0.5801 & 0.281826 \tabularnewline
21 & 0.027186 & 0.2307 & 0.40911 \tabularnewline
22 & 0.072782 & 0.6176 & 0.269401 \tabularnewline
23 & -0.058987 & -0.5005 & 0.309118 \tabularnewline
24 & -0.080132 & -0.6799 & 0.249359 \tabularnewline
25 & 0.006287 & 0.0533 & 0.478802 \tabularnewline
26 & -0.067007 & -0.5686 & 0.285708 \tabularnewline
27 & 0.141846 & 1.2036 & 0.116343 \tabularnewline
28 & -0.054604 & -0.4633 & 0.322262 \tabularnewline
29 & -0.039403 & -0.3343 & 0.369547 \tabularnewline
30 & 0.201083 & 1.7062 & 0.046137 \tabularnewline
31 & -0.144537 & -1.2264 & 0.112015 \tabularnewline
32 & -0.017904 & -0.1519 & 0.439839 \tabularnewline
33 & -0.059308 & -0.5032 & 0.308163 \tabularnewline
34 & 0.046827 & 0.3973 & 0.346146 \tabularnewline
35 & -0.060841 & -0.5163 & 0.30363 \tabularnewline
36 & -0.020993 & -0.1781 & 0.429559 \tabularnewline
37 & -0.122594 & -1.0402 & 0.150854 \tabularnewline
38 & -0.017629 & -0.1496 & 0.440754 \tabularnewline
39 & -0.070224 & -0.5959 & 0.276564 \tabularnewline
40 & 0.000538 & 0.0046 & 0.498186 \tabularnewline
41 & -0.071068 & -0.603 & 0.27419 \tabularnewline
42 & -0.069159 & -0.5868 & 0.279575 \tabularnewline
43 & 0.01234 & 0.1047 & 0.458448 \tabularnewline
44 & -0.009505 & -0.0807 & 0.467972 \tabularnewline
45 & -0.007481 & -0.0635 & 0.47478 \tabularnewline
46 & -0.120113 & -1.0192 & 0.155761 \tabularnewline
47 & -0.077282 & -0.6558 & 0.257035 \tabularnewline
48 & 0.01317 & 0.1118 & 0.455665 \tabularnewline
\hline
\end{tabular}
%Source: https://freestatistics.org/blog/index.php?pk=234335&T=2

[TABLE]
[ROW][C]Partial Autocorrelation Function[/C][/ROW]
[ROW][C]Time lag k[/C][C]PACF(k)[/C][C]T-STAT[/C][C]P-value[/C][/ROW]
[ROW][C]1[/C][C]0.148804[/C][C]1.2626[/C][C]0.105396[/C][/ROW]
[ROW][C]2[/C][C]-0.119261[/C][C]-1.012[/C][C]0.157472[/C][/ROW]
[ROW][C]3[/C][C]-0.253505[/C][C]-2.1511[/C][C]0.017414[/C][/ROW]
[ROW][C]4[/C][C]-0.167499[/C][C]-1.4213[/C][C]0.079777[/C][/ROW]
[ROW][C]5[/C][C]0.166576[/C][C]1.4134[/C][C]0.080918[/C][/ROW]
[ROW][C]6[/C][C]0.036474[/C][C]0.3095[/C][C]0.378922[/C][/ROW]
[ROW][C]7[/C][C]0.202332[/C][C]1.7168[/C][C]0.045154[/C][/ROW]
[ROW][C]8[/C][C]-0.326418[/C][C]-2.7697[/C][C]0.003566[/C][/ROW]
[ROW][C]9[/C][C]-0.147828[/C][C]-1.2544[/C][C]0.106884[/C][/ROW]
[ROW][C]10[/C][C]-0.068552[/C][C]-0.5817[/C][C]0.281298[/C][/ROW]
[ROW][C]11[/C][C]0.224659[/C][C]1.9063[/C][C]0.030302[/C][/ROW]
[ROW][C]12[/C][C]0.120066[/C][C]1.0188[/C][C]0.155856[/C][/ROW]
[ROW][C]13[/C][C]-0.054533[/C][C]-0.4627[/C][C]0.322477[/C][/ROW]
[ROW][C]14[/C][C]-0.052122[/C][C]-0.4423[/C][C]0.32981[/C][/ROW]
[ROW][C]15[/C][C]-0.023733[/C][C]-0.2014[/C][C]0.420484[/C][/ROW]
[ROW][C]16[/C][C]-0.007748[/C][C]-0.0657[/C][C]0.473882[/C][/ROW]
[ROW][C]17[/C][C]0.072738[/C][C]0.6172[/C][C]0.269525[/C][/ROW]
[ROW][C]18[/C][C]0.179023[/C][C]1.5191[/C][C]0.066563[/C][/ROW]
[ROW][C]19[/C][C]0.056433[/C][C]0.4788[/C][C]0.31675[/C][/ROW]
[ROW][C]20[/C][C]0.068367[/C][C]0.5801[/C][C]0.281826[/C][/ROW]
[ROW][C]21[/C][C]0.027186[/C][C]0.2307[/C][C]0.40911[/C][/ROW]
[ROW][C]22[/C][C]0.072782[/C][C]0.6176[/C][C]0.269401[/C][/ROW]
[ROW][C]23[/C][C]-0.058987[/C][C]-0.5005[/C][C]0.309118[/C][/ROW]
[ROW][C]24[/C][C]-0.080132[/C][C]-0.6799[/C][C]0.249359[/C][/ROW]
[ROW][C]25[/C][C]0.006287[/C][C]0.0533[/C][C]0.478802[/C][/ROW]
[ROW][C]26[/C][C]-0.067007[/C][C]-0.5686[/C][C]0.285708[/C][/ROW]
[ROW][C]27[/C][C]0.141846[/C][C]1.2036[/C][C]0.116343[/C][/ROW]
[ROW][C]28[/C][C]-0.054604[/C][C]-0.4633[/C][C]0.322262[/C][/ROW]
[ROW][C]29[/C][C]-0.039403[/C][C]-0.3343[/C][C]0.369547[/C][/ROW]
[ROW][C]30[/C][C]0.201083[/C][C]1.7062[/C][C]0.046137[/C][/ROW]
[ROW][C]31[/C][C]-0.144537[/C][C]-1.2264[/C][C]0.112015[/C][/ROW]
[ROW][C]32[/C][C]-0.017904[/C][C]-0.1519[/C][C]0.439839[/C][/ROW]
[ROW][C]33[/C][C]-0.059308[/C][C]-0.5032[/C][C]0.308163[/C][/ROW]
[ROW][C]34[/C][C]0.046827[/C][C]0.3973[/C][C]0.346146[/C][/ROW]
[ROW][C]35[/C][C]-0.060841[/C][C]-0.5163[/C][C]0.30363[/C][/ROW]
[ROW][C]36[/C][C]-0.020993[/C][C]-0.1781[/C][C]0.429559[/C][/ROW]
[ROW][C]37[/C][C]-0.122594[/C][C]-1.0402[/C][C]0.150854[/C][/ROW]
[ROW][C]38[/C][C]-0.017629[/C][C]-0.1496[/C][C]0.440754[/C][/ROW]
[ROW][C]39[/C][C]-0.070224[/C][C]-0.5959[/C][C]0.276564[/C][/ROW]
[ROW][C]40[/C][C]0.000538[/C][C]0.0046[/C][C]0.498186[/C][/ROW]
[ROW][C]41[/C][C]-0.071068[/C][C]-0.603[/C][C]0.27419[/C][/ROW]
[ROW][C]42[/C][C]-0.069159[/C][C]-0.5868[/C][C]0.279575[/C][/ROW]
[ROW][C]43[/C][C]0.01234[/C][C]0.1047[/C][C]0.458448[/C][/ROW]
[ROW][C]44[/C][C]-0.009505[/C][C]-0.0807[/C][C]0.467972[/C][/ROW]
[ROW][C]45[/C][C]-0.007481[/C][C]-0.0635[/C][C]0.47478[/C][/ROW]
[ROW][C]46[/C][C]-0.120113[/C][C]-1.0192[/C][C]0.155761[/C][/ROW]
[ROW][C]47[/C][C]-0.077282[/C][C]-0.6558[/C][C]0.257035[/C][/ROW]
[ROW][C]48[/C][C]0.01317[/C][C]0.1118[/C][C]0.455665[/C][/ROW]
[/TABLE]
Source: https://freestatistics.org/blog/index.php?pk=234335&T=2

Globally Unique Identifier (entire table): ba.freestatistics.org/blog/index.php?pk=234335&T=2

As an alternative you can also use a QR Code:  

The GUIDs for individual cells are displayed in the table below:

Partial Autocorrelation Function
Time lag kPACF(k)T-STATP-value
10.1488041.26260.105396
2-0.119261-1.0120.157472
3-0.253505-2.15110.017414
4-0.167499-1.42130.079777
50.1665761.41340.080918
60.0364740.30950.378922
70.2023321.71680.045154
8-0.326418-2.76970.003566
9-0.147828-1.25440.106884
10-0.068552-0.58170.281298
110.2246591.90630.030302
120.1200661.01880.155856
13-0.054533-0.46270.322477
14-0.052122-0.44230.32981
15-0.023733-0.20140.420484
16-0.007748-0.06570.473882
170.0727380.61720.269525
180.1790231.51910.066563
190.0564330.47880.31675
200.0683670.58010.281826
210.0271860.23070.40911
220.0727820.61760.269401
23-0.058987-0.50050.309118
24-0.080132-0.67990.249359
250.0062870.05330.478802
26-0.067007-0.56860.285708
270.1418461.20360.116343
28-0.054604-0.46330.322262
29-0.039403-0.33430.369547
300.2010831.70620.046137
31-0.144537-1.22640.112015
32-0.017904-0.15190.439839
33-0.059308-0.50320.308163
340.0468270.39730.346146
35-0.060841-0.51630.30363
36-0.020993-0.17810.429559
37-0.122594-1.04020.150854
38-0.017629-0.14960.440754
39-0.070224-0.59590.276564
400.0005380.00460.498186
41-0.071068-0.6030.27419
42-0.069159-0.58680.279575
430.012340.10470.458448
44-0.009505-0.08070.467972
45-0.007481-0.06350.47478
46-0.120113-1.01920.155761
47-0.077282-0.65580.257035
480.013170.11180.455665


Parameters (Session):
par1 = 48 ; par2 = 1 ; par3 = 0 ; par4 = 0 ; par5 = 12 ; par6 = White Noise ; par7 = 0.95 ;
Parameters (R input):
par1 = 48 ; par2 = 1 ; par3 = 0 ; par4 = 0 ; par5 = 12 ; par6 = White Noise ; par7 = 0.95 ; par8 = ;
R code (references can be found in the software module):
if (par1 == 'Default') {
par1 = 10*log10(length(x))
} else {
par1 <- as.numeric(par1)
}
par2 <- as.numeric(par2)
par3 <- as.numeric(par3)
par4 <- as.numeric(par4)
par5 <- as.numeric(par5)
if (par6 == 'White Noise') par6 <- 'white' else par6 <- 'ma'
par7 <- as.numeric(par7)
if (par8 != '') par8 <- as.numeric(par8)
ox <- x
if (par8 == '') {
if (par2 == 0) {
x <- log(x)
} else {
x <- (x ^ par2 - 1) / par2
}
} else {
x <- log(x,base=par8)
}
if (par3 > 0) x <- diff(x,lag=1,difference=par3)
if (par4 > 0) x <- diff(x,lag=par5,difference=par4)
bitmap(file='picts.png')
op <- par(mfrow=c(2,1))
plot(ox,type='l',main='Original Time Series',xlab='time',ylab='value')
if (par8=='') {
mytitle <- paste('Working Time Series (lambda=',par2,', d=',par3,', D=',par4,')',sep='')
mysub <- paste('(lambda=',par2,', d=',par3,', D=',par4,', CI=', par7, ', CI type=',par6,')',sep='')
} else {
mytitle <- paste('Working Time Series (base=',par8,', d=',par3,', D=',par4,')',sep='')
mysub <- paste('(base=',par8,', d=',par3,', D=',par4,', CI=', par7, ', CI type=',par6,')',sep='')
}
plot(x,type='l', main=mytitle,xlab='time',ylab='value')
par(op)
dev.off()
bitmap(file='pic1.png')
racf <- acf(x, par1, main='Autocorrelation', xlab='time lag', ylab='ACF', ci.type=par6, ci=par7, sub=mysub)
dev.off()
bitmap(file='pic2.png')
rpacf <- pacf(x,par1,main='Partial Autocorrelation',xlab='lags',ylab='PACF',sub=mysub)
dev.off()
(myacf <- c(racf$acf))
(mypacf <- c(rpacf$acf))
lengthx <- length(x)
sqrtn <- sqrt(lengthx)
load(file='createtable')
a<-table.start()
a<-table.row.start(a)
a<-table.element(a,'Autocorrelation Function',4,TRUE)
a<-table.row.end(a)
a<-table.row.start(a)
a<-table.element(a,'Time lag k',header=TRUE)
a<-table.element(a,hyperlink('basics.htm','ACF(k)','click here for more information about the Autocorrelation Function'),header=TRUE)
a<-table.element(a,'T-STAT',header=TRUE)
a<-table.element(a,'P-value',header=TRUE)
a<-table.row.end(a)
for (i in 2:(par1+1)) {
a<-table.row.start(a)
a<-table.element(a,i-1,header=TRUE)
a<-table.element(a,round(myacf[i],6))
mytstat <- myacf[i]*sqrtn
a<-table.element(a,round(mytstat,4))
a<-table.element(a,round(1-pt(abs(mytstat),lengthx),6))
a<-table.row.end(a)
}
a<-table.end(a)
table.save(a,file='mytable.tab')
a<-table.start()
a<-table.row.start(a)
a<-table.element(a,'Partial Autocorrelation Function',4,TRUE)
a<-table.row.end(a)
a<-table.row.start(a)
a<-table.element(a,'Time lag k',header=TRUE)
a<-table.element(a,hyperlink('basics.htm','PACF(k)','click here for more information about the Partial Autocorrelation Function'),header=TRUE)
a<-table.element(a,'T-STAT',header=TRUE)
a<-table.element(a,'P-value',header=TRUE)
a<-table.row.end(a)
for (i in 1:par1) {
a<-table.row.start(a)
a<-table.element(a,i,header=TRUE)
a<-table.element(a,round(mypacf[i],6))
mytstat <- mypacf[i]*sqrtn
a<-table.element(a,round(mytstat,4))
a<-table.element(a,round(1-pt(abs(mytstat),lengthx),6))
a<-table.row.end(a)
}
a<-table.end(a)
table.save(a,file='mytable1.tab')