Free Statistics

of Irreproducible Research!

Author's title

Author*Unverified author*
R Software Modulerwasp_autocorrelation.wasp
Title produced by software(Partial) Autocorrelation Function
Date of computationMon, 17 Mar 2014 16:45:34 -0400
Cite this page as followsStatistical Computations at FreeStatistics.org, Office for Research Development and Education, URL https://freestatistics.org/blog/index.php?v=date/2014/Mar/17/t1395089227hgr9xfg1w4c9k9d.htm/, Retrieved Tue, 14 May 2024 06:08:28 +0000
Statistical Computations at FreeStatistics.org, Office for Research Development and Education, URL https://freestatistics.org/blog/index.php?pk=234328, Retrieved Tue, 14 May 2024 06:08:28 +0000
QR Codes:

Original text written by user:
IsPrivate?No (this computation is public)
User-defined keywords
Estimated Impact95
Family? (F = Feedback message, R = changed R code, M = changed R Module, P = changed Parameters, D = changed Data)
-       [(Partial) Autocorrelation Function] [] [2014-03-17 20:45:34] [9ad8640ee6bb68970a185fdc3cb1cac3] [Current]
Feedback Forum

Post a new message
Dataseries X:
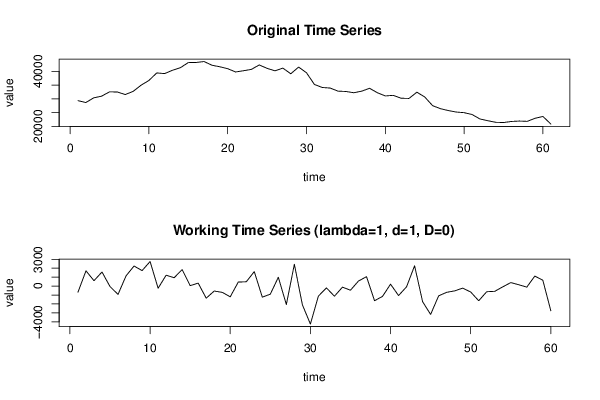
29358
28673
30383
30988
32565
32510
31584
32729
34977
36710
39457
39217
40435
41373
43221
43271
43605
42254
41702
41002
39804
40256
40740
42362
41126
40225
41216
39148
41591
39506
35261
34148
33947
32819
32700
32242
32810
33865
32226
31077
31293
30236
30160
32436
30695
27525
26434
25739
25204
24977
24320
22680
22052
21467
21383
21777
21928
21814
22937
23595
20830


Summary of computational transaction
Raw Inputview raw input (R code)
Raw Outputview raw output of R engine
Computing time3 seconds
R Server'Gwilym Jenkins' @ jenkins.wessa.net

\begin{tabular}{lllllllll}
\hline
Summary of computational transaction \tabularnewline
Raw Input & view raw input (R code)  \tabularnewline
Raw Output & view raw output of R engine  \tabularnewline
Computing time & 3 seconds \tabularnewline
R Server & 'Gwilym Jenkins' @ jenkins.wessa.net \tabularnewline
\hline
\end{tabular}
%Source: https://freestatistics.org/blog/index.php?pk=234328&T=0

[TABLE]
[ROW][C]Summary of computational transaction[/C][/ROW]
[ROW][C]Raw Input[/C][C]view raw input (R code) [/C][/ROW]
[ROW][C]Raw Output[/C][C]view raw output of R engine [/C][/ROW]
[ROW][C]Computing time[/C][C]3 seconds[/C][/ROW]
[ROW][C]R Server[/C][C]'Gwilym Jenkins' @ jenkins.wessa.net[/C][/ROW]
[/TABLE]
Source: https://freestatistics.org/blog/index.php?pk=234328&T=0

Globally Unique Identifier (entire table): ba.freestatistics.org/blog/index.php?pk=234328&T=0

As an alternative you can also use a QR Code:  

The GUIDs for individual cells are displayed in the table below:

Summary of computational transaction
Raw Inputview raw input (R code)
Raw Outputview raw output of R engine
Computing time3 seconds
R Server'Gwilym Jenkins' @ jenkins.wessa.net


Autocorrelation Function
Time lag kACF(k)T-STATP-value
10.1926041.49190.070482
20.041640.32250.374081
30.1573611.21890.113824
40.0159110.12320.451162
50.1585931.22850.112037
60.2332641.80690.0379
70.0112850.08740.465316
8-0.004194-0.03250.487097
90.0690380.53480.297393
10-0.017358-0.13450.446747
110.0400840.31050.378634
120.1065340.82520.20626
13-0.038433-0.29770.38348
140.1361431.05460.147927
150.1939931.50270.069086
16-0.018953-0.14680.441888
17-0.221698-1.71730.045544
180.0224230.17370.431349
19-0.010745-0.08320.466973
20-0.056035-0.4340.332905
210.0480090.37190.355647
22-0.090064-0.69760.244052
23-0.173809-1.34630.091632
240.0194830.15090.440275
25-0.121217-0.93890.175763
26-0.056416-0.4370.331842
270.0008760.00680.497305
28-0.106933-0.82830.205391
29-0.036578-0.28330.388949
300.0570420.44180.330094
31-0.074441-0.57660.283178
32-0.103037-0.79810.213975
330.0841030.65150.258618
34-0.056722-0.43940.330986
35-0.039224-0.30380.381154
36-0.086548-0.67040.252589
37-0.214978-1.66520.050542
38-0.111897-0.86680.194765
39-0.048527-0.37590.354163
40-0.017446-0.13510.446479
41-0.064049-0.49610.310812
42-0.09976-0.77270.221355
43-0.068857-0.53340.297877
44-0.024013-0.1860.426535
450.0228050.17660.430192
46-0.02039-0.15790.437518
47-0.021591-0.16720.433871
48-0.012999-0.10070.460066

\begin{tabular}{lllllllll}
\hline
Autocorrelation Function \tabularnewline
Time lag k & ACF(k) & T-STAT & P-value \tabularnewline
1 & 0.192604 & 1.4919 & 0.070482 \tabularnewline
2 & 0.04164 & 0.3225 & 0.374081 \tabularnewline
3 & 0.157361 & 1.2189 & 0.113824 \tabularnewline
4 & 0.015911 & 0.1232 & 0.451162 \tabularnewline
5 & 0.158593 & 1.2285 & 0.112037 \tabularnewline
6 & 0.233264 & 1.8069 & 0.0379 \tabularnewline
7 & 0.011285 & 0.0874 & 0.465316 \tabularnewline
8 & -0.004194 & -0.0325 & 0.487097 \tabularnewline
9 & 0.069038 & 0.5348 & 0.297393 \tabularnewline
10 & -0.017358 & -0.1345 & 0.446747 \tabularnewline
11 & 0.040084 & 0.3105 & 0.378634 \tabularnewline
12 & 0.106534 & 0.8252 & 0.20626 \tabularnewline
13 & -0.038433 & -0.2977 & 0.38348 \tabularnewline
14 & 0.136143 & 1.0546 & 0.147927 \tabularnewline
15 & 0.193993 & 1.5027 & 0.069086 \tabularnewline
16 & -0.018953 & -0.1468 & 0.441888 \tabularnewline
17 & -0.221698 & -1.7173 & 0.045544 \tabularnewline
18 & 0.022423 & 0.1737 & 0.431349 \tabularnewline
19 & -0.010745 & -0.0832 & 0.466973 \tabularnewline
20 & -0.056035 & -0.434 & 0.332905 \tabularnewline
21 & 0.048009 & 0.3719 & 0.355647 \tabularnewline
22 & -0.090064 & -0.6976 & 0.244052 \tabularnewline
23 & -0.173809 & -1.3463 & 0.091632 \tabularnewline
24 & 0.019483 & 0.1509 & 0.440275 \tabularnewline
25 & -0.121217 & -0.9389 & 0.175763 \tabularnewline
26 & -0.056416 & -0.437 & 0.331842 \tabularnewline
27 & 0.000876 & 0.0068 & 0.497305 \tabularnewline
28 & -0.106933 & -0.8283 & 0.205391 \tabularnewline
29 & -0.036578 & -0.2833 & 0.388949 \tabularnewline
30 & 0.057042 & 0.4418 & 0.330094 \tabularnewline
31 & -0.074441 & -0.5766 & 0.283178 \tabularnewline
32 & -0.103037 & -0.7981 & 0.213975 \tabularnewline
33 & 0.084103 & 0.6515 & 0.258618 \tabularnewline
34 & -0.056722 & -0.4394 & 0.330986 \tabularnewline
35 & -0.039224 & -0.3038 & 0.381154 \tabularnewline
36 & -0.086548 & -0.6704 & 0.252589 \tabularnewline
37 & -0.214978 & -1.6652 & 0.050542 \tabularnewline
38 & -0.111897 & -0.8668 & 0.194765 \tabularnewline
39 & -0.048527 & -0.3759 & 0.354163 \tabularnewline
40 & -0.017446 & -0.1351 & 0.446479 \tabularnewline
41 & -0.064049 & -0.4961 & 0.310812 \tabularnewline
42 & -0.09976 & -0.7727 & 0.221355 \tabularnewline
43 & -0.068857 & -0.5334 & 0.297877 \tabularnewline
44 & -0.024013 & -0.186 & 0.426535 \tabularnewline
45 & 0.022805 & 0.1766 & 0.430192 \tabularnewline
46 & -0.02039 & -0.1579 & 0.437518 \tabularnewline
47 & -0.021591 & -0.1672 & 0.433871 \tabularnewline
48 & -0.012999 & -0.1007 & 0.460066 \tabularnewline
\hline
\end{tabular}
%Source: https://freestatistics.org/blog/index.php?pk=234328&T=1

[TABLE]
[ROW][C]Autocorrelation Function[/C][/ROW]
[ROW][C]Time lag k[/C][C]ACF(k)[/C][C]T-STAT[/C][C]P-value[/C][/ROW]
[ROW][C]1[/C][C]0.192604[/C][C]1.4919[/C][C]0.070482[/C][/ROW]
[ROW][C]2[/C][C]0.04164[/C][C]0.3225[/C][C]0.374081[/C][/ROW]
[ROW][C]3[/C][C]0.157361[/C][C]1.2189[/C][C]0.113824[/C][/ROW]
[ROW][C]4[/C][C]0.015911[/C][C]0.1232[/C][C]0.451162[/C][/ROW]
[ROW][C]5[/C][C]0.158593[/C][C]1.2285[/C][C]0.112037[/C][/ROW]
[ROW][C]6[/C][C]0.233264[/C][C]1.8069[/C][C]0.0379[/C][/ROW]
[ROW][C]7[/C][C]0.011285[/C][C]0.0874[/C][C]0.465316[/C][/ROW]
[ROW][C]8[/C][C]-0.004194[/C][C]-0.0325[/C][C]0.487097[/C][/ROW]
[ROW][C]9[/C][C]0.069038[/C][C]0.5348[/C][C]0.297393[/C][/ROW]
[ROW][C]10[/C][C]-0.017358[/C][C]-0.1345[/C][C]0.446747[/C][/ROW]
[ROW][C]11[/C][C]0.040084[/C][C]0.3105[/C][C]0.378634[/C][/ROW]
[ROW][C]12[/C][C]0.106534[/C][C]0.8252[/C][C]0.20626[/C][/ROW]
[ROW][C]13[/C][C]-0.038433[/C][C]-0.2977[/C][C]0.38348[/C][/ROW]
[ROW][C]14[/C][C]0.136143[/C][C]1.0546[/C][C]0.147927[/C][/ROW]
[ROW][C]15[/C][C]0.193993[/C][C]1.5027[/C][C]0.069086[/C][/ROW]
[ROW][C]16[/C][C]-0.018953[/C][C]-0.1468[/C][C]0.441888[/C][/ROW]
[ROW][C]17[/C][C]-0.221698[/C][C]-1.7173[/C][C]0.045544[/C][/ROW]
[ROW][C]18[/C][C]0.022423[/C][C]0.1737[/C][C]0.431349[/C][/ROW]
[ROW][C]19[/C][C]-0.010745[/C][C]-0.0832[/C][C]0.466973[/C][/ROW]
[ROW][C]20[/C][C]-0.056035[/C][C]-0.434[/C][C]0.332905[/C][/ROW]
[ROW][C]21[/C][C]0.048009[/C][C]0.3719[/C][C]0.355647[/C][/ROW]
[ROW][C]22[/C][C]-0.090064[/C][C]-0.6976[/C][C]0.244052[/C][/ROW]
[ROW][C]23[/C][C]-0.173809[/C][C]-1.3463[/C][C]0.091632[/C][/ROW]
[ROW][C]24[/C][C]0.019483[/C][C]0.1509[/C][C]0.440275[/C][/ROW]
[ROW][C]25[/C][C]-0.121217[/C][C]-0.9389[/C][C]0.175763[/C][/ROW]
[ROW][C]26[/C][C]-0.056416[/C][C]-0.437[/C][C]0.331842[/C][/ROW]
[ROW][C]27[/C][C]0.000876[/C][C]0.0068[/C][C]0.497305[/C][/ROW]
[ROW][C]28[/C][C]-0.106933[/C][C]-0.8283[/C][C]0.205391[/C][/ROW]
[ROW][C]29[/C][C]-0.036578[/C][C]-0.2833[/C][C]0.388949[/C][/ROW]
[ROW][C]30[/C][C]0.057042[/C][C]0.4418[/C][C]0.330094[/C][/ROW]
[ROW][C]31[/C][C]-0.074441[/C][C]-0.5766[/C][C]0.283178[/C][/ROW]
[ROW][C]32[/C][C]-0.103037[/C][C]-0.7981[/C][C]0.213975[/C][/ROW]
[ROW][C]33[/C][C]0.084103[/C][C]0.6515[/C][C]0.258618[/C][/ROW]
[ROW][C]34[/C][C]-0.056722[/C][C]-0.4394[/C][C]0.330986[/C][/ROW]
[ROW][C]35[/C][C]-0.039224[/C][C]-0.3038[/C][C]0.381154[/C][/ROW]
[ROW][C]36[/C][C]-0.086548[/C][C]-0.6704[/C][C]0.252589[/C][/ROW]
[ROW][C]37[/C][C]-0.214978[/C][C]-1.6652[/C][C]0.050542[/C][/ROW]
[ROW][C]38[/C][C]-0.111897[/C][C]-0.8668[/C][C]0.194765[/C][/ROW]
[ROW][C]39[/C][C]-0.048527[/C][C]-0.3759[/C][C]0.354163[/C][/ROW]
[ROW][C]40[/C][C]-0.017446[/C][C]-0.1351[/C][C]0.446479[/C][/ROW]
[ROW][C]41[/C][C]-0.064049[/C][C]-0.4961[/C][C]0.310812[/C][/ROW]
[ROW][C]42[/C][C]-0.09976[/C][C]-0.7727[/C][C]0.221355[/C][/ROW]
[ROW][C]43[/C][C]-0.068857[/C][C]-0.5334[/C][C]0.297877[/C][/ROW]
[ROW][C]44[/C][C]-0.024013[/C][C]-0.186[/C][C]0.426535[/C][/ROW]
[ROW][C]45[/C][C]0.022805[/C][C]0.1766[/C][C]0.430192[/C][/ROW]
[ROW][C]46[/C][C]-0.02039[/C][C]-0.1579[/C][C]0.437518[/C][/ROW]
[ROW][C]47[/C][C]-0.021591[/C][C]-0.1672[/C][C]0.433871[/C][/ROW]
[ROW][C]48[/C][C]-0.012999[/C][C]-0.1007[/C][C]0.460066[/C][/ROW]
[/TABLE]
Source: https://freestatistics.org/blog/index.php?pk=234328&T=1

Globally Unique Identifier (entire table): ba.freestatistics.org/blog/index.php?pk=234328&T=1

As an alternative you can also use a QR Code:  

The GUIDs for individual cells are displayed in the table below:

Autocorrelation Function
Time lag kACF(k)T-STATP-value
10.1926041.49190.070482
20.041640.32250.374081
30.1573611.21890.113824
40.0159110.12320.451162
50.1585931.22850.112037
60.2332641.80690.0379
70.0112850.08740.465316
8-0.004194-0.03250.487097
90.0690380.53480.297393
10-0.017358-0.13450.446747
110.0400840.31050.378634
120.1065340.82520.20626
13-0.038433-0.29770.38348
140.1361431.05460.147927
150.1939931.50270.069086
16-0.018953-0.14680.441888
17-0.221698-1.71730.045544
180.0224230.17370.431349
19-0.010745-0.08320.466973
20-0.056035-0.4340.332905
210.0480090.37190.355647
22-0.090064-0.69760.244052
23-0.173809-1.34630.091632
240.0194830.15090.440275
25-0.121217-0.93890.175763
26-0.056416-0.4370.331842
270.0008760.00680.497305
28-0.106933-0.82830.205391
29-0.036578-0.28330.388949
300.0570420.44180.330094
31-0.074441-0.57660.283178
32-0.103037-0.79810.213975
330.0841030.65150.258618
34-0.056722-0.43940.330986
35-0.039224-0.30380.381154
36-0.086548-0.67040.252589
37-0.214978-1.66520.050542
38-0.111897-0.86680.194765
39-0.048527-0.37590.354163
40-0.017446-0.13510.446479
41-0.064049-0.49610.310812
42-0.09976-0.77270.221355
43-0.068857-0.53340.297877
44-0.024013-0.1860.426535
450.0228050.17660.430192
46-0.02039-0.15790.437518
47-0.021591-0.16720.433871
48-0.012999-0.10070.460066


Partial Autocorrelation Function
Time lag kPACF(k)T-STATP-value
10.1926041.49190.070482
20.0047190.03660.485481
30.1541931.19440.118515
4-0.045537-0.35270.362766
50.1721861.33370.093664
60.1596261.23650.110553
7-0.057919-0.44860.327655
8-0.041491-0.32140.374516
90.0324090.2510.401322
10-0.042652-0.33040.371131
110.0006730.00520.497928
120.059890.46390.322198
13-0.043203-0.33470.369527
140.162931.2620.105907
150.1290660.99970.160725
16-0.056033-0.4340.332912
17-0.323439-2.50530.007483
180.0770610.59690.276406
19-0.014165-0.10970.456499
20-0.106378-0.8240.206602
21-0.005465-0.04230.483187
220.0431320.33410.369735
23-0.080265-0.62170.268236
240.0384430.29780.383449
25-0.115635-0.89570.186995
26-0.004087-0.03170.487426
27-0.039744-0.30790.379628
28-0.002127-0.01650.493456
290.0036670.02840.488717
300.0208340.16140.436169
310.0891770.69080.246189
32-0.02023-0.15670.438004
330.0862870.66840.253229
34-0.118597-0.91860.180979
350.0374490.29010.386378
36-0.20588-1.59470.058013
37-0.123411-0.95590.17147
38-0.05306-0.4110.341267
390.0256530.19870.421583
400.0511170.3960.346772
410.0322160.24950.401897
42-0.078461-0.60780.272821
430.0621370.48130.316022
44-0.017747-0.13750.445561
45-0.084313-0.65310.258098
46-0.024093-0.18660.426294
470.0219850.17030.432675
480.0192860.14940.440874

\begin{tabular}{lllllllll}
\hline
Partial Autocorrelation Function \tabularnewline
Time lag k & PACF(k) & T-STAT & P-value \tabularnewline
1 & 0.192604 & 1.4919 & 0.070482 \tabularnewline
2 & 0.004719 & 0.0366 & 0.485481 \tabularnewline
3 & 0.154193 & 1.1944 & 0.118515 \tabularnewline
4 & -0.045537 & -0.3527 & 0.362766 \tabularnewline
5 & 0.172186 & 1.3337 & 0.093664 \tabularnewline
6 & 0.159626 & 1.2365 & 0.110553 \tabularnewline
7 & -0.057919 & -0.4486 & 0.327655 \tabularnewline
8 & -0.041491 & -0.3214 & 0.374516 \tabularnewline
9 & 0.032409 & 0.251 & 0.401322 \tabularnewline
10 & -0.042652 & -0.3304 & 0.371131 \tabularnewline
11 & 0.000673 & 0.0052 & 0.497928 \tabularnewline
12 & 0.05989 & 0.4639 & 0.322198 \tabularnewline
13 & -0.043203 & -0.3347 & 0.369527 \tabularnewline
14 & 0.16293 & 1.262 & 0.105907 \tabularnewline
15 & 0.129066 & 0.9997 & 0.160725 \tabularnewline
16 & -0.056033 & -0.434 & 0.332912 \tabularnewline
17 & -0.323439 & -2.5053 & 0.007483 \tabularnewline
18 & 0.077061 & 0.5969 & 0.276406 \tabularnewline
19 & -0.014165 & -0.1097 & 0.456499 \tabularnewline
20 & -0.106378 & -0.824 & 0.206602 \tabularnewline
21 & -0.005465 & -0.0423 & 0.483187 \tabularnewline
22 & 0.043132 & 0.3341 & 0.369735 \tabularnewline
23 & -0.080265 & -0.6217 & 0.268236 \tabularnewline
24 & 0.038443 & 0.2978 & 0.383449 \tabularnewline
25 & -0.115635 & -0.8957 & 0.186995 \tabularnewline
26 & -0.004087 & -0.0317 & 0.487426 \tabularnewline
27 & -0.039744 & -0.3079 & 0.379628 \tabularnewline
28 & -0.002127 & -0.0165 & 0.493456 \tabularnewline
29 & 0.003667 & 0.0284 & 0.488717 \tabularnewline
30 & 0.020834 & 0.1614 & 0.436169 \tabularnewline
31 & 0.089177 & 0.6908 & 0.246189 \tabularnewline
32 & -0.02023 & -0.1567 & 0.438004 \tabularnewline
33 & 0.086287 & 0.6684 & 0.253229 \tabularnewline
34 & -0.118597 & -0.9186 & 0.180979 \tabularnewline
35 & 0.037449 & 0.2901 & 0.386378 \tabularnewline
36 & -0.20588 & -1.5947 & 0.058013 \tabularnewline
37 & -0.123411 & -0.9559 & 0.17147 \tabularnewline
38 & -0.05306 & -0.411 & 0.341267 \tabularnewline
39 & 0.025653 & 0.1987 & 0.421583 \tabularnewline
40 & 0.051117 & 0.396 & 0.346772 \tabularnewline
41 & 0.032216 & 0.2495 & 0.401897 \tabularnewline
42 & -0.078461 & -0.6078 & 0.272821 \tabularnewline
43 & 0.062137 & 0.4813 & 0.316022 \tabularnewline
44 & -0.017747 & -0.1375 & 0.445561 \tabularnewline
45 & -0.084313 & -0.6531 & 0.258098 \tabularnewline
46 & -0.024093 & -0.1866 & 0.426294 \tabularnewline
47 & 0.021985 & 0.1703 & 0.432675 \tabularnewline
48 & 0.019286 & 0.1494 & 0.440874 \tabularnewline
\hline
\end{tabular}
%Source: https://freestatistics.org/blog/index.php?pk=234328&T=2

[TABLE]
[ROW][C]Partial Autocorrelation Function[/C][/ROW]
[ROW][C]Time lag k[/C][C]PACF(k)[/C][C]T-STAT[/C][C]P-value[/C][/ROW]
[ROW][C]1[/C][C]0.192604[/C][C]1.4919[/C][C]0.070482[/C][/ROW]
[ROW][C]2[/C][C]0.004719[/C][C]0.0366[/C][C]0.485481[/C][/ROW]
[ROW][C]3[/C][C]0.154193[/C][C]1.1944[/C][C]0.118515[/C][/ROW]
[ROW][C]4[/C][C]-0.045537[/C][C]-0.3527[/C][C]0.362766[/C][/ROW]
[ROW][C]5[/C][C]0.172186[/C][C]1.3337[/C][C]0.093664[/C][/ROW]
[ROW][C]6[/C][C]0.159626[/C][C]1.2365[/C][C]0.110553[/C][/ROW]
[ROW][C]7[/C][C]-0.057919[/C][C]-0.4486[/C][C]0.327655[/C][/ROW]
[ROW][C]8[/C][C]-0.041491[/C][C]-0.3214[/C][C]0.374516[/C][/ROW]
[ROW][C]9[/C][C]0.032409[/C][C]0.251[/C][C]0.401322[/C][/ROW]
[ROW][C]10[/C][C]-0.042652[/C][C]-0.3304[/C][C]0.371131[/C][/ROW]
[ROW][C]11[/C][C]0.000673[/C][C]0.0052[/C][C]0.497928[/C][/ROW]
[ROW][C]12[/C][C]0.05989[/C][C]0.4639[/C][C]0.322198[/C][/ROW]
[ROW][C]13[/C][C]-0.043203[/C][C]-0.3347[/C][C]0.369527[/C][/ROW]
[ROW][C]14[/C][C]0.16293[/C][C]1.262[/C][C]0.105907[/C][/ROW]
[ROW][C]15[/C][C]0.129066[/C][C]0.9997[/C][C]0.160725[/C][/ROW]
[ROW][C]16[/C][C]-0.056033[/C][C]-0.434[/C][C]0.332912[/C][/ROW]
[ROW][C]17[/C][C]-0.323439[/C][C]-2.5053[/C][C]0.007483[/C][/ROW]
[ROW][C]18[/C][C]0.077061[/C][C]0.5969[/C][C]0.276406[/C][/ROW]
[ROW][C]19[/C][C]-0.014165[/C][C]-0.1097[/C][C]0.456499[/C][/ROW]
[ROW][C]20[/C][C]-0.106378[/C][C]-0.824[/C][C]0.206602[/C][/ROW]
[ROW][C]21[/C][C]-0.005465[/C][C]-0.0423[/C][C]0.483187[/C][/ROW]
[ROW][C]22[/C][C]0.043132[/C][C]0.3341[/C][C]0.369735[/C][/ROW]
[ROW][C]23[/C][C]-0.080265[/C][C]-0.6217[/C][C]0.268236[/C][/ROW]
[ROW][C]24[/C][C]0.038443[/C][C]0.2978[/C][C]0.383449[/C][/ROW]
[ROW][C]25[/C][C]-0.115635[/C][C]-0.8957[/C][C]0.186995[/C][/ROW]
[ROW][C]26[/C][C]-0.004087[/C][C]-0.0317[/C][C]0.487426[/C][/ROW]
[ROW][C]27[/C][C]-0.039744[/C][C]-0.3079[/C][C]0.379628[/C][/ROW]
[ROW][C]28[/C][C]-0.002127[/C][C]-0.0165[/C][C]0.493456[/C][/ROW]
[ROW][C]29[/C][C]0.003667[/C][C]0.0284[/C][C]0.488717[/C][/ROW]
[ROW][C]30[/C][C]0.020834[/C][C]0.1614[/C][C]0.436169[/C][/ROW]
[ROW][C]31[/C][C]0.089177[/C][C]0.6908[/C][C]0.246189[/C][/ROW]
[ROW][C]32[/C][C]-0.02023[/C][C]-0.1567[/C][C]0.438004[/C][/ROW]
[ROW][C]33[/C][C]0.086287[/C][C]0.6684[/C][C]0.253229[/C][/ROW]
[ROW][C]34[/C][C]-0.118597[/C][C]-0.9186[/C][C]0.180979[/C][/ROW]
[ROW][C]35[/C][C]0.037449[/C][C]0.2901[/C][C]0.386378[/C][/ROW]
[ROW][C]36[/C][C]-0.20588[/C][C]-1.5947[/C][C]0.058013[/C][/ROW]
[ROW][C]37[/C][C]-0.123411[/C][C]-0.9559[/C][C]0.17147[/C][/ROW]
[ROW][C]38[/C][C]-0.05306[/C][C]-0.411[/C][C]0.341267[/C][/ROW]
[ROW][C]39[/C][C]0.025653[/C][C]0.1987[/C][C]0.421583[/C][/ROW]
[ROW][C]40[/C][C]0.051117[/C][C]0.396[/C][C]0.346772[/C][/ROW]
[ROW][C]41[/C][C]0.032216[/C][C]0.2495[/C][C]0.401897[/C][/ROW]
[ROW][C]42[/C][C]-0.078461[/C][C]-0.6078[/C][C]0.272821[/C][/ROW]
[ROW][C]43[/C][C]0.062137[/C][C]0.4813[/C][C]0.316022[/C][/ROW]
[ROW][C]44[/C][C]-0.017747[/C][C]-0.1375[/C][C]0.445561[/C][/ROW]
[ROW][C]45[/C][C]-0.084313[/C][C]-0.6531[/C][C]0.258098[/C][/ROW]
[ROW][C]46[/C][C]-0.024093[/C][C]-0.1866[/C][C]0.426294[/C][/ROW]
[ROW][C]47[/C][C]0.021985[/C][C]0.1703[/C][C]0.432675[/C][/ROW]
[ROW][C]48[/C][C]0.019286[/C][C]0.1494[/C][C]0.440874[/C][/ROW]
[/TABLE]
Source: https://freestatistics.org/blog/index.php?pk=234328&T=2

Globally Unique Identifier (entire table): ba.freestatistics.org/blog/index.php?pk=234328&T=2

As an alternative you can also use a QR Code:  

The GUIDs for individual cells are displayed in the table below:

Partial Autocorrelation Function
Time lag kPACF(k)T-STATP-value
10.1926041.49190.070482
20.0047190.03660.485481
30.1541931.19440.118515
4-0.045537-0.35270.362766
50.1721861.33370.093664
60.1596261.23650.110553
7-0.057919-0.44860.327655
8-0.041491-0.32140.374516
90.0324090.2510.401322
10-0.042652-0.33040.371131
110.0006730.00520.497928
120.059890.46390.322198
13-0.043203-0.33470.369527
140.162931.2620.105907
150.1290660.99970.160725
16-0.056033-0.4340.332912
17-0.323439-2.50530.007483
180.0770610.59690.276406
19-0.014165-0.10970.456499
20-0.106378-0.8240.206602
21-0.005465-0.04230.483187
220.0431320.33410.369735
23-0.080265-0.62170.268236
240.0384430.29780.383449
25-0.115635-0.89570.186995
26-0.004087-0.03170.487426
27-0.039744-0.30790.379628
28-0.002127-0.01650.493456
290.0036670.02840.488717
300.0208340.16140.436169
310.0891770.69080.246189
32-0.02023-0.15670.438004
330.0862870.66840.253229
34-0.118597-0.91860.180979
350.0374490.29010.386378
36-0.20588-1.59470.058013
37-0.123411-0.95590.17147
38-0.05306-0.4110.341267
390.0256530.19870.421583
400.0511170.3960.346772
410.0322160.24950.401897
42-0.078461-0.60780.272821
430.0621370.48130.316022
44-0.017747-0.13750.445561
45-0.084313-0.65310.258098
46-0.024093-0.18660.426294
470.0219850.17030.432675
480.0192860.14940.440874


Parameters (Session):
par1 = 48 ; par2 = 1 ; par3 = 1 ; par4 = 0 ; par5 = 12 ; par6 = White Noise ; par7 = 0.95 ;
Parameters (R input):
par1 = 48 ; par2 = 1 ; par3 = 1 ; par4 = 0 ; par5 = 12 ; par6 = White Noise ; par7 = 0.95 ; par8 = ;
R code (references can be found in the software module):
if (par1 == 'Default') {
par1 = 10*log10(length(x))
} else {
par1 <- as.numeric(par1)
}
par2 <- as.numeric(par2)
par3 <- as.numeric(par3)
par4 <- as.numeric(par4)
par5 <- as.numeric(par5)
if (par6 == 'White Noise') par6 <- 'white' else par6 <- 'ma'
par7 <- as.numeric(par7)
if (par8 != '') par8 <- as.numeric(par8)
ox <- x
if (par8 == '') {
if (par2 == 0) {
x <- log(x)
} else {
x <- (x ^ par2 - 1) / par2
}
} else {
x <- log(x,base=par8)
}
if (par3 > 0) x <- diff(x,lag=1,difference=par3)
if (par4 > 0) x <- diff(x,lag=par5,difference=par4)
bitmap(file='picts.png')
op <- par(mfrow=c(2,1))
plot(ox,type='l',main='Original Time Series',xlab='time',ylab='value')
if (par8=='') {
mytitle <- paste('Working Time Series (lambda=',par2,', d=',par3,', D=',par4,')',sep='')
mysub <- paste('(lambda=',par2,', d=',par3,', D=',par4,', CI=', par7, ', CI type=',par6,')',sep='')
} else {
mytitle <- paste('Working Time Series (base=',par8,', d=',par3,', D=',par4,')',sep='')
mysub <- paste('(base=',par8,', d=',par3,', D=',par4,', CI=', par7, ', CI type=',par6,')',sep='')
}
plot(x,type='l', main=mytitle,xlab='time',ylab='value')
par(op)
dev.off()
bitmap(file='pic1.png')
racf <- acf(x, par1, main='Autocorrelation', xlab='time lag', ylab='ACF', ci.type=par6, ci=par7, sub=mysub)
dev.off()
bitmap(file='pic2.png')
rpacf <- pacf(x,par1,main='Partial Autocorrelation',xlab='lags',ylab='PACF',sub=mysub)
dev.off()
(myacf <- c(racf$acf))
(mypacf <- c(rpacf$acf))
lengthx <- length(x)
sqrtn <- sqrt(lengthx)
load(file='createtable')
a<-table.start()
a<-table.row.start(a)
a<-table.element(a,'Autocorrelation Function',4,TRUE)
a<-table.row.end(a)
a<-table.row.start(a)
a<-table.element(a,'Time lag k',header=TRUE)
a<-table.element(a,hyperlink('basics.htm','ACF(k)','click here for more information about the Autocorrelation Function'),header=TRUE)
a<-table.element(a,'T-STAT',header=TRUE)
a<-table.element(a,'P-value',header=TRUE)
a<-table.row.end(a)
for (i in 2:(par1+1)) {
a<-table.row.start(a)
a<-table.element(a,i-1,header=TRUE)
a<-table.element(a,round(myacf[i],6))
mytstat <- myacf[i]*sqrtn
a<-table.element(a,round(mytstat,4))
a<-table.element(a,round(1-pt(abs(mytstat),lengthx),6))
a<-table.row.end(a)
}
a<-table.end(a)
table.save(a,file='mytable.tab')
a<-table.start()
a<-table.row.start(a)
a<-table.element(a,'Partial Autocorrelation Function',4,TRUE)
a<-table.row.end(a)
a<-table.row.start(a)
a<-table.element(a,'Time lag k',header=TRUE)
a<-table.element(a,hyperlink('basics.htm','PACF(k)','click here for more information about the Partial Autocorrelation Function'),header=TRUE)
a<-table.element(a,'T-STAT',header=TRUE)
a<-table.element(a,'P-value',header=TRUE)
a<-table.row.end(a)
for (i in 1:par1) {
a<-table.row.start(a)
a<-table.element(a,i,header=TRUE)
a<-table.element(a,round(mypacf[i],6))
mytstat <- mypacf[i]*sqrtn
a<-table.element(a,round(mytstat,4))
a<-table.element(a,round(1-pt(abs(mytstat),lengthx),6))
a<-table.row.end(a)
}
a<-table.end(a)
table.save(a,file='mytable1.tab')