Free Statistics

of Irreproducible Research!

Author's title

Author*Unverified author*
R Software Modulerwasp_autocorrelation.wasp
Title produced by software(Partial) Autocorrelation Function
Date of computationMon, 17 Mar 2014 16:37:20 -0400
Cite this page as followsStatistical Computations at FreeStatistics.org, Office for Research Development and Education, URL https://freestatistics.org/blog/index.php?v=date/2014/Mar/17/t139508867031jeyksea6nihe5.htm/, Retrieved Tue, 14 May 2024 21:31:35 +0000
Statistical Computations at FreeStatistics.org, Office for Research Development and Education, URL https://freestatistics.org/blog/index.php?pk=234326, Retrieved Tue, 14 May 2024 21:31:35 +0000
QR Codes:

Original text written by user:
IsPrivate?No (this computation is public)
User-defined keywords
Estimated Impact96
Family? (F = Feedback message, R = changed R code, M = changed R Module, P = changed Parameters, D = changed Data)
-       [(Partial) Autocorrelation Function] [] [2014-03-17 20:37:20] [9ad8640ee6bb68970a185fdc3cb1cac3] [Current]
Feedback Forum

Post a new message
Dataseries X:
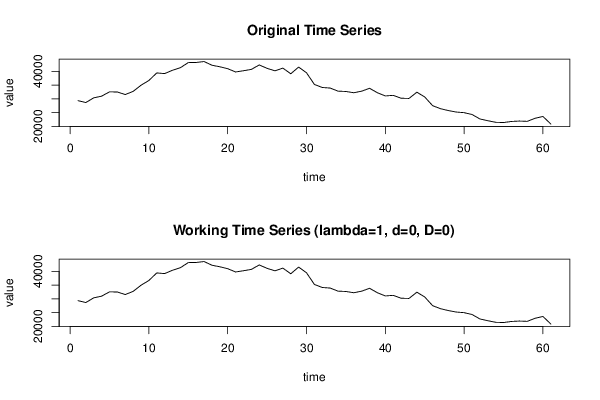
29358
28673
30383
30988
32565
32510
31584
32729
34977
36710
39457
39217
40435
41373
43221
43271
43605
42254
41702
41002
39804
40256
40740
42362
41126
40225
41216
39148
41591
39506
35261
34148
33947
32819
32700
32242
32810
33865
32226
31077
31293
30236
30160
32436
30695
27525
26434
25739
25204
24977
24320
22680
22052
21467
21383
21777
21928
21814
22937
23595
20830


Summary of computational transaction
Raw Inputview raw input (R code)
Raw Outputview raw output of R engine
Computing time4 seconds
R Server'Gertrude Mary Cox' @ cox.wessa.net

\begin{tabular}{lllllllll}
\hline
Summary of computational transaction \tabularnewline
Raw Input & view raw input (R code)  \tabularnewline
Raw Output & view raw output of R engine  \tabularnewline
Computing time & 4 seconds \tabularnewline
R Server & 'Gertrude Mary Cox' @ cox.wessa.net \tabularnewline
\hline
\end{tabular}
%Source: https://freestatistics.org/blog/index.php?pk=234326&T=0

[TABLE]
[ROW][C]Summary of computational transaction[/C][/ROW]
[ROW][C]Raw Input[/C][C]view raw input (R code) [/C][/ROW]
[ROW][C]Raw Output[/C][C]view raw output of R engine [/C][/ROW]
[ROW][C]Computing time[/C][C]4 seconds[/C][/ROW]
[ROW][C]R Server[/C][C]'Gertrude Mary Cox' @ cox.wessa.net[/C][/ROW]
[/TABLE]
Source: https://freestatistics.org/blog/index.php?pk=234326&T=0

Globally Unique Identifier (entire table): ba.freestatistics.org/blog/index.php?pk=234326&T=0

As an alternative you can also use a QR Code:  

The GUIDs for individual cells are displayed in the table below:

Summary of computational transaction
Raw Inputview raw input (R code)
Raw Outputview raw output of R engine
Computing time4 seconds
R Server'Gertrude Mary Cox' @ cox.wessa.net


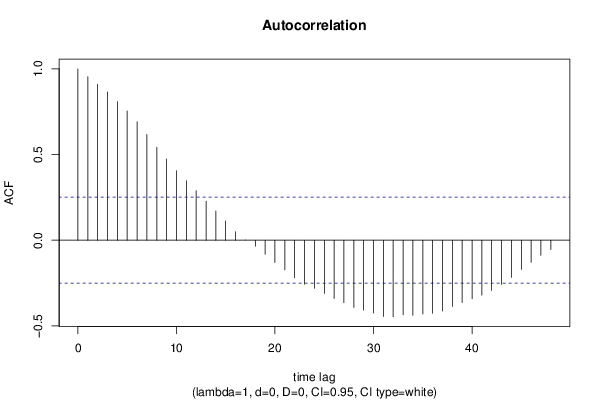
Autocorrelation Function
Time lag kACF(k)T-STATP-value
10.9541987.45250
20.9110687.11570
30.8652976.75820
40.8091526.31970
50.7541595.89020
60.6918115.40321e-06
70.617244.82085e-06
80.5433244.24353.8e-05
90.4738863.70120.000232
100.4056083.16790.0012
110.3470442.71050.004356
120.2885462.25360.013913
130.2274591.77650.040318
140.1702791.32990.094248
150.1119020.8740.192779
160.0496330.38760.349814
170.0005650.00440.498245
18-0.03506-0.27380.392571
19-0.082066-0.6410.261976
20-0.129812-1.01390.157327
21-0.173064-1.35170.090736
22-0.219099-1.71120.046061
23-0.257002-2.00720.02458
24-0.28023-2.18870.01623
25-0.310479-2.42490.009144
26-0.339939-2.6550.005051
27-0.364794-2.84910.002985
28-0.392105-3.06240.001632
29-0.408426-3.18990.001124
30-0.42541-3.32260.000756
31-0.445269-3.47770.000469
32-0.446356-3.48620.000457
33-0.435124-3.39846e-04
34-0.438252-3.42290.000556
35-0.430796-3.36460.000665
36-0.426217-3.32890.000741
37-0.413835-3.23220.000992
38-0.38676-3.02070.001841
39-0.363675-2.84040.003058
40-0.341837-2.66980.004856
41-0.320763-2.50520.007461
42-0.293372-2.29130.012707
43-0.259117-2.02380.02369
44-0.217133-1.69590.047505
45-0.17048-1.33150.093991
46-0.129314-1.010.158249
47-0.088345-0.690.246406
48-0.054391-0.42480.336237

\begin{tabular}{lllllllll}
\hline
Autocorrelation Function \tabularnewline
Time lag k & ACF(k) & T-STAT & P-value \tabularnewline
1 & 0.954198 & 7.4525 & 0 \tabularnewline
2 & 0.911068 & 7.1157 & 0 \tabularnewline
3 & 0.865297 & 6.7582 & 0 \tabularnewline
4 & 0.809152 & 6.3197 & 0 \tabularnewline
5 & 0.754159 & 5.8902 & 0 \tabularnewline
6 & 0.691811 & 5.4032 & 1e-06 \tabularnewline
7 & 0.61724 & 4.8208 & 5e-06 \tabularnewline
8 & 0.543324 & 4.2435 & 3.8e-05 \tabularnewline
9 & 0.473886 & 3.7012 & 0.000232 \tabularnewline
10 & 0.405608 & 3.1679 & 0.0012 \tabularnewline
11 & 0.347044 & 2.7105 & 0.004356 \tabularnewline
12 & 0.288546 & 2.2536 & 0.013913 \tabularnewline
13 & 0.227459 & 1.7765 & 0.040318 \tabularnewline
14 & 0.170279 & 1.3299 & 0.094248 \tabularnewline
15 & 0.111902 & 0.874 & 0.192779 \tabularnewline
16 & 0.049633 & 0.3876 & 0.349814 \tabularnewline
17 & 0.000565 & 0.0044 & 0.498245 \tabularnewline
18 & -0.03506 & -0.2738 & 0.392571 \tabularnewline
19 & -0.082066 & -0.641 & 0.261976 \tabularnewline
20 & -0.129812 & -1.0139 & 0.157327 \tabularnewline
21 & -0.173064 & -1.3517 & 0.090736 \tabularnewline
22 & -0.219099 & -1.7112 & 0.046061 \tabularnewline
23 & -0.257002 & -2.0072 & 0.02458 \tabularnewline
24 & -0.28023 & -2.1887 & 0.01623 \tabularnewline
25 & -0.310479 & -2.4249 & 0.009144 \tabularnewline
26 & -0.339939 & -2.655 & 0.005051 \tabularnewline
27 & -0.364794 & -2.8491 & 0.002985 \tabularnewline
28 & -0.392105 & -3.0624 & 0.001632 \tabularnewline
29 & -0.408426 & -3.1899 & 0.001124 \tabularnewline
30 & -0.42541 & -3.3226 & 0.000756 \tabularnewline
31 & -0.445269 & -3.4777 & 0.000469 \tabularnewline
32 & -0.446356 & -3.4862 & 0.000457 \tabularnewline
33 & -0.435124 & -3.3984 & 6e-04 \tabularnewline
34 & -0.438252 & -3.4229 & 0.000556 \tabularnewline
35 & -0.430796 & -3.3646 & 0.000665 \tabularnewline
36 & -0.426217 & -3.3289 & 0.000741 \tabularnewline
37 & -0.413835 & -3.2322 & 0.000992 \tabularnewline
38 & -0.38676 & -3.0207 & 0.001841 \tabularnewline
39 & -0.363675 & -2.8404 & 0.003058 \tabularnewline
40 & -0.341837 & -2.6698 & 0.004856 \tabularnewline
41 & -0.320763 & -2.5052 & 0.007461 \tabularnewline
42 & -0.293372 & -2.2913 & 0.012707 \tabularnewline
43 & -0.259117 & -2.0238 & 0.02369 \tabularnewline
44 & -0.217133 & -1.6959 & 0.047505 \tabularnewline
45 & -0.17048 & -1.3315 & 0.093991 \tabularnewline
46 & -0.129314 & -1.01 & 0.158249 \tabularnewline
47 & -0.088345 & -0.69 & 0.246406 \tabularnewline
48 & -0.054391 & -0.4248 & 0.336237 \tabularnewline
\hline
\end{tabular}
%Source: https://freestatistics.org/blog/index.php?pk=234326&T=1

[TABLE]
[ROW][C]Autocorrelation Function[/C][/ROW]
[ROW][C]Time lag k[/C][C]ACF(k)[/C][C]T-STAT[/C][C]P-value[/C][/ROW]
[ROW][C]1[/C][C]0.954198[/C][C]7.4525[/C][C]0[/C][/ROW]
[ROW][C]2[/C][C]0.911068[/C][C]7.1157[/C][C]0[/C][/ROW]
[ROW][C]3[/C][C]0.865297[/C][C]6.7582[/C][C]0[/C][/ROW]
[ROW][C]4[/C][C]0.809152[/C][C]6.3197[/C][C]0[/C][/ROW]
[ROW][C]5[/C][C]0.754159[/C][C]5.8902[/C][C]0[/C][/ROW]
[ROW][C]6[/C][C]0.691811[/C][C]5.4032[/C][C]1e-06[/C][/ROW]
[ROW][C]7[/C][C]0.61724[/C][C]4.8208[/C][C]5e-06[/C][/ROW]
[ROW][C]8[/C][C]0.543324[/C][C]4.2435[/C][C]3.8e-05[/C][/ROW]
[ROW][C]9[/C][C]0.473886[/C][C]3.7012[/C][C]0.000232[/C][/ROW]
[ROW][C]10[/C][C]0.405608[/C][C]3.1679[/C][C]0.0012[/C][/ROW]
[ROW][C]11[/C][C]0.347044[/C][C]2.7105[/C][C]0.004356[/C][/ROW]
[ROW][C]12[/C][C]0.288546[/C][C]2.2536[/C][C]0.013913[/C][/ROW]
[ROW][C]13[/C][C]0.227459[/C][C]1.7765[/C][C]0.040318[/C][/ROW]
[ROW][C]14[/C][C]0.170279[/C][C]1.3299[/C][C]0.094248[/C][/ROW]
[ROW][C]15[/C][C]0.111902[/C][C]0.874[/C][C]0.192779[/C][/ROW]
[ROW][C]16[/C][C]0.049633[/C][C]0.3876[/C][C]0.349814[/C][/ROW]
[ROW][C]17[/C][C]0.000565[/C][C]0.0044[/C][C]0.498245[/C][/ROW]
[ROW][C]18[/C][C]-0.03506[/C][C]-0.2738[/C][C]0.392571[/C][/ROW]
[ROW][C]19[/C][C]-0.082066[/C][C]-0.641[/C][C]0.261976[/C][/ROW]
[ROW][C]20[/C][C]-0.129812[/C][C]-1.0139[/C][C]0.157327[/C][/ROW]
[ROW][C]21[/C][C]-0.173064[/C][C]-1.3517[/C][C]0.090736[/C][/ROW]
[ROW][C]22[/C][C]-0.219099[/C][C]-1.7112[/C][C]0.046061[/C][/ROW]
[ROW][C]23[/C][C]-0.257002[/C][C]-2.0072[/C][C]0.02458[/C][/ROW]
[ROW][C]24[/C][C]-0.28023[/C][C]-2.1887[/C][C]0.01623[/C][/ROW]
[ROW][C]25[/C][C]-0.310479[/C][C]-2.4249[/C][C]0.009144[/C][/ROW]
[ROW][C]26[/C][C]-0.339939[/C][C]-2.655[/C][C]0.005051[/C][/ROW]
[ROW][C]27[/C][C]-0.364794[/C][C]-2.8491[/C][C]0.002985[/C][/ROW]
[ROW][C]28[/C][C]-0.392105[/C][C]-3.0624[/C][C]0.001632[/C][/ROW]
[ROW][C]29[/C][C]-0.408426[/C][C]-3.1899[/C][C]0.001124[/C][/ROW]
[ROW][C]30[/C][C]-0.42541[/C][C]-3.3226[/C][C]0.000756[/C][/ROW]
[ROW][C]31[/C][C]-0.445269[/C][C]-3.4777[/C][C]0.000469[/C][/ROW]
[ROW][C]32[/C][C]-0.446356[/C][C]-3.4862[/C][C]0.000457[/C][/ROW]
[ROW][C]33[/C][C]-0.435124[/C][C]-3.3984[/C][C]6e-04[/C][/ROW]
[ROW][C]34[/C][C]-0.438252[/C][C]-3.4229[/C][C]0.000556[/C][/ROW]
[ROW][C]35[/C][C]-0.430796[/C][C]-3.3646[/C][C]0.000665[/C][/ROW]
[ROW][C]36[/C][C]-0.426217[/C][C]-3.3289[/C][C]0.000741[/C][/ROW]
[ROW][C]37[/C][C]-0.413835[/C][C]-3.2322[/C][C]0.000992[/C][/ROW]
[ROW][C]38[/C][C]-0.38676[/C][C]-3.0207[/C][C]0.001841[/C][/ROW]
[ROW][C]39[/C][C]-0.363675[/C][C]-2.8404[/C][C]0.003058[/C][/ROW]
[ROW][C]40[/C][C]-0.341837[/C][C]-2.6698[/C][C]0.004856[/C][/ROW]
[ROW][C]41[/C][C]-0.320763[/C][C]-2.5052[/C][C]0.007461[/C][/ROW]
[ROW][C]42[/C][C]-0.293372[/C][C]-2.2913[/C][C]0.012707[/C][/ROW]
[ROW][C]43[/C][C]-0.259117[/C][C]-2.0238[/C][C]0.02369[/C][/ROW]
[ROW][C]44[/C][C]-0.217133[/C][C]-1.6959[/C][C]0.047505[/C][/ROW]
[ROW][C]45[/C][C]-0.17048[/C][C]-1.3315[/C][C]0.093991[/C][/ROW]
[ROW][C]46[/C][C]-0.129314[/C][C]-1.01[/C][C]0.158249[/C][/ROW]
[ROW][C]47[/C][C]-0.088345[/C][C]-0.69[/C][C]0.246406[/C][/ROW]
[ROW][C]48[/C][C]-0.054391[/C][C]-0.4248[/C][C]0.336237[/C][/ROW]
[/TABLE]
Source: https://freestatistics.org/blog/index.php?pk=234326&T=1

Globally Unique Identifier (entire table): ba.freestatistics.org/blog/index.php?pk=234326&T=1

As an alternative you can also use a QR Code:  

The GUIDs for individual cells are displayed in the table below:

Autocorrelation Function
Time lag kACF(k)T-STATP-value
10.9541987.45250
20.9110687.11570
30.8652976.75820
40.8091526.31970
50.7541595.89020
60.6918115.40321e-06
70.617244.82085e-06
80.5433244.24353.8e-05
90.4738863.70120.000232
100.4056083.16790.0012
110.3470442.71050.004356
120.2885462.25360.013913
130.2274591.77650.040318
140.1702791.32990.094248
150.1119020.8740.192779
160.0496330.38760.349814
170.0005650.00440.498245
18-0.03506-0.27380.392571
19-0.082066-0.6410.261976
20-0.129812-1.01390.157327
21-0.173064-1.35170.090736
22-0.219099-1.71120.046061
23-0.257002-2.00720.02458
24-0.28023-2.18870.01623
25-0.310479-2.42490.009144
26-0.339939-2.6550.005051
27-0.364794-2.84910.002985
28-0.392105-3.06240.001632
29-0.408426-3.18990.001124
30-0.42541-3.32260.000756
31-0.445269-3.47770.000469
32-0.446356-3.48620.000457
33-0.435124-3.39846e-04
34-0.438252-3.42290.000556
35-0.430796-3.36460.000665
36-0.426217-3.32890.000741
37-0.413835-3.23220.000992
38-0.38676-3.02070.001841
39-0.363675-2.84040.003058
40-0.341837-2.66980.004856
41-0.320763-2.50520.007461
42-0.293372-2.29130.012707
43-0.259117-2.02380.02369
44-0.217133-1.69590.047505
45-0.17048-1.33150.093991
46-0.129314-1.010.158249
47-0.088345-0.690.246406
48-0.054391-0.42480.336237


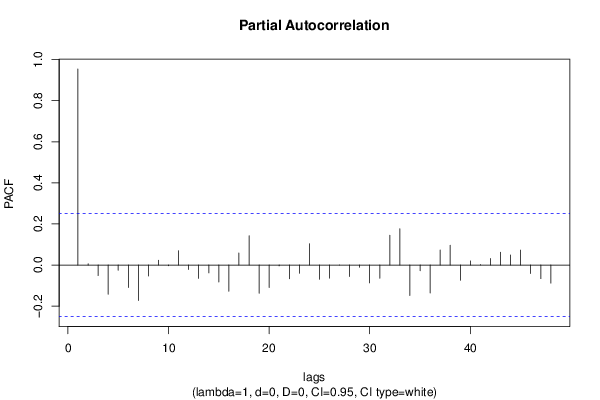
Partial Autocorrelation Function
Time lag kPACF(k)T-STATP-value
10.9541987.45250
20.00640.050.480149
3-0.051236-0.40020.345216
4-0.142386-1.11210.135235
5-0.024997-0.19520.422931
6-0.108787-0.84970.199421
7-0.172416-1.34660.091543
8-0.053135-0.4150.339801
90.0235140.18370.427447
10-0.003269-0.02550.489856
110.0693930.5420.294905
12-0.021838-0.17060.432568
13-0.064619-0.50470.307798
14-0.038028-0.2970.383734
15-0.082158-0.64170.261744
16-0.127697-0.99730.161269
170.0585530.45730.324535
180.1424991.1130.135047
19-0.137424-1.07330.143679
20-0.108996-0.85130.198969
21-0.003942-0.03080.48777
22-0.066855-0.52220.301726
23-0.039552-0.30890.37922
240.1041180.81320.209636
25-0.06917-0.54020.295502
26-0.063629-0.4970.310502
270.0003330.00260.498968
28-0.055572-0.4340.332899
29-0.010627-0.0830.467062
30-0.086814-0.6780.250154
31-0.064063-0.50040.309314
320.1449041.13170.131087
330.1770831.38310.085844
34-0.148219-1.15760.125764
35-0.027714-0.21650.414678
36-0.135926-1.06160.146298
370.0733020.57250.284542
380.0960780.75040.227951
39-0.073917-0.57730.282928
400.020290.15850.437306
410.0010020.00780.496889
420.0317450.24790.402508
430.0625880.48880.313359
440.0494350.38610.350384
450.0726420.56740.286278
46-0.040876-0.31920.375315
47-0.066062-0.5160.303875
48-0.087741-0.68530.247882

\begin{tabular}{lllllllll}
\hline
Partial Autocorrelation Function \tabularnewline
Time lag k & PACF(k) & T-STAT & P-value \tabularnewline
1 & 0.954198 & 7.4525 & 0 \tabularnewline
2 & 0.0064 & 0.05 & 0.480149 \tabularnewline
3 & -0.051236 & -0.4002 & 0.345216 \tabularnewline
4 & -0.142386 & -1.1121 & 0.135235 \tabularnewline
5 & -0.024997 & -0.1952 & 0.422931 \tabularnewline
6 & -0.108787 & -0.8497 & 0.199421 \tabularnewline
7 & -0.172416 & -1.3466 & 0.091543 \tabularnewline
8 & -0.053135 & -0.415 & 0.339801 \tabularnewline
9 & 0.023514 & 0.1837 & 0.427447 \tabularnewline
10 & -0.003269 & -0.0255 & 0.489856 \tabularnewline
11 & 0.069393 & 0.542 & 0.294905 \tabularnewline
12 & -0.021838 & -0.1706 & 0.432568 \tabularnewline
13 & -0.064619 & -0.5047 & 0.307798 \tabularnewline
14 & -0.038028 & -0.297 & 0.383734 \tabularnewline
15 & -0.082158 & -0.6417 & 0.261744 \tabularnewline
16 & -0.127697 & -0.9973 & 0.161269 \tabularnewline
17 & 0.058553 & 0.4573 & 0.324535 \tabularnewline
18 & 0.142499 & 1.113 & 0.135047 \tabularnewline
19 & -0.137424 & -1.0733 & 0.143679 \tabularnewline
20 & -0.108996 & -0.8513 & 0.198969 \tabularnewline
21 & -0.003942 & -0.0308 & 0.48777 \tabularnewline
22 & -0.066855 & -0.5222 & 0.301726 \tabularnewline
23 & -0.039552 & -0.3089 & 0.37922 \tabularnewline
24 & 0.104118 & 0.8132 & 0.209636 \tabularnewline
25 & -0.06917 & -0.5402 & 0.295502 \tabularnewline
26 & -0.063629 & -0.497 & 0.310502 \tabularnewline
27 & 0.000333 & 0.0026 & 0.498968 \tabularnewline
28 & -0.055572 & -0.434 & 0.332899 \tabularnewline
29 & -0.010627 & -0.083 & 0.467062 \tabularnewline
30 & -0.086814 & -0.678 & 0.250154 \tabularnewline
31 & -0.064063 & -0.5004 & 0.309314 \tabularnewline
32 & 0.144904 & 1.1317 & 0.131087 \tabularnewline
33 & 0.177083 & 1.3831 & 0.085844 \tabularnewline
34 & -0.148219 & -1.1576 & 0.125764 \tabularnewline
35 & -0.027714 & -0.2165 & 0.414678 \tabularnewline
36 & -0.135926 & -1.0616 & 0.146298 \tabularnewline
37 & 0.073302 & 0.5725 & 0.284542 \tabularnewline
38 & 0.096078 & 0.7504 & 0.227951 \tabularnewline
39 & -0.073917 & -0.5773 & 0.282928 \tabularnewline
40 & 0.02029 & 0.1585 & 0.437306 \tabularnewline
41 & 0.001002 & 0.0078 & 0.496889 \tabularnewline
42 & 0.031745 & 0.2479 & 0.402508 \tabularnewline
43 & 0.062588 & 0.4888 & 0.313359 \tabularnewline
44 & 0.049435 & 0.3861 & 0.350384 \tabularnewline
45 & 0.072642 & 0.5674 & 0.286278 \tabularnewline
46 & -0.040876 & -0.3192 & 0.375315 \tabularnewline
47 & -0.066062 & -0.516 & 0.303875 \tabularnewline
48 & -0.087741 & -0.6853 & 0.247882 \tabularnewline
\hline
\end{tabular}
%Source: https://freestatistics.org/blog/index.php?pk=234326&T=2

[TABLE]
[ROW][C]Partial Autocorrelation Function[/C][/ROW]
[ROW][C]Time lag k[/C][C]PACF(k)[/C][C]T-STAT[/C][C]P-value[/C][/ROW]
[ROW][C]1[/C][C]0.954198[/C][C]7.4525[/C][C]0[/C][/ROW]
[ROW][C]2[/C][C]0.0064[/C][C]0.05[/C][C]0.480149[/C][/ROW]
[ROW][C]3[/C][C]-0.051236[/C][C]-0.4002[/C][C]0.345216[/C][/ROW]
[ROW][C]4[/C][C]-0.142386[/C][C]-1.1121[/C][C]0.135235[/C][/ROW]
[ROW][C]5[/C][C]-0.024997[/C][C]-0.1952[/C][C]0.422931[/C][/ROW]
[ROW][C]6[/C][C]-0.108787[/C][C]-0.8497[/C][C]0.199421[/C][/ROW]
[ROW][C]7[/C][C]-0.172416[/C][C]-1.3466[/C][C]0.091543[/C][/ROW]
[ROW][C]8[/C][C]-0.053135[/C][C]-0.415[/C][C]0.339801[/C][/ROW]
[ROW][C]9[/C][C]0.023514[/C][C]0.1837[/C][C]0.427447[/C][/ROW]
[ROW][C]10[/C][C]-0.003269[/C][C]-0.0255[/C][C]0.489856[/C][/ROW]
[ROW][C]11[/C][C]0.069393[/C][C]0.542[/C][C]0.294905[/C][/ROW]
[ROW][C]12[/C][C]-0.021838[/C][C]-0.1706[/C][C]0.432568[/C][/ROW]
[ROW][C]13[/C][C]-0.064619[/C][C]-0.5047[/C][C]0.307798[/C][/ROW]
[ROW][C]14[/C][C]-0.038028[/C][C]-0.297[/C][C]0.383734[/C][/ROW]
[ROW][C]15[/C][C]-0.082158[/C][C]-0.6417[/C][C]0.261744[/C][/ROW]
[ROW][C]16[/C][C]-0.127697[/C][C]-0.9973[/C][C]0.161269[/C][/ROW]
[ROW][C]17[/C][C]0.058553[/C][C]0.4573[/C][C]0.324535[/C][/ROW]
[ROW][C]18[/C][C]0.142499[/C][C]1.113[/C][C]0.135047[/C][/ROW]
[ROW][C]19[/C][C]-0.137424[/C][C]-1.0733[/C][C]0.143679[/C][/ROW]
[ROW][C]20[/C][C]-0.108996[/C][C]-0.8513[/C][C]0.198969[/C][/ROW]
[ROW][C]21[/C][C]-0.003942[/C][C]-0.0308[/C][C]0.48777[/C][/ROW]
[ROW][C]22[/C][C]-0.066855[/C][C]-0.5222[/C][C]0.301726[/C][/ROW]
[ROW][C]23[/C][C]-0.039552[/C][C]-0.3089[/C][C]0.37922[/C][/ROW]
[ROW][C]24[/C][C]0.104118[/C][C]0.8132[/C][C]0.209636[/C][/ROW]
[ROW][C]25[/C][C]-0.06917[/C][C]-0.5402[/C][C]0.295502[/C][/ROW]
[ROW][C]26[/C][C]-0.063629[/C][C]-0.497[/C][C]0.310502[/C][/ROW]
[ROW][C]27[/C][C]0.000333[/C][C]0.0026[/C][C]0.498968[/C][/ROW]
[ROW][C]28[/C][C]-0.055572[/C][C]-0.434[/C][C]0.332899[/C][/ROW]
[ROW][C]29[/C][C]-0.010627[/C][C]-0.083[/C][C]0.467062[/C][/ROW]
[ROW][C]30[/C][C]-0.086814[/C][C]-0.678[/C][C]0.250154[/C][/ROW]
[ROW][C]31[/C][C]-0.064063[/C][C]-0.5004[/C][C]0.309314[/C][/ROW]
[ROW][C]32[/C][C]0.144904[/C][C]1.1317[/C][C]0.131087[/C][/ROW]
[ROW][C]33[/C][C]0.177083[/C][C]1.3831[/C][C]0.085844[/C][/ROW]
[ROW][C]34[/C][C]-0.148219[/C][C]-1.1576[/C][C]0.125764[/C][/ROW]
[ROW][C]35[/C][C]-0.027714[/C][C]-0.2165[/C][C]0.414678[/C][/ROW]
[ROW][C]36[/C][C]-0.135926[/C][C]-1.0616[/C][C]0.146298[/C][/ROW]
[ROW][C]37[/C][C]0.073302[/C][C]0.5725[/C][C]0.284542[/C][/ROW]
[ROW][C]38[/C][C]0.096078[/C][C]0.7504[/C][C]0.227951[/C][/ROW]
[ROW][C]39[/C][C]-0.073917[/C][C]-0.5773[/C][C]0.282928[/C][/ROW]
[ROW][C]40[/C][C]0.02029[/C][C]0.1585[/C][C]0.437306[/C][/ROW]
[ROW][C]41[/C][C]0.001002[/C][C]0.0078[/C][C]0.496889[/C][/ROW]
[ROW][C]42[/C][C]0.031745[/C][C]0.2479[/C][C]0.402508[/C][/ROW]
[ROW][C]43[/C][C]0.062588[/C][C]0.4888[/C][C]0.313359[/C][/ROW]
[ROW][C]44[/C][C]0.049435[/C][C]0.3861[/C][C]0.350384[/C][/ROW]
[ROW][C]45[/C][C]0.072642[/C][C]0.5674[/C][C]0.286278[/C][/ROW]
[ROW][C]46[/C][C]-0.040876[/C][C]-0.3192[/C][C]0.375315[/C][/ROW]
[ROW][C]47[/C][C]-0.066062[/C][C]-0.516[/C][C]0.303875[/C][/ROW]
[ROW][C]48[/C][C]-0.087741[/C][C]-0.6853[/C][C]0.247882[/C][/ROW]
[/TABLE]
Source: https://freestatistics.org/blog/index.php?pk=234326&T=2

Globally Unique Identifier (entire table): ba.freestatistics.org/blog/index.php?pk=234326&T=2

As an alternative you can also use a QR Code:  

The GUIDs for individual cells are displayed in the table below:

Partial Autocorrelation Function
Time lag kPACF(k)T-STATP-value
10.9541987.45250
20.00640.050.480149
3-0.051236-0.40020.345216
4-0.142386-1.11210.135235
5-0.024997-0.19520.422931
6-0.108787-0.84970.199421
7-0.172416-1.34660.091543
8-0.053135-0.4150.339801
90.0235140.18370.427447
10-0.003269-0.02550.489856
110.0693930.5420.294905
12-0.021838-0.17060.432568
13-0.064619-0.50470.307798
14-0.038028-0.2970.383734
15-0.082158-0.64170.261744
16-0.127697-0.99730.161269
170.0585530.45730.324535
180.1424991.1130.135047
19-0.137424-1.07330.143679
20-0.108996-0.85130.198969
21-0.003942-0.03080.48777
22-0.066855-0.52220.301726
23-0.039552-0.30890.37922
240.1041180.81320.209636
25-0.06917-0.54020.295502
26-0.063629-0.4970.310502
270.0003330.00260.498968
28-0.055572-0.4340.332899
29-0.010627-0.0830.467062
30-0.086814-0.6780.250154
31-0.064063-0.50040.309314
320.1449041.13170.131087
330.1770831.38310.085844
34-0.148219-1.15760.125764
35-0.027714-0.21650.414678
36-0.135926-1.06160.146298
370.0733020.57250.284542
380.0960780.75040.227951
39-0.073917-0.57730.282928
400.020290.15850.437306
410.0010020.00780.496889
420.0317450.24790.402508
430.0625880.48880.313359
440.0494350.38610.350384
450.0726420.56740.286278
46-0.040876-0.31920.375315
47-0.066062-0.5160.303875
48-0.087741-0.68530.247882


Parameters (Session):
par1 = 48 ; par2 = 1 ; par3 = 0 ; par4 = 0 ; par5 = 12 ; par6 = White Noise ; par7 = 0.95 ;
Parameters (R input):
par1 = 48 ; par2 = 1 ; par3 = 0 ; par4 = 0 ; par5 = 12 ; par6 = White Noise ; par7 = 0.95 ; par8 = ;
R code (references can be found in the software module):
if (par1 == 'Default') {
par1 = 10*log10(length(x))
} else {
par1 <- as.numeric(par1)
}
par2 <- as.numeric(par2)
par3 <- as.numeric(par3)
par4 <- as.numeric(par4)
par5 <- as.numeric(par5)
if (par6 == 'White Noise') par6 <- 'white' else par6 <- 'ma'
par7 <- as.numeric(par7)
if (par8 != '') par8 <- as.numeric(par8)
ox <- x
if (par8 == '') {
if (par2 == 0) {
x <- log(x)
} else {
x <- (x ^ par2 - 1) / par2
}
} else {
x <- log(x,base=par8)
}
if (par3 > 0) x <- diff(x,lag=1,difference=par3)
if (par4 > 0) x <- diff(x,lag=par5,difference=par4)
bitmap(file='picts.png')
op <- par(mfrow=c(2,1))
plot(ox,type='l',main='Original Time Series',xlab='time',ylab='value')
if (par8=='') {
mytitle <- paste('Working Time Series (lambda=',par2,', d=',par3,', D=',par4,')',sep='')
mysub <- paste('(lambda=',par2,', d=',par3,', D=',par4,', CI=', par7, ', CI type=',par6,')',sep='')
} else {
mytitle <- paste('Working Time Series (base=',par8,', d=',par3,', D=',par4,')',sep='')
mysub <- paste('(base=',par8,', d=',par3,', D=',par4,', CI=', par7, ', CI type=',par6,')',sep='')
}
plot(x,type='l', main=mytitle,xlab='time',ylab='value')
par(op)
dev.off()
bitmap(file='pic1.png')
racf <- acf(x, par1, main='Autocorrelation', xlab='time lag', ylab='ACF', ci.type=par6, ci=par7, sub=mysub)
dev.off()
bitmap(file='pic2.png')
rpacf <- pacf(x,par1,main='Partial Autocorrelation',xlab='lags',ylab='PACF',sub=mysub)
dev.off()
(myacf <- c(racf$acf))
(mypacf <- c(rpacf$acf))
lengthx <- length(x)
sqrtn <- sqrt(lengthx)
load(file='createtable')
a<-table.start()
a<-table.row.start(a)
a<-table.element(a,'Autocorrelation Function',4,TRUE)
a<-table.row.end(a)
a<-table.row.start(a)
a<-table.element(a,'Time lag k',header=TRUE)
a<-table.element(a,hyperlink('basics.htm','ACF(k)','click here for more information about the Autocorrelation Function'),header=TRUE)
a<-table.element(a,'T-STAT',header=TRUE)
a<-table.element(a,'P-value',header=TRUE)
a<-table.row.end(a)
for (i in 2:(par1+1)) {
a<-table.row.start(a)
a<-table.element(a,i-1,header=TRUE)
a<-table.element(a,round(myacf[i],6))
mytstat <- myacf[i]*sqrtn
a<-table.element(a,round(mytstat,4))
a<-table.element(a,round(1-pt(abs(mytstat),lengthx),6))
a<-table.row.end(a)
}
a<-table.end(a)
table.save(a,file='mytable.tab')
a<-table.start()
a<-table.row.start(a)
a<-table.element(a,'Partial Autocorrelation Function',4,TRUE)
a<-table.row.end(a)
a<-table.row.start(a)
a<-table.element(a,'Time lag k',header=TRUE)
a<-table.element(a,hyperlink('basics.htm','PACF(k)','click here for more information about the Partial Autocorrelation Function'),header=TRUE)
a<-table.element(a,'T-STAT',header=TRUE)
a<-table.element(a,'P-value',header=TRUE)
a<-table.row.end(a)
for (i in 1:par1) {
a<-table.row.start(a)
a<-table.element(a,i,header=TRUE)
a<-table.element(a,round(mypacf[i],6))
mytstat <- mypacf[i]*sqrtn
a<-table.element(a,round(mytstat,4))
a<-table.element(a,round(1-pt(abs(mytstat),lengthx),6))
a<-table.row.end(a)
}
a<-table.end(a)
table.save(a,file='mytable1.tab')