Free Statistics

of Irreproducible Research!

Author's title

Author*Unverified author*
R Software Modulerwasp_autocorrelation.wasp
Title produced by software(Partial) Autocorrelation Function
Date of computationMon, 17 Mar 2014 11:32:27 -0400
Cite this page as followsStatistical Computations at FreeStatistics.org, Office for Research Development and Education, URL https://freestatistics.org/blog/index.php?v=date/2014/Mar/17/t1395070367r3rx19uofvspfs4.htm/, Retrieved Tue, 14 May 2024 10:06:35 +0000
Statistical Computations at FreeStatistics.org, Office for Research Development and Education, URL https://freestatistics.org/blog/index.php?pk=234299, Retrieved Tue, 14 May 2024 10:06:35 +0000
QR Codes:

Original text written by user:
IsPrivate?No (this computation is public)
User-defined keywords
Estimated Impact102
Family? (F = Feedback message, R = changed R code, M = changed R Module, P = changed Parameters, D = changed Data)
-       [(Partial) Autocorrelation Function] [] [2014-03-17 15:32:27] [7373f181761c5c20212e36e73239e9d6] [Current]
Feedback Forum

Post a new message
Dataseries X:
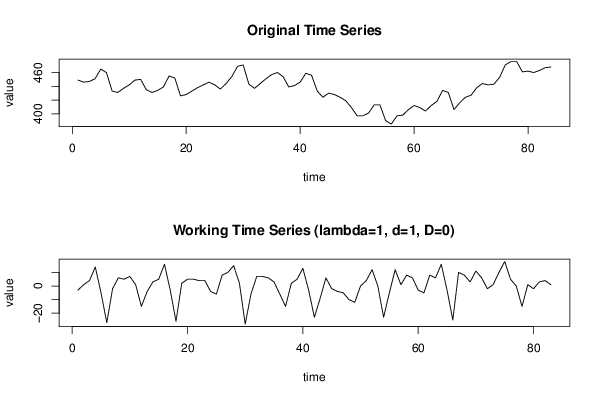
449
446
447
451
465
460
433
431
437
442
449
450
435
431
434
439
455
452
426
428
433
438
442
446
442
436
444
454
469
471
443
437
444
451
457
460
454
439
441
446
459
456
433
424
430
428
424
419
409
397
397
401
413
413
390
385
397
398
406
412
409
404
412
418
434
431
406
416
424
427
438
444
442
443
453
471
476
476
461
462
460
463
467
468


Summary of computational transaction
Raw Inputview raw input (R code)
Raw Outputview raw output of R engine
Computing time3 seconds
R Server'Gertrude Mary Cox' @ cox.wessa.net

\begin{tabular}{lllllllll}
\hline
Summary of computational transaction \tabularnewline
Raw Input & view raw input (R code)  \tabularnewline
Raw Output & view raw output of R engine  \tabularnewline
Computing time & 3 seconds \tabularnewline
R Server & 'Gertrude Mary Cox' @ cox.wessa.net \tabularnewline
\hline
\end{tabular}
%Source: https://freestatistics.org/blog/index.php?pk=234299&T=0

[TABLE]
[ROW][C]Summary of computational transaction[/C][/ROW]
[ROW][C]Raw Input[/C][C]view raw input (R code) [/C][/ROW]
[ROW][C]Raw Output[/C][C]view raw output of R engine [/C][/ROW]
[ROW][C]Computing time[/C][C]3 seconds[/C][/ROW]
[ROW][C]R Server[/C][C]'Gertrude Mary Cox' @ cox.wessa.net[/C][/ROW]
[/TABLE]
Source: https://freestatistics.org/blog/index.php?pk=234299&T=0

Globally Unique Identifier (entire table): ba.freestatistics.org/blog/index.php?pk=234299&T=0

As an alternative you can also use a QR Code:  

The GUIDs for individual cells are displayed in the table below:

Summary of computational transaction
Raw Inputview raw input (R code)
Raw Outputview raw output of R engine
Computing time3 seconds
R Server'Gertrude Mary Cox' @ cox.wessa.net


Autocorrelation Function
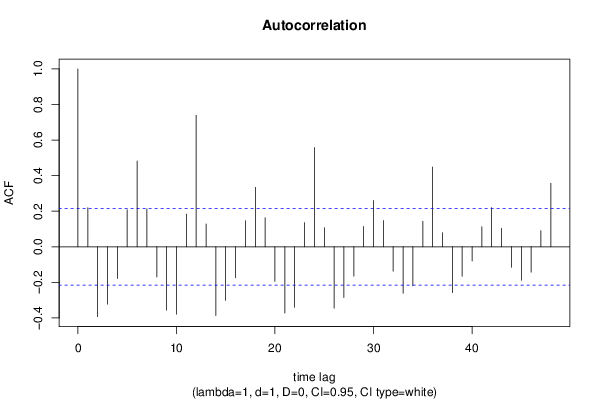
Time lag kACF(k)T-STATP-value
10.2194111.99890.024444
2-0.392789-3.57850.00029
3-0.322307-2.93640.002148
4-0.178595-1.62710.053756
50.2082671.89740.030626
60.4821854.39291.6e-05
70.2133541.94370.027657
8-0.1698-1.54690.06284
9-0.35621-3.24520.000846
10-0.37885-3.45150.00044
110.183671.67330.049015
120.7388516.73120
130.1287561.1730.122071
14-0.386509-3.52130.00035
15-0.301284-2.74480.00371
16-0.173777-1.58320.058591
170.1466241.33580.092631
180.3340673.04350.001566
190.1636491.49090.069887
20-0.194659-1.77340.039913
21-0.372161-3.39050.000535
22-0.340335-3.10060.001319
230.136121.24010.109215
240.5585325.08851e-06
250.1074540.9790.165224
26-0.344759-3.14090.001167
27-0.285597-2.60190.005488
28-0.164939-1.50270.06836
290.1144431.04260.150075
300.2605362.37360.009963
310.1475031.34380.091334
32-0.136797-1.24630.108084
33-0.26091-2.3770.009877
34-0.219278-1.99770.024511
350.1432431.3050.097748
360.4488974.08965e-05
370.0787450.71740.23757
38-0.257583-2.34670.010662
39-0.16593-1.51170.067205
40-0.080398-0.73250.232976
410.112631.02610.153911
420.2204322.00820.023935
430.1046780.95370.171511
44-0.115531-1.05250.147805
45-0.188058-1.71330.045196
46-0.142514-1.29840.098879
470.0907890.82710.205269
480.3572833.2550.000821

\begin{tabular}{lllllllll}
\hline
Autocorrelation Function \tabularnewline
Time lag k & ACF(k) & T-STAT & P-value \tabularnewline
1 & 0.219411 & 1.9989 & 0.024444 \tabularnewline
2 & -0.392789 & -3.5785 & 0.00029 \tabularnewline
3 & -0.322307 & -2.9364 & 0.002148 \tabularnewline
4 & -0.178595 & -1.6271 & 0.053756 \tabularnewline
5 & 0.208267 & 1.8974 & 0.030626 \tabularnewline
6 & 0.482185 & 4.3929 & 1.6e-05 \tabularnewline
7 & 0.213354 & 1.9437 & 0.027657 \tabularnewline
8 & -0.1698 & -1.5469 & 0.06284 \tabularnewline
9 & -0.35621 & -3.2452 & 0.000846 \tabularnewline
10 & -0.37885 & -3.4515 & 0.00044 \tabularnewline
11 & 0.18367 & 1.6733 & 0.049015 \tabularnewline
12 & 0.738851 & 6.7312 & 0 \tabularnewline
13 & 0.128756 & 1.173 & 0.122071 \tabularnewline
14 & -0.386509 & -3.5213 & 0.00035 \tabularnewline
15 & -0.301284 & -2.7448 & 0.00371 \tabularnewline
16 & -0.173777 & -1.5832 & 0.058591 \tabularnewline
17 & 0.146624 & 1.3358 & 0.092631 \tabularnewline
18 & 0.334067 & 3.0435 & 0.001566 \tabularnewline
19 & 0.163649 & 1.4909 & 0.069887 \tabularnewline
20 & -0.194659 & -1.7734 & 0.039913 \tabularnewline
21 & -0.372161 & -3.3905 & 0.000535 \tabularnewline
22 & -0.340335 & -3.1006 & 0.001319 \tabularnewline
23 & 0.13612 & 1.2401 & 0.109215 \tabularnewline
24 & 0.558532 & 5.0885 & 1e-06 \tabularnewline
25 & 0.107454 & 0.979 & 0.165224 \tabularnewline
26 & -0.344759 & -3.1409 & 0.001167 \tabularnewline
27 & -0.285597 & -2.6019 & 0.005488 \tabularnewline
28 & -0.164939 & -1.5027 & 0.06836 \tabularnewline
29 & 0.114443 & 1.0426 & 0.150075 \tabularnewline
30 & 0.260536 & 2.3736 & 0.009963 \tabularnewline
31 & 0.147503 & 1.3438 & 0.091334 \tabularnewline
32 & -0.136797 & -1.2463 & 0.108084 \tabularnewline
33 & -0.26091 & -2.377 & 0.009877 \tabularnewline
34 & -0.219278 & -1.9977 & 0.024511 \tabularnewline
35 & 0.143243 & 1.305 & 0.097748 \tabularnewline
36 & 0.448897 & 4.0896 & 5e-05 \tabularnewline
37 & 0.078745 & 0.7174 & 0.23757 \tabularnewline
38 & -0.257583 & -2.3467 & 0.010662 \tabularnewline
39 & -0.16593 & -1.5117 & 0.067205 \tabularnewline
40 & -0.080398 & -0.7325 & 0.232976 \tabularnewline
41 & 0.11263 & 1.0261 & 0.153911 \tabularnewline
42 & 0.220432 & 2.0082 & 0.023935 \tabularnewline
43 & 0.104678 & 0.9537 & 0.171511 \tabularnewline
44 & -0.115531 & -1.0525 & 0.147805 \tabularnewline
45 & -0.188058 & -1.7133 & 0.045196 \tabularnewline
46 & -0.142514 & -1.2984 & 0.098879 \tabularnewline
47 & 0.090789 & 0.8271 & 0.205269 \tabularnewline
48 & 0.357283 & 3.255 & 0.000821 \tabularnewline
\hline
\end{tabular}
%Source: https://freestatistics.org/blog/index.php?pk=234299&T=1

[TABLE]
[ROW][C]Autocorrelation Function[/C][/ROW]
[ROW][C]Time lag k[/C][C]ACF(k)[/C][C]T-STAT[/C][C]P-value[/C][/ROW]
[ROW][C]1[/C][C]0.219411[/C][C]1.9989[/C][C]0.024444[/C][/ROW]
[ROW][C]2[/C][C]-0.392789[/C][C]-3.5785[/C][C]0.00029[/C][/ROW]
[ROW][C]3[/C][C]-0.322307[/C][C]-2.9364[/C][C]0.002148[/C][/ROW]
[ROW][C]4[/C][C]-0.178595[/C][C]-1.6271[/C][C]0.053756[/C][/ROW]
[ROW][C]5[/C][C]0.208267[/C][C]1.8974[/C][C]0.030626[/C][/ROW]
[ROW][C]6[/C][C]0.482185[/C][C]4.3929[/C][C]1.6e-05[/C][/ROW]
[ROW][C]7[/C][C]0.213354[/C][C]1.9437[/C][C]0.027657[/C][/ROW]
[ROW][C]8[/C][C]-0.1698[/C][C]-1.5469[/C][C]0.06284[/C][/ROW]
[ROW][C]9[/C][C]-0.35621[/C][C]-3.2452[/C][C]0.000846[/C][/ROW]
[ROW][C]10[/C][C]-0.37885[/C][C]-3.4515[/C][C]0.00044[/C][/ROW]
[ROW][C]11[/C][C]0.18367[/C][C]1.6733[/C][C]0.049015[/C][/ROW]
[ROW][C]12[/C][C]0.738851[/C][C]6.7312[/C][C]0[/C][/ROW]
[ROW][C]13[/C][C]0.128756[/C][C]1.173[/C][C]0.122071[/C][/ROW]
[ROW][C]14[/C][C]-0.386509[/C][C]-3.5213[/C][C]0.00035[/C][/ROW]
[ROW][C]15[/C][C]-0.301284[/C][C]-2.7448[/C][C]0.00371[/C][/ROW]
[ROW][C]16[/C][C]-0.173777[/C][C]-1.5832[/C][C]0.058591[/C][/ROW]
[ROW][C]17[/C][C]0.146624[/C][C]1.3358[/C][C]0.092631[/C][/ROW]
[ROW][C]18[/C][C]0.334067[/C][C]3.0435[/C][C]0.001566[/C][/ROW]
[ROW][C]19[/C][C]0.163649[/C][C]1.4909[/C][C]0.069887[/C][/ROW]
[ROW][C]20[/C][C]-0.194659[/C][C]-1.7734[/C][C]0.039913[/C][/ROW]
[ROW][C]21[/C][C]-0.372161[/C][C]-3.3905[/C][C]0.000535[/C][/ROW]
[ROW][C]22[/C][C]-0.340335[/C][C]-3.1006[/C][C]0.001319[/C][/ROW]
[ROW][C]23[/C][C]0.13612[/C][C]1.2401[/C][C]0.109215[/C][/ROW]
[ROW][C]24[/C][C]0.558532[/C][C]5.0885[/C][C]1e-06[/C][/ROW]
[ROW][C]25[/C][C]0.107454[/C][C]0.979[/C][C]0.165224[/C][/ROW]
[ROW][C]26[/C][C]-0.344759[/C][C]-3.1409[/C][C]0.001167[/C][/ROW]
[ROW][C]27[/C][C]-0.285597[/C][C]-2.6019[/C][C]0.005488[/C][/ROW]
[ROW][C]28[/C][C]-0.164939[/C][C]-1.5027[/C][C]0.06836[/C][/ROW]
[ROW][C]29[/C][C]0.114443[/C][C]1.0426[/C][C]0.150075[/C][/ROW]
[ROW][C]30[/C][C]0.260536[/C][C]2.3736[/C][C]0.009963[/C][/ROW]
[ROW][C]31[/C][C]0.147503[/C][C]1.3438[/C][C]0.091334[/C][/ROW]
[ROW][C]32[/C][C]-0.136797[/C][C]-1.2463[/C][C]0.108084[/C][/ROW]
[ROW][C]33[/C][C]-0.26091[/C][C]-2.377[/C][C]0.009877[/C][/ROW]
[ROW][C]34[/C][C]-0.219278[/C][C]-1.9977[/C][C]0.024511[/C][/ROW]
[ROW][C]35[/C][C]0.143243[/C][C]1.305[/C][C]0.097748[/C][/ROW]
[ROW][C]36[/C][C]0.448897[/C][C]4.0896[/C][C]5e-05[/C][/ROW]
[ROW][C]37[/C][C]0.078745[/C][C]0.7174[/C][C]0.23757[/C][/ROW]
[ROW][C]38[/C][C]-0.257583[/C][C]-2.3467[/C][C]0.010662[/C][/ROW]
[ROW][C]39[/C][C]-0.16593[/C][C]-1.5117[/C][C]0.067205[/C][/ROW]
[ROW][C]40[/C][C]-0.080398[/C][C]-0.7325[/C][C]0.232976[/C][/ROW]
[ROW][C]41[/C][C]0.11263[/C][C]1.0261[/C][C]0.153911[/C][/ROW]
[ROW][C]42[/C][C]0.220432[/C][C]2.0082[/C][C]0.023935[/C][/ROW]
[ROW][C]43[/C][C]0.104678[/C][C]0.9537[/C][C]0.171511[/C][/ROW]
[ROW][C]44[/C][C]-0.115531[/C][C]-1.0525[/C][C]0.147805[/C][/ROW]
[ROW][C]45[/C][C]-0.188058[/C][C]-1.7133[/C][C]0.045196[/C][/ROW]
[ROW][C]46[/C][C]-0.142514[/C][C]-1.2984[/C][C]0.098879[/C][/ROW]
[ROW][C]47[/C][C]0.090789[/C][C]0.8271[/C][C]0.205269[/C][/ROW]
[ROW][C]48[/C][C]0.357283[/C][C]3.255[/C][C]0.000821[/C][/ROW]
[/TABLE]
Source: https://freestatistics.org/blog/index.php?pk=234299&T=1

Globally Unique Identifier (entire table): ba.freestatistics.org/blog/index.php?pk=234299&T=1

As an alternative you can also use a QR Code:  

The GUIDs for individual cells are displayed in the table below:

Autocorrelation Function
Time lag kACF(k)T-STATP-value
10.2194111.99890.024444
2-0.392789-3.57850.00029
3-0.322307-2.93640.002148
4-0.178595-1.62710.053756
50.2082671.89740.030626
60.4821854.39291.6e-05
70.2133541.94370.027657
8-0.1698-1.54690.06284
9-0.35621-3.24520.000846
10-0.37885-3.45150.00044
110.183671.67330.049015
120.7388516.73120
130.1287561.1730.122071
14-0.386509-3.52130.00035
15-0.301284-2.74480.00371
16-0.173777-1.58320.058591
170.1466241.33580.092631
180.3340673.04350.001566
190.1636491.49090.069887
20-0.194659-1.77340.039913
21-0.372161-3.39050.000535
22-0.340335-3.10060.001319
230.136121.24010.109215
240.5585325.08851e-06
250.1074540.9790.165224
26-0.344759-3.14090.001167
27-0.285597-2.60190.005488
28-0.164939-1.50270.06836
290.1144431.04260.150075
300.2605362.37360.009963
310.1475031.34380.091334
32-0.136797-1.24630.108084
33-0.26091-2.3770.009877
34-0.219278-1.99770.024511
350.1432431.3050.097748
360.4488974.08965e-05
370.0787450.71740.23757
38-0.257583-2.34670.010662
39-0.16593-1.51170.067205
40-0.080398-0.73250.232976
410.112631.02610.153911
420.2204322.00820.023935
430.1046780.95370.171511
44-0.115531-1.05250.147805
45-0.188058-1.71330.045196
46-0.142514-1.29840.098879
470.0907890.82710.205269
480.3572833.2550.000821


Partial Autocorrelation Function
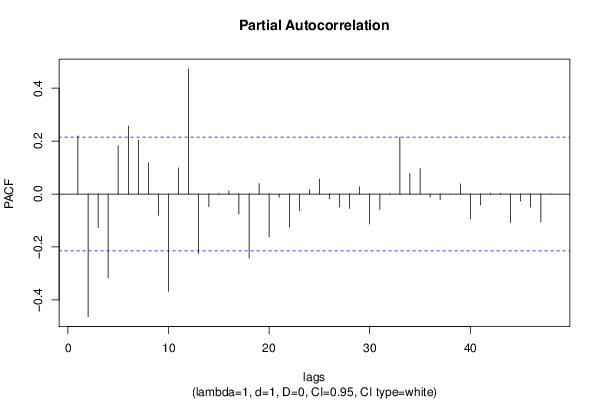
Time lag kPACF(k)T-STATP-value
10.2194111.99890.024444
2-0.463231-4.22023.1e-05
3-0.12649-1.15240.126238
4-0.315712-2.87630.002556
50.1825761.66330.050008
60.2570682.3420.010788
70.2027441.84710.034149
80.1181891.07680.142355
9-0.080524-0.73360.232627
10-0.367813-3.35090.000607
110.0986010.89830.185813
120.4727024.30652.3e-05
13-0.224611-2.04630.021946
14-0.047911-0.43650.331808
150.00210.01910.49239
160.0119210.10860.456889
17-0.073933-0.67360.251231
18-0.242072-2.20540.015096
190.0393130.35820.360566
20-0.16105-1.46720.073045
21-0.012225-0.11140.455793
22-0.125328-1.14180.128411
23-0.063298-0.57670.28286
240.0172660.15730.437695
250.0571070.52030.302131
26-0.017573-0.16010.436598
27-0.048801-0.44460.328885
28-0.053734-0.48950.312877
290.027390.24950.401783
30-0.113325-1.03240.152432
31-0.058081-0.52910.299058
320.0017740.01620.493572
330.2138361.94810.027389
340.0776860.70780.24054
350.0962660.8770.191502
36-0.011411-0.1040.458728
37-0.021591-0.19670.422272
38-1.4e-05-1e-040.499948
390.0379970.34620.365045
40-0.09352-0.8520.198331
41-0.041698-0.37990.352502
420.0029780.02710.489211
430.0027130.02470.490171
44-0.107807-0.98220.164436
45-0.026896-0.2450.403517
46-0.049989-0.45540.324999
47-0.105588-0.9620.169434
48-8.5e-05-8e-040.499693

\begin{tabular}{lllllllll}
\hline
Partial Autocorrelation Function \tabularnewline
Time lag k & PACF(k) & T-STAT & P-value \tabularnewline
1 & 0.219411 & 1.9989 & 0.024444 \tabularnewline
2 & -0.463231 & -4.2202 & 3.1e-05 \tabularnewline
3 & -0.12649 & -1.1524 & 0.126238 \tabularnewline
4 & -0.315712 & -2.8763 & 0.002556 \tabularnewline
5 & 0.182576 & 1.6633 & 0.050008 \tabularnewline
6 & 0.257068 & 2.342 & 0.010788 \tabularnewline
7 & 0.202744 & 1.8471 & 0.034149 \tabularnewline
8 & 0.118189 & 1.0768 & 0.142355 \tabularnewline
9 & -0.080524 & -0.7336 & 0.232627 \tabularnewline
10 & -0.367813 & -3.3509 & 0.000607 \tabularnewline
11 & 0.098601 & 0.8983 & 0.185813 \tabularnewline
12 & 0.472702 & 4.3065 & 2.3e-05 \tabularnewline
13 & -0.224611 & -2.0463 & 0.021946 \tabularnewline
14 & -0.047911 & -0.4365 & 0.331808 \tabularnewline
15 & 0.0021 & 0.0191 & 0.49239 \tabularnewline
16 & 0.011921 & 0.1086 & 0.456889 \tabularnewline
17 & -0.073933 & -0.6736 & 0.251231 \tabularnewline
18 & -0.242072 & -2.2054 & 0.015096 \tabularnewline
19 & 0.039313 & 0.3582 & 0.360566 \tabularnewline
20 & -0.16105 & -1.4672 & 0.073045 \tabularnewline
21 & -0.012225 & -0.1114 & 0.455793 \tabularnewline
22 & -0.125328 & -1.1418 & 0.128411 \tabularnewline
23 & -0.063298 & -0.5767 & 0.28286 \tabularnewline
24 & 0.017266 & 0.1573 & 0.437695 \tabularnewline
25 & 0.057107 & 0.5203 & 0.302131 \tabularnewline
26 & -0.017573 & -0.1601 & 0.436598 \tabularnewline
27 & -0.048801 & -0.4446 & 0.328885 \tabularnewline
28 & -0.053734 & -0.4895 & 0.312877 \tabularnewline
29 & 0.02739 & 0.2495 & 0.401783 \tabularnewline
30 & -0.113325 & -1.0324 & 0.152432 \tabularnewline
31 & -0.058081 & -0.5291 & 0.299058 \tabularnewline
32 & 0.001774 & 0.0162 & 0.493572 \tabularnewline
33 & 0.213836 & 1.9481 & 0.027389 \tabularnewline
34 & 0.077686 & 0.7078 & 0.24054 \tabularnewline
35 & 0.096266 & 0.877 & 0.191502 \tabularnewline
36 & -0.011411 & -0.104 & 0.458728 \tabularnewline
37 & -0.021591 & -0.1967 & 0.422272 \tabularnewline
38 & -1.4e-05 & -1e-04 & 0.499948 \tabularnewline
39 & 0.037997 & 0.3462 & 0.365045 \tabularnewline
40 & -0.09352 & -0.852 & 0.198331 \tabularnewline
41 & -0.041698 & -0.3799 & 0.352502 \tabularnewline
42 & 0.002978 & 0.0271 & 0.489211 \tabularnewline
43 & 0.002713 & 0.0247 & 0.490171 \tabularnewline
44 & -0.107807 & -0.9822 & 0.164436 \tabularnewline
45 & -0.026896 & -0.245 & 0.403517 \tabularnewline
46 & -0.049989 & -0.4554 & 0.324999 \tabularnewline
47 & -0.105588 & -0.962 & 0.169434 \tabularnewline
48 & -8.5e-05 & -8e-04 & 0.499693 \tabularnewline
\hline
\end{tabular}
%Source: https://freestatistics.org/blog/index.php?pk=234299&T=2

[TABLE]
[ROW][C]Partial Autocorrelation Function[/C][/ROW]
[ROW][C]Time lag k[/C][C]PACF(k)[/C][C]T-STAT[/C][C]P-value[/C][/ROW]
[ROW][C]1[/C][C]0.219411[/C][C]1.9989[/C][C]0.024444[/C][/ROW]
[ROW][C]2[/C][C]-0.463231[/C][C]-4.2202[/C][C]3.1e-05[/C][/ROW]
[ROW][C]3[/C][C]-0.12649[/C][C]-1.1524[/C][C]0.126238[/C][/ROW]
[ROW][C]4[/C][C]-0.315712[/C][C]-2.8763[/C][C]0.002556[/C][/ROW]
[ROW][C]5[/C][C]0.182576[/C][C]1.6633[/C][C]0.050008[/C][/ROW]
[ROW][C]6[/C][C]0.257068[/C][C]2.342[/C][C]0.010788[/C][/ROW]
[ROW][C]7[/C][C]0.202744[/C][C]1.8471[/C][C]0.034149[/C][/ROW]
[ROW][C]8[/C][C]0.118189[/C][C]1.0768[/C][C]0.142355[/C][/ROW]
[ROW][C]9[/C][C]-0.080524[/C][C]-0.7336[/C][C]0.232627[/C][/ROW]
[ROW][C]10[/C][C]-0.367813[/C][C]-3.3509[/C][C]0.000607[/C][/ROW]
[ROW][C]11[/C][C]0.098601[/C][C]0.8983[/C][C]0.185813[/C][/ROW]
[ROW][C]12[/C][C]0.472702[/C][C]4.3065[/C][C]2.3e-05[/C][/ROW]
[ROW][C]13[/C][C]-0.224611[/C][C]-2.0463[/C][C]0.021946[/C][/ROW]
[ROW][C]14[/C][C]-0.047911[/C][C]-0.4365[/C][C]0.331808[/C][/ROW]
[ROW][C]15[/C][C]0.0021[/C][C]0.0191[/C][C]0.49239[/C][/ROW]
[ROW][C]16[/C][C]0.011921[/C][C]0.1086[/C][C]0.456889[/C][/ROW]
[ROW][C]17[/C][C]-0.073933[/C][C]-0.6736[/C][C]0.251231[/C][/ROW]
[ROW][C]18[/C][C]-0.242072[/C][C]-2.2054[/C][C]0.015096[/C][/ROW]
[ROW][C]19[/C][C]0.039313[/C][C]0.3582[/C][C]0.360566[/C][/ROW]
[ROW][C]20[/C][C]-0.16105[/C][C]-1.4672[/C][C]0.073045[/C][/ROW]
[ROW][C]21[/C][C]-0.012225[/C][C]-0.1114[/C][C]0.455793[/C][/ROW]
[ROW][C]22[/C][C]-0.125328[/C][C]-1.1418[/C][C]0.128411[/C][/ROW]
[ROW][C]23[/C][C]-0.063298[/C][C]-0.5767[/C][C]0.28286[/C][/ROW]
[ROW][C]24[/C][C]0.017266[/C][C]0.1573[/C][C]0.437695[/C][/ROW]
[ROW][C]25[/C][C]0.057107[/C][C]0.5203[/C][C]0.302131[/C][/ROW]
[ROW][C]26[/C][C]-0.017573[/C][C]-0.1601[/C][C]0.436598[/C][/ROW]
[ROW][C]27[/C][C]-0.048801[/C][C]-0.4446[/C][C]0.328885[/C][/ROW]
[ROW][C]28[/C][C]-0.053734[/C][C]-0.4895[/C][C]0.312877[/C][/ROW]
[ROW][C]29[/C][C]0.02739[/C][C]0.2495[/C][C]0.401783[/C][/ROW]
[ROW][C]30[/C][C]-0.113325[/C][C]-1.0324[/C][C]0.152432[/C][/ROW]
[ROW][C]31[/C][C]-0.058081[/C][C]-0.5291[/C][C]0.299058[/C][/ROW]
[ROW][C]32[/C][C]0.001774[/C][C]0.0162[/C][C]0.493572[/C][/ROW]
[ROW][C]33[/C][C]0.213836[/C][C]1.9481[/C][C]0.027389[/C][/ROW]
[ROW][C]34[/C][C]0.077686[/C][C]0.7078[/C][C]0.24054[/C][/ROW]
[ROW][C]35[/C][C]0.096266[/C][C]0.877[/C][C]0.191502[/C][/ROW]
[ROW][C]36[/C][C]-0.011411[/C][C]-0.104[/C][C]0.458728[/C][/ROW]
[ROW][C]37[/C][C]-0.021591[/C][C]-0.1967[/C][C]0.422272[/C][/ROW]
[ROW][C]38[/C][C]-1.4e-05[/C][C]-1e-04[/C][C]0.499948[/C][/ROW]
[ROW][C]39[/C][C]0.037997[/C][C]0.3462[/C][C]0.365045[/C][/ROW]
[ROW][C]40[/C][C]-0.09352[/C][C]-0.852[/C][C]0.198331[/C][/ROW]
[ROW][C]41[/C][C]-0.041698[/C][C]-0.3799[/C][C]0.352502[/C][/ROW]
[ROW][C]42[/C][C]0.002978[/C][C]0.0271[/C][C]0.489211[/C][/ROW]
[ROW][C]43[/C][C]0.002713[/C][C]0.0247[/C][C]0.490171[/C][/ROW]
[ROW][C]44[/C][C]-0.107807[/C][C]-0.9822[/C][C]0.164436[/C][/ROW]
[ROW][C]45[/C][C]-0.026896[/C][C]-0.245[/C][C]0.403517[/C][/ROW]
[ROW][C]46[/C][C]-0.049989[/C][C]-0.4554[/C][C]0.324999[/C][/ROW]
[ROW][C]47[/C][C]-0.105588[/C][C]-0.962[/C][C]0.169434[/C][/ROW]
[ROW][C]48[/C][C]-8.5e-05[/C][C]-8e-04[/C][C]0.499693[/C][/ROW]
[/TABLE]
Source: https://freestatistics.org/blog/index.php?pk=234299&T=2

Globally Unique Identifier (entire table): ba.freestatistics.org/blog/index.php?pk=234299&T=2

As an alternative you can also use a QR Code:  

The GUIDs for individual cells are displayed in the table below:

Partial Autocorrelation Function
Time lag kPACF(k)T-STATP-value
10.2194111.99890.024444
2-0.463231-4.22023.1e-05
3-0.12649-1.15240.126238
4-0.315712-2.87630.002556
50.1825761.66330.050008
60.2570682.3420.010788
70.2027441.84710.034149
80.1181891.07680.142355
9-0.080524-0.73360.232627
10-0.367813-3.35090.000607
110.0986010.89830.185813
120.4727024.30652.3e-05
13-0.224611-2.04630.021946
14-0.047911-0.43650.331808
150.00210.01910.49239
160.0119210.10860.456889
17-0.073933-0.67360.251231
18-0.242072-2.20540.015096
190.0393130.35820.360566
20-0.16105-1.46720.073045
21-0.012225-0.11140.455793
22-0.125328-1.14180.128411
23-0.063298-0.57670.28286
240.0172660.15730.437695
250.0571070.52030.302131
26-0.017573-0.16010.436598
27-0.048801-0.44460.328885
28-0.053734-0.48950.312877
290.027390.24950.401783
30-0.113325-1.03240.152432
31-0.058081-0.52910.299058
320.0017740.01620.493572
330.2138361.94810.027389
340.0776860.70780.24054
350.0962660.8770.191502
36-0.011411-0.1040.458728
37-0.021591-0.19670.422272
38-1.4e-05-1e-040.499948
390.0379970.34620.365045
40-0.09352-0.8520.198331
41-0.041698-0.37990.352502
420.0029780.02710.489211
430.0027130.02470.490171
44-0.107807-0.98220.164436
45-0.026896-0.2450.403517
46-0.049989-0.45540.324999
47-0.105588-0.9620.169434
48-8.5e-05-8e-040.499693


Parameters (Session):
par1 = 48 ; par2 = 1 ; par3 = 1 ; par4 = 0 ; par5 = 12 ; par6 = White Noise ; par7 = 0.95 ;
Parameters (R input):
par1 = 48 ; par2 = 1 ; par3 = 1 ; par4 = 0 ; par5 = 12 ; par6 = White Noise ; par7 = 0.95 ; par8 = ;
R code (references can be found in the software module):
par8 <- ''
par7 <- '0.95'
par6 <- 'White Noise'
par5 <- '12'
par4 <- '0'
par3 <- '0'
par2 <- '1'
par1 <- '48'
if (par1 == 'Default') {
par1 = 10*log10(length(x))
} else {
par1 <- as.numeric(par1)
}
par2 <- as.numeric(par2)
par3 <- as.numeric(par3)
par4 <- as.numeric(par4)
par5 <- as.numeric(par5)
if (par6 == 'White Noise') par6 <- 'white' else par6 <- 'ma'
par7 <- as.numeric(par7)
if (par8 != '') par8 <- as.numeric(par8)
ox <- x
if (par8 == '') {
if (par2 == 0) {
x <- log(x)
} else {
x <- (x ^ par2 - 1) / par2
}
} else {
x <- log(x,base=par8)
}
if (par3 > 0) x <- diff(x,lag=1,difference=par3)
if (par4 > 0) x <- diff(x,lag=par5,difference=par4)
bitmap(file='picts.png')
op <- par(mfrow=c(2,1))
plot(ox,type='l',main='Original Time Series',xlab='time',ylab='value')
if (par8=='') {
mytitle <- paste('Working Time Series (lambda=',par2,', d=',par3,', D=',par4,')',sep='')
mysub <- paste('(lambda=',par2,', d=',par3,', D=',par4,', CI=', par7, ', CI type=',par6,')',sep='')
} else {
mytitle <- paste('Working Time Series (base=',par8,', d=',par3,', D=',par4,')',sep='')
mysub <- paste('(base=',par8,', d=',par3,', D=',par4,', CI=', par7, ', CI type=',par6,')',sep='')
}
plot(x,type='l', main=mytitle,xlab='time',ylab='value')
par(op)
dev.off()
bitmap(file='pic1.png')
racf <- acf(x, par1, main='Autocorrelation', xlab='time lag', ylab='ACF', ci.type=par6, ci=par7, sub=mysub)
dev.off()
bitmap(file='pic2.png')
rpacf <- pacf(x,par1,main='Partial Autocorrelation',xlab='lags',ylab='PACF',sub=mysub)
dev.off()
(myacf <- c(racf$acf))
(mypacf <- c(rpacf$acf))
lengthx <- length(x)
sqrtn <- sqrt(lengthx)
load(file='createtable')
a<-table.start()
a<-table.row.start(a)
a<-table.element(a,'Autocorrelation Function',4,TRUE)
a<-table.row.end(a)
a<-table.row.start(a)
a<-table.element(a,'Time lag k',header=TRUE)
a<-table.element(a,hyperlink('basics.htm','ACF(k)','click here for more information about the Autocorrelation Function'),header=TRUE)
a<-table.element(a,'T-STAT',header=TRUE)
a<-table.element(a,'P-value',header=TRUE)
a<-table.row.end(a)
for (i in 2:(par1+1)) {
a<-table.row.start(a)
a<-table.element(a,i-1,header=TRUE)
a<-table.element(a,round(myacf[i],6))
mytstat <- myacf[i]*sqrtn
a<-table.element(a,round(mytstat,4))
a<-table.element(a,round(1-pt(abs(mytstat),lengthx),6))
a<-table.row.end(a)
}
a<-table.end(a)
table.save(a,file='mytable.tab')
a<-table.start()
a<-table.row.start(a)
a<-table.element(a,'Partial Autocorrelation Function',4,TRUE)
a<-table.row.end(a)
a<-table.row.start(a)
a<-table.element(a,'Time lag k',header=TRUE)
a<-table.element(a,hyperlink('basics.htm','PACF(k)','click here for more information about the Partial Autocorrelation Function'),header=TRUE)
a<-table.element(a,'T-STAT',header=TRUE)
a<-table.element(a,'P-value',header=TRUE)
a<-table.row.end(a)
for (i in 1:par1) {
a<-table.row.start(a)
a<-table.element(a,i,header=TRUE)
a<-table.element(a,round(mypacf[i],6))
mytstat <- mypacf[i]*sqrtn
a<-table.element(a,round(mytstat,4))
a<-table.element(a,round(1-pt(abs(mytstat),lengthx),6))
a<-table.row.end(a)
}
a<-table.end(a)
table.save(a,file='mytable1.tab')