Free Statistics

of Irreproducible Research!

Author's title

Author*Unverified author*
R Software Modulerwasp_autocorrelation.wasp
Title produced by software(Partial) Autocorrelation Function
Date of computationMon, 17 Mar 2014 11:28:58 -0400
Cite this page as followsStatistical Computations at FreeStatistics.org, Office for Research Development and Education, URL https://freestatistics.org/blog/index.php?v=date/2014/Mar/17/t13950701654gkzu43p01mqwjz.htm/, Retrieved Tue, 14 May 2024 03:10:36 +0000
Statistical Computations at FreeStatistics.org, Office for Research Development and Education, URL https://freestatistics.org/blog/index.php?pk=234298, Retrieved Tue, 14 May 2024 03:10:36 +0000
QR Codes:

Original text written by user:
IsPrivate?No (this computation is public)
User-defined keywords
Estimated Impact92
Family? (F = Feedback message, R = changed R code, M = changed R Module, P = changed Parameters, D = changed Data)
-       [(Partial) Autocorrelation Function] [] [2014-03-17 15:28:58] [7373f181761c5c20212e36e73239e9d6] [Current]
Feedback Forum

Post a new message
Dataseries X:
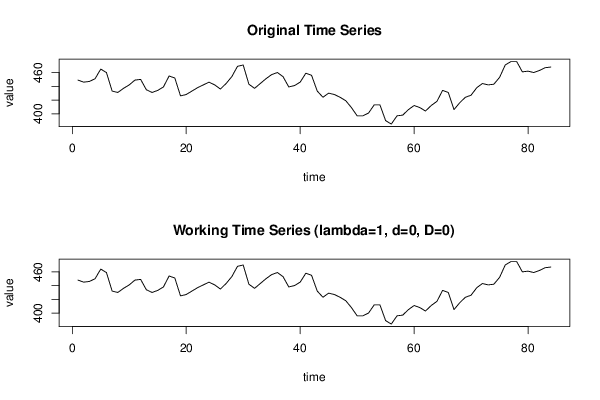
449
446
447
451
465
460
433
431
437
442
449
450
435
431
434
439
455
452
426
428
433
438
442
446
442
436
444
454
469
471
443
437
444
451
457
460
454
439
441
446
459
456
433
424
430
428
424
419
409
397
397
401
413
413
390
385
397
398
406
412
409
404
412
418
434
431
406
416
424
427
438
444
442
443
453
471
476
476
461
462
460
463
467
468


Summary of computational transaction
Raw Inputview raw input (R code)
Raw Outputview raw output of R engine
Computing time3 seconds
R Server'Gwilym Jenkins' @ jenkins.wessa.net

\begin{tabular}{lllllllll}
\hline
Summary of computational transaction \tabularnewline
Raw Input & view raw input (R code)  \tabularnewline
Raw Output & view raw output of R engine  \tabularnewline
Computing time & 3 seconds \tabularnewline
R Server & 'Gwilym Jenkins' @ jenkins.wessa.net \tabularnewline
\hline
\end{tabular}
%Source: https://freestatistics.org/blog/index.php?pk=234298&T=0

[TABLE]
[ROW][C]Summary of computational transaction[/C][/ROW]
[ROW][C]Raw Input[/C][C]view raw input (R code) [/C][/ROW]
[ROW][C]Raw Output[/C][C]view raw output of R engine [/C][/ROW]
[ROW][C]Computing time[/C][C]3 seconds[/C][/ROW]
[ROW][C]R Server[/C][C]'Gwilym Jenkins' @ jenkins.wessa.net[/C][/ROW]
[/TABLE]
Source: https://freestatistics.org/blog/index.php?pk=234298&T=0

Globally Unique Identifier (entire table): ba.freestatistics.org/blog/index.php?pk=234298&T=0

As an alternative you can also use a QR Code:  

The GUIDs for individual cells are displayed in the table below:

Summary of computational transaction
Raw Inputview raw input (R code)
Raw Outputview raw output of R engine
Computing time3 seconds
R Server'Gwilym Jenkins' @ jenkins.wessa.net


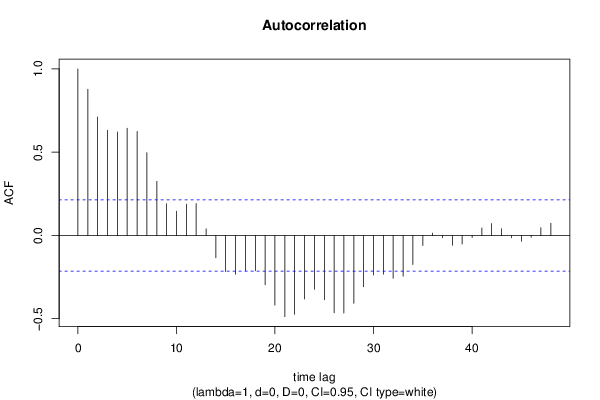
Autocorrelation Function
Time lag kACF(k)T-STATP-value
10.8784448.05110
20.7115386.52140
30.6315485.78820
40.6216745.69770
50.6440365.90270
60.6241755.72070
70.4971644.55669e-06
80.3248252.97710.001901
90.1907851.74860.042009
100.1459161.33730.09236
110.1880691.72370.044223
120.1914251.75440.041501
130.0396210.36310.358709
14-0.1337-1.22540.111928
15-0.216296-1.98240.025352
16-0.233464-2.13970.017639
17-0.21177-1.94090.027812
18-0.212188-1.94470.027576
19-0.296236-2.7150.004021
20-0.418435-3.8350.000121
21-0.487528-4.46831.2e-05
22-0.473535-4.342e-05
23-0.381269-3.49440.000381
24-0.323255-2.96270.001983
25-0.385843-3.53630.000332
26-0.464556-4.25772.7e-05
27-0.465261-4.26422.6e-05
28-0.406851-3.72880.000174
29-0.30767-2.81980.002996
30-0.23722-2.17420.016253
31-0.232219-2.12830.01812
32-0.256813-2.35370.010461
33-0.2444-2.240.013867
34-0.174815-1.60220.056432
35-0.059856-0.54860.29237
360.0140450.12870.448943
37-0.014204-0.13020.448366
38-0.058607-0.53710.296296
39-0.051699-0.47380.318425
40-0.012412-0.11380.45485
410.0450120.41250.340498
420.0720670.66050.255369
430.0403560.36990.356204
44-0.013633-0.12490.450433
45-0.034413-0.31540.376618
46-0.0104-0.09530.462146
470.0468470.42940.33438
480.0738230.67660.25026

\begin{tabular}{lllllllll}
\hline
Autocorrelation Function \tabularnewline
Time lag k & ACF(k) & T-STAT & P-value \tabularnewline
1 & 0.878444 & 8.0511 & 0 \tabularnewline
2 & 0.711538 & 6.5214 & 0 \tabularnewline
3 & 0.631548 & 5.7882 & 0 \tabularnewline
4 & 0.621674 & 5.6977 & 0 \tabularnewline
5 & 0.644036 & 5.9027 & 0 \tabularnewline
6 & 0.624175 & 5.7207 & 0 \tabularnewline
7 & 0.497164 & 4.5566 & 9e-06 \tabularnewline
8 & 0.324825 & 2.9771 & 0.001901 \tabularnewline
9 & 0.190785 & 1.7486 & 0.042009 \tabularnewline
10 & 0.145916 & 1.3373 & 0.09236 \tabularnewline
11 & 0.188069 & 1.7237 & 0.044223 \tabularnewline
12 & 0.191425 & 1.7544 & 0.041501 \tabularnewline
13 & 0.039621 & 0.3631 & 0.358709 \tabularnewline
14 & -0.1337 & -1.2254 & 0.111928 \tabularnewline
15 & -0.216296 & -1.9824 & 0.025352 \tabularnewline
16 & -0.233464 & -2.1397 & 0.017639 \tabularnewline
17 & -0.21177 & -1.9409 & 0.027812 \tabularnewline
18 & -0.212188 & -1.9447 & 0.027576 \tabularnewline
19 & -0.296236 & -2.715 & 0.004021 \tabularnewline
20 & -0.418435 & -3.835 & 0.000121 \tabularnewline
21 & -0.487528 & -4.4683 & 1.2e-05 \tabularnewline
22 & -0.473535 & -4.34 & 2e-05 \tabularnewline
23 & -0.381269 & -3.4944 & 0.000381 \tabularnewline
24 & -0.323255 & -2.9627 & 0.001983 \tabularnewline
25 & -0.385843 & -3.5363 & 0.000332 \tabularnewline
26 & -0.464556 & -4.2577 & 2.7e-05 \tabularnewline
27 & -0.465261 & -4.2642 & 2.6e-05 \tabularnewline
28 & -0.406851 & -3.7288 & 0.000174 \tabularnewline
29 & -0.30767 & -2.8198 & 0.002996 \tabularnewline
30 & -0.23722 & -2.1742 & 0.016253 \tabularnewline
31 & -0.232219 & -2.1283 & 0.01812 \tabularnewline
32 & -0.256813 & -2.3537 & 0.010461 \tabularnewline
33 & -0.2444 & -2.24 & 0.013867 \tabularnewline
34 & -0.174815 & -1.6022 & 0.056432 \tabularnewline
35 & -0.059856 & -0.5486 & 0.29237 \tabularnewline
36 & 0.014045 & 0.1287 & 0.448943 \tabularnewline
37 & -0.014204 & -0.1302 & 0.448366 \tabularnewline
38 & -0.058607 & -0.5371 & 0.296296 \tabularnewline
39 & -0.051699 & -0.4738 & 0.318425 \tabularnewline
40 & -0.012412 & -0.1138 & 0.45485 \tabularnewline
41 & 0.045012 & 0.4125 & 0.340498 \tabularnewline
42 & 0.072067 & 0.6605 & 0.255369 \tabularnewline
43 & 0.040356 & 0.3699 & 0.356204 \tabularnewline
44 & -0.013633 & -0.1249 & 0.450433 \tabularnewline
45 & -0.034413 & -0.3154 & 0.376618 \tabularnewline
46 & -0.0104 & -0.0953 & 0.462146 \tabularnewline
47 & 0.046847 & 0.4294 & 0.33438 \tabularnewline
48 & 0.073823 & 0.6766 & 0.25026 \tabularnewline
\hline
\end{tabular}
%Source: https://freestatistics.org/blog/index.php?pk=234298&T=1

[TABLE]
[ROW][C]Autocorrelation Function[/C][/ROW]
[ROW][C]Time lag k[/C][C]ACF(k)[/C][C]T-STAT[/C][C]P-value[/C][/ROW]
[ROW][C]1[/C][C]0.878444[/C][C]8.0511[/C][C]0[/C][/ROW]
[ROW][C]2[/C][C]0.711538[/C][C]6.5214[/C][C]0[/C][/ROW]
[ROW][C]3[/C][C]0.631548[/C][C]5.7882[/C][C]0[/C][/ROW]
[ROW][C]4[/C][C]0.621674[/C][C]5.6977[/C][C]0[/C][/ROW]
[ROW][C]5[/C][C]0.644036[/C][C]5.9027[/C][C]0[/C][/ROW]
[ROW][C]6[/C][C]0.624175[/C][C]5.7207[/C][C]0[/C][/ROW]
[ROW][C]7[/C][C]0.497164[/C][C]4.5566[/C][C]9e-06[/C][/ROW]
[ROW][C]8[/C][C]0.324825[/C][C]2.9771[/C][C]0.001901[/C][/ROW]
[ROW][C]9[/C][C]0.190785[/C][C]1.7486[/C][C]0.042009[/C][/ROW]
[ROW][C]10[/C][C]0.145916[/C][C]1.3373[/C][C]0.09236[/C][/ROW]
[ROW][C]11[/C][C]0.188069[/C][C]1.7237[/C][C]0.044223[/C][/ROW]
[ROW][C]12[/C][C]0.191425[/C][C]1.7544[/C][C]0.041501[/C][/ROW]
[ROW][C]13[/C][C]0.039621[/C][C]0.3631[/C][C]0.358709[/C][/ROW]
[ROW][C]14[/C][C]-0.1337[/C][C]-1.2254[/C][C]0.111928[/C][/ROW]
[ROW][C]15[/C][C]-0.216296[/C][C]-1.9824[/C][C]0.025352[/C][/ROW]
[ROW][C]16[/C][C]-0.233464[/C][C]-2.1397[/C][C]0.017639[/C][/ROW]
[ROW][C]17[/C][C]-0.21177[/C][C]-1.9409[/C][C]0.027812[/C][/ROW]
[ROW][C]18[/C][C]-0.212188[/C][C]-1.9447[/C][C]0.027576[/C][/ROW]
[ROW][C]19[/C][C]-0.296236[/C][C]-2.715[/C][C]0.004021[/C][/ROW]
[ROW][C]20[/C][C]-0.418435[/C][C]-3.835[/C][C]0.000121[/C][/ROW]
[ROW][C]21[/C][C]-0.487528[/C][C]-4.4683[/C][C]1.2e-05[/C][/ROW]
[ROW][C]22[/C][C]-0.473535[/C][C]-4.34[/C][C]2e-05[/C][/ROW]
[ROW][C]23[/C][C]-0.381269[/C][C]-3.4944[/C][C]0.000381[/C][/ROW]
[ROW][C]24[/C][C]-0.323255[/C][C]-2.9627[/C][C]0.001983[/C][/ROW]
[ROW][C]25[/C][C]-0.385843[/C][C]-3.5363[/C][C]0.000332[/C][/ROW]
[ROW][C]26[/C][C]-0.464556[/C][C]-4.2577[/C][C]2.7e-05[/C][/ROW]
[ROW][C]27[/C][C]-0.465261[/C][C]-4.2642[/C][C]2.6e-05[/C][/ROW]
[ROW][C]28[/C][C]-0.406851[/C][C]-3.7288[/C][C]0.000174[/C][/ROW]
[ROW][C]29[/C][C]-0.30767[/C][C]-2.8198[/C][C]0.002996[/C][/ROW]
[ROW][C]30[/C][C]-0.23722[/C][C]-2.1742[/C][C]0.016253[/C][/ROW]
[ROW][C]31[/C][C]-0.232219[/C][C]-2.1283[/C][C]0.01812[/C][/ROW]
[ROW][C]32[/C][C]-0.256813[/C][C]-2.3537[/C][C]0.010461[/C][/ROW]
[ROW][C]33[/C][C]-0.2444[/C][C]-2.24[/C][C]0.013867[/C][/ROW]
[ROW][C]34[/C][C]-0.174815[/C][C]-1.6022[/C][C]0.056432[/C][/ROW]
[ROW][C]35[/C][C]-0.059856[/C][C]-0.5486[/C][C]0.29237[/C][/ROW]
[ROW][C]36[/C][C]0.014045[/C][C]0.1287[/C][C]0.448943[/C][/ROW]
[ROW][C]37[/C][C]-0.014204[/C][C]-0.1302[/C][C]0.448366[/C][/ROW]
[ROW][C]38[/C][C]-0.058607[/C][C]-0.5371[/C][C]0.296296[/C][/ROW]
[ROW][C]39[/C][C]-0.051699[/C][C]-0.4738[/C][C]0.318425[/C][/ROW]
[ROW][C]40[/C][C]-0.012412[/C][C]-0.1138[/C][C]0.45485[/C][/ROW]
[ROW][C]41[/C][C]0.045012[/C][C]0.4125[/C][C]0.340498[/C][/ROW]
[ROW][C]42[/C][C]0.072067[/C][C]0.6605[/C][C]0.255369[/C][/ROW]
[ROW][C]43[/C][C]0.040356[/C][C]0.3699[/C][C]0.356204[/C][/ROW]
[ROW][C]44[/C][C]-0.013633[/C][C]-0.1249[/C][C]0.450433[/C][/ROW]
[ROW][C]45[/C][C]-0.034413[/C][C]-0.3154[/C][C]0.376618[/C][/ROW]
[ROW][C]46[/C][C]-0.0104[/C][C]-0.0953[/C][C]0.462146[/C][/ROW]
[ROW][C]47[/C][C]0.046847[/C][C]0.4294[/C][C]0.33438[/C][/ROW]
[ROW][C]48[/C][C]0.073823[/C][C]0.6766[/C][C]0.25026[/C][/ROW]
[/TABLE]
Source: https://freestatistics.org/blog/index.php?pk=234298&T=1

Globally Unique Identifier (entire table): ba.freestatistics.org/blog/index.php?pk=234298&T=1

As an alternative you can also use a QR Code:  

The GUIDs for individual cells are displayed in the table below:

Autocorrelation Function
Time lag kACF(k)T-STATP-value
10.8784448.05110
20.7115386.52140
30.6315485.78820
40.6216745.69770
50.6440365.90270
60.6241755.72070
70.4971644.55669e-06
80.3248252.97710.001901
90.1907851.74860.042009
100.1459161.33730.09236
110.1880691.72370.044223
120.1914251.75440.041501
130.0396210.36310.358709
14-0.1337-1.22540.111928
15-0.216296-1.98240.025352
16-0.233464-2.13970.017639
17-0.21177-1.94090.027812
18-0.212188-1.94470.027576
19-0.296236-2.7150.004021
20-0.418435-3.8350.000121
21-0.487528-4.46831.2e-05
22-0.473535-4.342e-05
23-0.381269-3.49440.000381
24-0.323255-2.96270.001983
25-0.385843-3.53630.000332
26-0.464556-4.25772.7e-05
27-0.465261-4.26422.6e-05
28-0.406851-3.72880.000174
29-0.30767-2.81980.002996
30-0.23722-2.17420.016253
31-0.232219-2.12830.01812
32-0.256813-2.35370.010461
33-0.2444-2.240.013867
34-0.174815-1.60220.056432
35-0.059856-0.54860.29237
360.0140450.12870.448943
37-0.014204-0.13020.448366
38-0.058607-0.53710.296296
39-0.051699-0.47380.318425
40-0.012412-0.11380.45485
410.0450120.41250.340498
420.0720670.66050.255369
430.0403560.36990.356204
44-0.013633-0.12490.450433
45-0.034413-0.31540.376618
46-0.0104-0.09530.462146
470.0468470.42940.33438
480.0738230.67660.25026


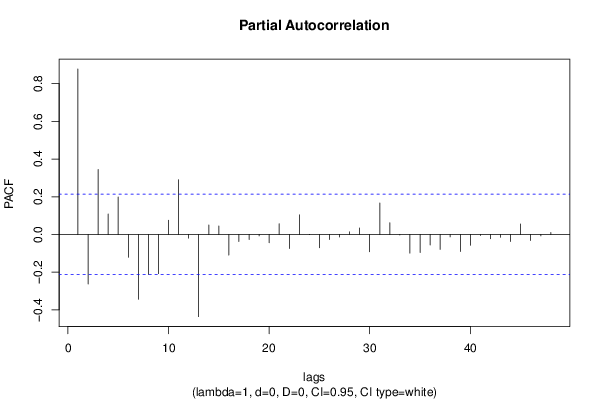
Partial Autocorrelation Function
Time lag kPACF(k)T-STATP-value
10.8784448.05110
2-0.263324-2.41340.008989
30.3445953.15830.001103
40.1082050.99170.162092
50.1986741.82090.036093
6-0.121143-1.11030.135021
7-0.344566-3.1580.001104
8-0.212697-1.94940.027292
9-0.208315-1.90920.029823
100.0757240.6940.244793
110.2905892.66330.004637
12-0.01978-0.18130.428288
13-0.436477-4.00046.8e-05
140.0498350.45670.324517
150.0444840.40770.342266
16-0.109736-1.00570.158712
17-0.037844-0.34680.364787
18-0.027084-0.24820.40228
19-0.007611-0.06980.472278
20-0.044405-0.4070.34253
210.0568830.52130.301751
22-0.074979-0.68720.246928
230.1037540.95090.172186
24-0.001158-0.01060.495777
25-0.070519-0.64630.259918
26-0.026645-0.24420.403832
27-0.013942-0.12780.449313
280.0137110.12570.450148
290.0340540.31210.377864
30-0.091703-0.84050.201516
310.1670881.53140.064716
320.0622940.57090.284785
33-0.002695-0.02470.490176
34-0.099459-0.91160.182305
35-0.096173-0.88140.190297
36-0.055878-0.51210.304953
37-0.079461-0.72830.234236
38-0.012925-0.11850.452994
39-0.091017-0.83420.203272
40-0.057453-0.52660.299942
41-0.006173-0.05660.477508
42-0.022554-0.20670.418368
43-0.014887-0.13640.445899
44-0.037437-0.34310.366184
450.0557290.51080.305429
46-0.032632-0.29910.38281
47-0.007929-0.07270.471119
480.0107020.09810.461051

\begin{tabular}{lllllllll}
\hline
Partial Autocorrelation Function \tabularnewline
Time lag k & PACF(k) & T-STAT & P-value \tabularnewline
1 & 0.878444 & 8.0511 & 0 \tabularnewline
2 & -0.263324 & -2.4134 & 0.008989 \tabularnewline
3 & 0.344595 & 3.1583 & 0.001103 \tabularnewline
4 & 0.108205 & 0.9917 & 0.162092 \tabularnewline
5 & 0.198674 & 1.8209 & 0.036093 \tabularnewline
6 & -0.121143 & -1.1103 & 0.135021 \tabularnewline
7 & -0.344566 & -3.158 & 0.001104 \tabularnewline
8 & -0.212697 & -1.9494 & 0.027292 \tabularnewline
9 & -0.208315 & -1.9092 & 0.029823 \tabularnewline
10 & 0.075724 & 0.694 & 0.244793 \tabularnewline
11 & 0.290589 & 2.6633 & 0.004637 \tabularnewline
12 & -0.01978 & -0.1813 & 0.428288 \tabularnewline
13 & -0.436477 & -4.0004 & 6.8e-05 \tabularnewline
14 & 0.049835 & 0.4567 & 0.324517 \tabularnewline
15 & 0.044484 & 0.4077 & 0.342266 \tabularnewline
16 & -0.109736 & -1.0057 & 0.158712 \tabularnewline
17 & -0.037844 & -0.3468 & 0.364787 \tabularnewline
18 & -0.027084 & -0.2482 & 0.40228 \tabularnewline
19 & -0.007611 & -0.0698 & 0.472278 \tabularnewline
20 & -0.044405 & -0.407 & 0.34253 \tabularnewline
21 & 0.056883 & 0.5213 & 0.301751 \tabularnewline
22 & -0.074979 & -0.6872 & 0.246928 \tabularnewline
23 & 0.103754 & 0.9509 & 0.172186 \tabularnewline
24 & -0.001158 & -0.0106 & 0.495777 \tabularnewline
25 & -0.070519 & -0.6463 & 0.259918 \tabularnewline
26 & -0.026645 & -0.2442 & 0.403832 \tabularnewline
27 & -0.013942 & -0.1278 & 0.449313 \tabularnewline
28 & 0.013711 & 0.1257 & 0.450148 \tabularnewline
29 & 0.034054 & 0.3121 & 0.377864 \tabularnewline
30 & -0.091703 & -0.8405 & 0.201516 \tabularnewline
31 & 0.167088 & 1.5314 & 0.064716 \tabularnewline
32 & 0.062294 & 0.5709 & 0.284785 \tabularnewline
33 & -0.002695 & -0.0247 & 0.490176 \tabularnewline
34 & -0.099459 & -0.9116 & 0.182305 \tabularnewline
35 & -0.096173 & -0.8814 & 0.190297 \tabularnewline
36 & -0.055878 & -0.5121 & 0.304953 \tabularnewline
37 & -0.079461 & -0.7283 & 0.234236 \tabularnewline
38 & -0.012925 & -0.1185 & 0.452994 \tabularnewline
39 & -0.091017 & -0.8342 & 0.203272 \tabularnewline
40 & -0.057453 & -0.5266 & 0.299942 \tabularnewline
41 & -0.006173 & -0.0566 & 0.477508 \tabularnewline
42 & -0.022554 & -0.2067 & 0.418368 \tabularnewline
43 & -0.014887 & -0.1364 & 0.445899 \tabularnewline
44 & -0.037437 & -0.3431 & 0.366184 \tabularnewline
45 & 0.055729 & 0.5108 & 0.305429 \tabularnewline
46 & -0.032632 & -0.2991 & 0.38281 \tabularnewline
47 & -0.007929 & -0.0727 & 0.471119 \tabularnewline
48 & 0.010702 & 0.0981 & 0.461051 \tabularnewline
\hline
\end{tabular}
%Source: https://freestatistics.org/blog/index.php?pk=234298&T=2

[TABLE]
[ROW][C]Partial Autocorrelation Function[/C][/ROW]
[ROW][C]Time lag k[/C][C]PACF(k)[/C][C]T-STAT[/C][C]P-value[/C][/ROW]
[ROW][C]1[/C][C]0.878444[/C][C]8.0511[/C][C]0[/C][/ROW]
[ROW][C]2[/C][C]-0.263324[/C][C]-2.4134[/C][C]0.008989[/C][/ROW]
[ROW][C]3[/C][C]0.344595[/C][C]3.1583[/C][C]0.001103[/C][/ROW]
[ROW][C]4[/C][C]0.108205[/C][C]0.9917[/C][C]0.162092[/C][/ROW]
[ROW][C]5[/C][C]0.198674[/C][C]1.8209[/C][C]0.036093[/C][/ROW]
[ROW][C]6[/C][C]-0.121143[/C][C]-1.1103[/C][C]0.135021[/C][/ROW]
[ROW][C]7[/C][C]-0.344566[/C][C]-3.158[/C][C]0.001104[/C][/ROW]
[ROW][C]8[/C][C]-0.212697[/C][C]-1.9494[/C][C]0.027292[/C][/ROW]
[ROW][C]9[/C][C]-0.208315[/C][C]-1.9092[/C][C]0.029823[/C][/ROW]
[ROW][C]10[/C][C]0.075724[/C][C]0.694[/C][C]0.244793[/C][/ROW]
[ROW][C]11[/C][C]0.290589[/C][C]2.6633[/C][C]0.004637[/C][/ROW]
[ROW][C]12[/C][C]-0.01978[/C][C]-0.1813[/C][C]0.428288[/C][/ROW]
[ROW][C]13[/C][C]-0.436477[/C][C]-4.0004[/C][C]6.8e-05[/C][/ROW]
[ROW][C]14[/C][C]0.049835[/C][C]0.4567[/C][C]0.324517[/C][/ROW]
[ROW][C]15[/C][C]0.044484[/C][C]0.4077[/C][C]0.342266[/C][/ROW]
[ROW][C]16[/C][C]-0.109736[/C][C]-1.0057[/C][C]0.158712[/C][/ROW]
[ROW][C]17[/C][C]-0.037844[/C][C]-0.3468[/C][C]0.364787[/C][/ROW]
[ROW][C]18[/C][C]-0.027084[/C][C]-0.2482[/C][C]0.40228[/C][/ROW]
[ROW][C]19[/C][C]-0.007611[/C][C]-0.0698[/C][C]0.472278[/C][/ROW]
[ROW][C]20[/C][C]-0.044405[/C][C]-0.407[/C][C]0.34253[/C][/ROW]
[ROW][C]21[/C][C]0.056883[/C][C]0.5213[/C][C]0.301751[/C][/ROW]
[ROW][C]22[/C][C]-0.074979[/C][C]-0.6872[/C][C]0.246928[/C][/ROW]
[ROW][C]23[/C][C]0.103754[/C][C]0.9509[/C][C]0.172186[/C][/ROW]
[ROW][C]24[/C][C]-0.001158[/C][C]-0.0106[/C][C]0.495777[/C][/ROW]
[ROW][C]25[/C][C]-0.070519[/C][C]-0.6463[/C][C]0.259918[/C][/ROW]
[ROW][C]26[/C][C]-0.026645[/C][C]-0.2442[/C][C]0.403832[/C][/ROW]
[ROW][C]27[/C][C]-0.013942[/C][C]-0.1278[/C][C]0.449313[/C][/ROW]
[ROW][C]28[/C][C]0.013711[/C][C]0.1257[/C][C]0.450148[/C][/ROW]
[ROW][C]29[/C][C]0.034054[/C][C]0.3121[/C][C]0.377864[/C][/ROW]
[ROW][C]30[/C][C]-0.091703[/C][C]-0.8405[/C][C]0.201516[/C][/ROW]
[ROW][C]31[/C][C]0.167088[/C][C]1.5314[/C][C]0.064716[/C][/ROW]
[ROW][C]32[/C][C]0.062294[/C][C]0.5709[/C][C]0.284785[/C][/ROW]
[ROW][C]33[/C][C]-0.002695[/C][C]-0.0247[/C][C]0.490176[/C][/ROW]
[ROW][C]34[/C][C]-0.099459[/C][C]-0.9116[/C][C]0.182305[/C][/ROW]
[ROW][C]35[/C][C]-0.096173[/C][C]-0.8814[/C][C]0.190297[/C][/ROW]
[ROW][C]36[/C][C]-0.055878[/C][C]-0.5121[/C][C]0.304953[/C][/ROW]
[ROW][C]37[/C][C]-0.079461[/C][C]-0.7283[/C][C]0.234236[/C][/ROW]
[ROW][C]38[/C][C]-0.012925[/C][C]-0.1185[/C][C]0.452994[/C][/ROW]
[ROW][C]39[/C][C]-0.091017[/C][C]-0.8342[/C][C]0.203272[/C][/ROW]
[ROW][C]40[/C][C]-0.057453[/C][C]-0.5266[/C][C]0.299942[/C][/ROW]
[ROW][C]41[/C][C]-0.006173[/C][C]-0.0566[/C][C]0.477508[/C][/ROW]
[ROW][C]42[/C][C]-0.022554[/C][C]-0.2067[/C][C]0.418368[/C][/ROW]
[ROW][C]43[/C][C]-0.014887[/C][C]-0.1364[/C][C]0.445899[/C][/ROW]
[ROW][C]44[/C][C]-0.037437[/C][C]-0.3431[/C][C]0.366184[/C][/ROW]
[ROW][C]45[/C][C]0.055729[/C][C]0.5108[/C][C]0.305429[/C][/ROW]
[ROW][C]46[/C][C]-0.032632[/C][C]-0.2991[/C][C]0.38281[/C][/ROW]
[ROW][C]47[/C][C]-0.007929[/C][C]-0.0727[/C][C]0.471119[/C][/ROW]
[ROW][C]48[/C][C]0.010702[/C][C]0.0981[/C][C]0.461051[/C][/ROW]
[/TABLE]
Source: https://freestatistics.org/blog/index.php?pk=234298&T=2

Globally Unique Identifier (entire table): ba.freestatistics.org/blog/index.php?pk=234298&T=2

As an alternative you can also use a QR Code:  

The GUIDs for individual cells are displayed in the table below:

Partial Autocorrelation Function
Time lag kPACF(k)T-STATP-value
10.8784448.05110
2-0.263324-2.41340.008989
30.3445953.15830.001103
40.1082050.99170.162092
50.1986741.82090.036093
6-0.121143-1.11030.135021
7-0.344566-3.1580.001104
8-0.212697-1.94940.027292
9-0.208315-1.90920.029823
100.0757240.6940.244793
110.2905892.66330.004637
12-0.01978-0.18130.428288
13-0.436477-4.00046.8e-05
140.0498350.45670.324517
150.0444840.40770.342266
16-0.109736-1.00570.158712
17-0.037844-0.34680.364787
18-0.027084-0.24820.40228
19-0.007611-0.06980.472278
20-0.044405-0.4070.34253
210.0568830.52130.301751
22-0.074979-0.68720.246928
230.1037540.95090.172186
24-0.001158-0.01060.495777
25-0.070519-0.64630.259918
26-0.026645-0.24420.403832
27-0.013942-0.12780.449313
280.0137110.12570.450148
290.0340540.31210.377864
30-0.091703-0.84050.201516
310.1670881.53140.064716
320.0622940.57090.284785
33-0.002695-0.02470.490176
34-0.099459-0.91160.182305
35-0.096173-0.88140.190297
36-0.055878-0.51210.304953
37-0.079461-0.72830.234236
38-0.012925-0.11850.452994
39-0.091017-0.83420.203272
40-0.057453-0.52660.299942
41-0.006173-0.05660.477508
42-0.022554-0.20670.418368
43-0.014887-0.13640.445899
44-0.037437-0.34310.366184
450.0557290.51080.305429
46-0.032632-0.29910.38281
47-0.007929-0.07270.471119
480.0107020.09810.461051


Parameters (Session):
par1 = 48 ; par2 = 1 ; par3 = 0 ; par4 = 0 ; par5 = 12 ; par6 = White Noise ; par7 = 0.95 ;
Parameters (R input):
par1 = 48 ; par2 = 1 ; par3 = 0 ; par4 = 0 ; par5 = 12 ; par6 = White Noise ; par7 = 0.95 ; par8 = ;
R code (references can be found in the software module):
if (par1 == 'Default') {
par1 = 10*log10(length(x))
} else {
par1 <- as.numeric(par1)
}
par2 <- as.numeric(par2)
par3 <- as.numeric(par3)
par4 <- as.numeric(par4)
par5 <- as.numeric(par5)
if (par6 == 'White Noise') par6 <- 'white' else par6 <- 'ma'
par7 <- as.numeric(par7)
if (par8 != '') par8 <- as.numeric(par8)
ox <- x
if (par8 == '') {
if (par2 == 0) {
x <- log(x)
} else {
x <- (x ^ par2 - 1) / par2
}
} else {
x <- log(x,base=par8)
}
if (par3 > 0) x <- diff(x,lag=1,difference=par3)
if (par4 > 0) x <- diff(x,lag=par5,difference=par4)
bitmap(file='picts.png')
op <- par(mfrow=c(2,1))
plot(ox,type='l',main='Original Time Series',xlab='time',ylab='value')
if (par8=='') {
mytitle <- paste('Working Time Series (lambda=',par2,', d=',par3,', D=',par4,')',sep='')
mysub <- paste('(lambda=',par2,', d=',par3,', D=',par4,', CI=', par7, ', CI type=',par6,')',sep='')
} else {
mytitle <- paste('Working Time Series (base=',par8,', d=',par3,', D=',par4,')',sep='')
mysub <- paste('(base=',par8,', d=',par3,', D=',par4,', CI=', par7, ', CI type=',par6,')',sep='')
}
plot(x,type='l', main=mytitle,xlab='time',ylab='value')
par(op)
dev.off()
bitmap(file='pic1.png')
racf <- acf(x, par1, main='Autocorrelation', xlab='time lag', ylab='ACF', ci.type=par6, ci=par7, sub=mysub)
dev.off()
bitmap(file='pic2.png')
rpacf <- pacf(x,par1,main='Partial Autocorrelation',xlab='lags',ylab='PACF',sub=mysub)
dev.off()
(myacf <- c(racf$acf))
(mypacf <- c(rpacf$acf))
lengthx <- length(x)
sqrtn <- sqrt(lengthx)
load(file='createtable')
a<-table.start()
a<-table.row.start(a)
a<-table.element(a,'Autocorrelation Function',4,TRUE)
a<-table.row.end(a)
a<-table.row.start(a)
a<-table.element(a,'Time lag k',header=TRUE)
a<-table.element(a,hyperlink('basics.htm','ACF(k)','click here for more information about the Autocorrelation Function'),header=TRUE)
a<-table.element(a,'T-STAT',header=TRUE)
a<-table.element(a,'P-value',header=TRUE)
a<-table.row.end(a)
for (i in 2:(par1+1)) {
a<-table.row.start(a)
a<-table.element(a,i-1,header=TRUE)
a<-table.element(a,round(myacf[i],6))
mytstat <- myacf[i]*sqrtn
a<-table.element(a,round(mytstat,4))
a<-table.element(a,round(1-pt(abs(mytstat),lengthx),6))
a<-table.row.end(a)
}
a<-table.end(a)
table.save(a,file='mytable.tab')
a<-table.start()
a<-table.row.start(a)
a<-table.element(a,'Partial Autocorrelation Function',4,TRUE)
a<-table.row.end(a)
a<-table.row.start(a)
a<-table.element(a,'Time lag k',header=TRUE)
a<-table.element(a,hyperlink('basics.htm','PACF(k)','click here for more information about the Partial Autocorrelation Function'),header=TRUE)
a<-table.element(a,'T-STAT',header=TRUE)
a<-table.element(a,'P-value',header=TRUE)
a<-table.row.end(a)
for (i in 1:par1) {
a<-table.row.start(a)
a<-table.element(a,i,header=TRUE)
a<-table.element(a,round(mypacf[i],6))
mytstat <- mypacf[i]*sqrtn
a<-table.element(a,round(mytstat,4))
a<-table.element(a,round(1-pt(abs(mytstat),lengthx),6))
a<-table.row.end(a)
}
a<-table.end(a)
table.save(a,file='mytable1.tab')