Free Statistics

of Irreproducible Research!

Author's title

Author*Unverified author*
R Software Modulerwasp_autocorrelation.wasp
Title produced by software(Partial) Autocorrelation Function
Date of computationMon, 17 Mar 2014 08:17:26 -0400
Cite this page as followsStatistical Computations at FreeStatistics.org, Office for Research Development and Education, URL https://freestatistics.org/blog/index.php?v=date/2014/Mar/17/t1395058686jxdtctl2s0ydty6.htm/, Retrieved Tue, 14 May 2024 17:21:54 +0000
Statistical Computations at FreeStatistics.org, Office for Research Development and Education, URL https://freestatistics.org/blog/index.php?pk=234288, Retrieved Tue, 14 May 2024 17:21:54 +0000
QR Codes:

Original text written by user:
IsPrivate?No (this computation is public)
User-defined keywords
Estimated Impact92
Family? (F = Feedback message, R = changed R code, M = changed R Module, P = changed Parameters, D = changed Data)
-       [(Partial) Autocorrelation Function] [] [2014-03-17 12:17:26] [941d89646656d1688f5e273fb31a8e6b] [Current]
Feedback Forum

Post a new message
Dataseries X:
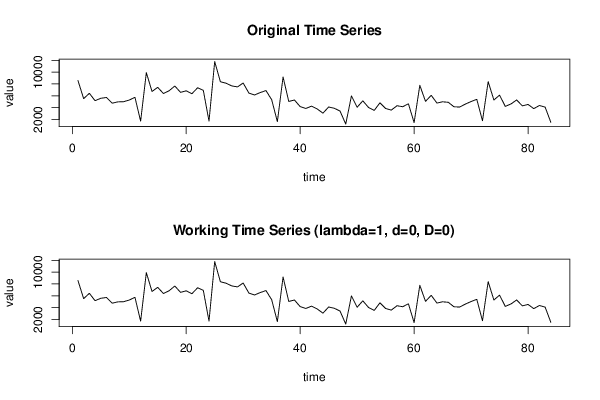
8584
5522
6423
5173
5583
5716
4752
4977
4999
5285
5747
1713
9923
6737
7433
6388
6855
7658
6585
6847
6353
7361
6929
1714
11798
8378
8131
7676
7505
8168
6455
6141
6554
6888
5339
1624
9187
5047
5289
4169
3862
4253
3768
3066
4108
3890
3420
1221
5984
4064
5151
4027
3530
4819
3855
3584
4322
4154
4656
1464
7780
5060
6084
4778
4989
4903
4142
4101
4595
5034
5407
1782
8395
5291
6116
4210
4621
5299
4293
4542
3831
4360
4088
1508


Summary of computational transaction
Raw Inputview raw input (R code)
Raw Outputview raw output of R engine
Computing time3 seconds
R Server'Herman Ole Andreas Wold' @ wold.wessa.net

\begin{tabular}{lllllllll}
\hline
Summary of computational transaction \tabularnewline
Raw Input & view raw input (R code)  \tabularnewline
Raw Output & view raw output of R engine  \tabularnewline
Computing time & 3 seconds \tabularnewline
R Server & 'Herman Ole Andreas Wold' @ wold.wessa.net \tabularnewline
\hline
\end{tabular}
%Source: https://freestatistics.org/blog/index.php?pk=234288&T=0

[TABLE]
[ROW][C]Summary of computational transaction[/C][/ROW]
[ROW][C]Raw Input[/C][C]view raw input (R code) [/C][/ROW]
[ROW][C]Raw Output[/C][C]view raw output of R engine [/C][/ROW]
[ROW][C]Computing time[/C][C]3 seconds[/C][/ROW]
[ROW][C]R Server[/C][C]'Herman Ole Andreas Wold' @ wold.wessa.net[/C][/ROW]
[/TABLE]
Source: https://freestatistics.org/blog/index.php?pk=234288&T=0

Globally Unique Identifier (entire table): ba.freestatistics.org/blog/index.php?pk=234288&T=0

As an alternative you can also use a QR Code:  

The GUIDs for individual cells are displayed in the table below:

Summary of computational transaction
Raw Inputview raw input (R code)
Raw Outputview raw output of R engine
Computing time3 seconds
R Server'Herman Ole Andreas Wold' @ wold.wessa.net


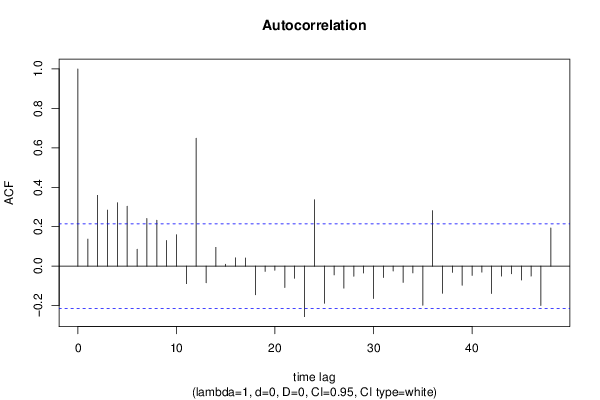
Autocorrelation Function
Time lag kACF(k)T-STATP-value
10.1368621.25440.106596
20.3588833.28920.000735
30.2840612.60350.005455
40.321762.9490.002064
50.3035142.78170.003337
60.0854120.78280.217969
70.2412352.2110.014878
80.2327062.13280.01793
90.1302761.1940.11792
100.1594071.4610.073875
11-0.08883-0.81410.208932
120.6482975.94170
13-0.083939-0.76930.221932
140.0951430.8720.192846
150.0098380.09020.464186
160.0417890.3830.351342
170.0414620.380.352449
18-0.145112-1.330.093563
19-0.026862-0.24620.403067
20-0.021061-0.1930.423704
21-0.108434-0.99380.161583
22-0.061956-0.56780.28583
23-0.256252-2.34860.010597
240.3367723.08660.001371
25-0.188511-1.72770.043856
26-0.044629-0.4090.341777
27-0.111607-1.02290.154646
28-0.051123-0.46850.320303
29-0.034746-0.31840.375468
30-0.164567-1.50830.067617
31-0.057519-0.52720.299731
32-0.024904-0.22820.410004
33-0.082366-0.75490.22621
34-0.034487-0.31610.376363
35-0.198514-1.81940.036205
360.2816572.58140.005788
37-0.137771-1.26270.105096
38-0.031764-0.29110.385839
39-0.097414-0.89280.187253
40-0.046978-0.43060.333944
41-0.030425-0.27890.390522
42-0.13913-1.27510.102887
43-0.050609-0.46380.32198
44-0.038968-0.35720.360937
45-0.070608-0.64710.259655
46-0.050586-0.46360.322057
47-0.199697-1.83030.035379
480.1937551.77580.039694

\begin{tabular}{lllllllll}
\hline
Autocorrelation Function \tabularnewline
Time lag k & ACF(k) & T-STAT & P-value \tabularnewline
1 & 0.136862 & 1.2544 & 0.106596 \tabularnewline
2 & 0.358883 & 3.2892 & 0.000735 \tabularnewline
3 & 0.284061 & 2.6035 & 0.005455 \tabularnewline
4 & 0.32176 & 2.949 & 0.002064 \tabularnewline
5 & 0.303514 & 2.7817 & 0.003337 \tabularnewline
6 & 0.085412 & 0.7828 & 0.217969 \tabularnewline
7 & 0.241235 & 2.211 & 0.014878 \tabularnewline
8 & 0.232706 & 2.1328 & 0.01793 \tabularnewline
9 & 0.130276 & 1.194 & 0.11792 \tabularnewline
10 & 0.159407 & 1.461 & 0.073875 \tabularnewline
11 & -0.08883 & -0.8141 & 0.208932 \tabularnewline
12 & 0.648297 & 5.9417 & 0 \tabularnewline
13 & -0.083939 & -0.7693 & 0.221932 \tabularnewline
14 & 0.095143 & 0.872 & 0.192846 \tabularnewline
15 & 0.009838 & 0.0902 & 0.464186 \tabularnewline
16 & 0.041789 & 0.383 & 0.351342 \tabularnewline
17 & 0.041462 & 0.38 & 0.352449 \tabularnewline
18 & -0.145112 & -1.33 & 0.093563 \tabularnewline
19 & -0.026862 & -0.2462 & 0.403067 \tabularnewline
20 & -0.021061 & -0.193 & 0.423704 \tabularnewline
21 & -0.108434 & -0.9938 & 0.161583 \tabularnewline
22 & -0.061956 & -0.5678 & 0.28583 \tabularnewline
23 & -0.256252 & -2.3486 & 0.010597 \tabularnewline
24 & 0.336772 & 3.0866 & 0.001371 \tabularnewline
25 & -0.188511 & -1.7277 & 0.043856 \tabularnewline
26 & -0.044629 & -0.409 & 0.341777 \tabularnewline
27 & -0.111607 & -1.0229 & 0.154646 \tabularnewline
28 & -0.051123 & -0.4685 & 0.320303 \tabularnewline
29 & -0.034746 & -0.3184 & 0.375468 \tabularnewline
30 & -0.164567 & -1.5083 & 0.067617 \tabularnewline
31 & -0.057519 & -0.5272 & 0.299731 \tabularnewline
32 & -0.024904 & -0.2282 & 0.410004 \tabularnewline
33 & -0.082366 & -0.7549 & 0.22621 \tabularnewline
34 & -0.034487 & -0.3161 & 0.376363 \tabularnewline
35 & -0.198514 & -1.8194 & 0.036205 \tabularnewline
36 & 0.281657 & 2.5814 & 0.005788 \tabularnewline
37 & -0.137771 & -1.2627 & 0.105096 \tabularnewline
38 & -0.031764 & -0.2911 & 0.385839 \tabularnewline
39 & -0.097414 & -0.8928 & 0.187253 \tabularnewline
40 & -0.046978 & -0.4306 & 0.333944 \tabularnewline
41 & -0.030425 & -0.2789 & 0.390522 \tabularnewline
42 & -0.13913 & -1.2751 & 0.102887 \tabularnewline
43 & -0.050609 & -0.4638 & 0.32198 \tabularnewline
44 & -0.038968 & -0.3572 & 0.360937 \tabularnewline
45 & -0.070608 & -0.6471 & 0.259655 \tabularnewline
46 & -0.050586 & -0.4636 & 0.322057 \tabularnewline
47 & -0.199697 & -1.8303 & 0.035379 \tabularnewline
48 & 0.193755 & 1.7758 & 0.039694 \tabularnewline
\hline
\end{tabular}
%Source: https://freestatistics.org/blog/index.php?pk=234288&T=1

[TABLE]
[ROW][C]Autocorrelation Function[/C][/ROW]
[ROW][C]Time lag k[/C][C]ACF(k)[/C][C]T-STAT[/C][C]P-value[/C][/ROW]
[ROW][C]1[/C][C]0.136862[/C][C]1.2544[/C][C]0.106596[/C][/ROW]
[ROW][C]2[/C][C]0.358883[/C][C]3.2892[/C][C]0.000735[/C][/ROW]
[ROW][C]3[/C][C]0.284061[/C][C]2.6035[/C][C]0.005455[/C][/ROW]
[ROW][C]4[/C][C]0.32176[/C][C]2.949[/C][C]0.002064[/C][/ROW]
[ROW][C]5[/C][C]0.303514[/C][C]2.7817[/C][C]0.003337[/C][/ROW]
[ROW][C]6[/C][C]0.085412[/C][C]0.7828[/C][C]0.217969[/C][/ROW]
[ROW][C]7[/C][C]0.241235[/C][C]2.211[/C][C]0.014878[/C][/ROW]
[ROW][C]8[/C][C]0.232706[/C][C]2.1328[/C][C]0.01793[/C][/ROW]
[ROW][C]9[/C][C]0.130276[/C][C]1.194[/C][C]0.11792[/C][/ROW]
[ROW][C]10[/C][C]0.159407[/C][C]1.461[/C][C]0.073875[/C][/ROW]
[ROW][C]11[/C][C]-0.08883[/C][C]-0.8141[/C][C]0.208932[/C][/ROW]
[ROW][C]12[/C][C]0.648297[/C][C]5.9417[/C][C]0[/C][/ROW]
[ROW][C]13[/C][C]-0.083939[/C][C]-0.7693[/C][C]0.221932[/C][/ROW]
[ROW][C]14[/C][C]0.095143[/C][C]0.872[/C][C]0.192846[/C][/ROW]
[ROW][C]15[/C][C]0.009838[/C][C]0.0902[/C][C]0.464186[/C][/ROW]
[ROW][C]16[/C][C]0.041789[/C][C]0.383[/C][C]0.351342[/C][/ROW]
[ROW][C]17[/C][C]0.041462[/C][C]0.38[/C][C]0.352449[/C][/ROW]
[ROW][C]18[/C][C]-0.145112[/C][C]-1.33[/C][C]0.093563[/C][/ROW]
[ROW][C]19[/C][C]-0.026862[/C][C]-0.2462[/C][C]0.403067[/C][/ROW]
[ROW][C]20[/C][C]-0.021061[/C][C]-0.193[/C][C]0.423704[/C][/ROW]
[ROW][C]21[/C][C]-0.108434[/C][C]-0.9938[/C][C]0.161583[/C][/ROW]
[ROW][C]22[/C][C]-0.061956[/C][C]-0.5678[/C][C]0.28583[/C][/ROW]
[ROW][C]23[/C][C]-0.256252[/C][C]-2.3486[/C][C]0.010597[/C][/ROW]
[ROW][C]24[/C][C]0.336772[/C][C]3.0866[/C][C]0.001371[/C][/ROW]
[ROW][C]25[/C][C]-0.188511[/C][C]-1.7277[/C][C]0.043856[/C][/ROW]
[ROW][C]26[/C][C]-0.044629[/C][C]-0.409[/C][C]0.341777[/C][/ROW]
[ROW][C]27[/C][C]-0.111607[/C][C]-1.0229[/C][C]0.154646[/C][/ROW]
[ROW][C]28[/C][C]-0.051123[/C][C]-0.4685[/C][C]0.320303[/C][/ROW]
[ROW][C]29[/C][C]-0.034746[/C][C]-0.3184[/C][C]0.375468[/C][/ROW]
[ROW][C]30[/C][C]-0.164567[/C][C]-1.5083[/C][C]0.067617[/C][/ROW]
[ROW][C]31[/C][C]-0.057519[/C][C]-0.5272[/C][C]0.299731[/C][/ROW]
[ROW][C]32[/C][C]-0.024904[/C][C]-0.2282[/C][C]0.410004[/C][/ROW]
[ROW][C]33[/C][C]-0.082366[/C][C]-0.7549[/C][C]0.22621[/C][/ROW]
[ROW][C]34[/C][C]-0.034487[/C][C]-0.3161[/C][C]0.376363[/C][/ROW]
[ROW][C]35[/C][C]-0.198514[/C][C]-1.8194[/C][C]0.036205[/C][/ROW]
[ROW][C]36[/C][C]0.281657[/C][C]2.5814[/C][C]0.005788[/C][/ROW]
[ROW][C]37[/C][C]-0.137771[/C][C]-1.2627[/C][C]0.105096[/C][/ROW]
[ROW][C]38[/C][C]-0.031764[/C][C]-0.2911[/C][C]0.385839[/C][/ROW]
[ROW][C]39[/C][C]-0.097414[/C][C]-0.8928[/C][C]0.187253[/C][/ROW]
[ROW][C]40[/C][C]-0.046978[/C][C]-0.4306[/C][C]0.333944[/C][/ROW]
[ROW][C]41[/C][C]-0.030425[/C][C]-0.2789[/C][C]0.390522[/C][/ROW]
[ROW][C]42[/C][C]-0.13913[/C][C]-1.2751[/C][C]0.102887[/C][/ROW]
[ROW][C]43[/C][C]-0.050609[/C][C]-0.4638[/C][C]0.32198[/C][/ROW]
[ROW][C]44[/C][C]-0.038968[/C][C]-0.3572[/C][C]0.360937[/C][/ROW]
[ROW][C]45[/C][C]-0.070608[/C][C]-0.6471[/C][C]0.259655[/C][/ROW]
[ROW][C]46[/C][C]-0.050586[/C][C]-0.4636[/C][C]0.322057[/C][/ROW]
[ROW][C]47[/C][C]-0.199697[/C][C]-1.8303[/C][C]0.035379[/C][/ROW]
[ROW][C]48[/C][C]0.193755[/C][C]1.7758[/C][C]0.039694[/C][/ROW]
[/TABLE]
Source: https://freestatistics.org/blog/index.php?pk=234288&T=1

Globally Unique Identifier (entire table): ba.freestatistics.org/blog/index.php?pk=234288&T=1

As an alternative you can also use a QR Code:  

The GUIDs for individual cells are displayed in the table below:

Autocorrelation Function
Time lag kACF(k)T-STATP-value
10.1368621.25440.106596
20.3588833.28920.000735
30.2840612.60350.005455
40.321762.9490.002064
50.3035142.78170.003337
60.0854120.78280.217969
70.2412352.2110.014878
80.2327062.13280.01793
90.1302761.1940.11792
100.1594071.4610.073875
11-0.08883-0.81410.208932
120.6482975.94170
13-0.083939-0.76930.221932
140.0951430.8720.192846
150.0098380.09020.464186
160.0417890.3830.351342
170.0414620.380.352449
18-0.145112-1.330.093563
19-0.026862-0.24620.403067
20-0.021061-0.1930.423704
21-0.108434-0.99380.161583
22-0.061956-0.56780.28583
23-0.256252-2.34860.010597
240.3367723.08660.001371
25-0.188511-1.72770.043856
26-0.044629-0.4090.341777
27-0.111607-1.02290.154646
28-0.051123-0.46850.320303
29-0.034746-0.31840.375468
30-0.164567-1.50830.067617
31-0.057519-0.52720.299731
32-0.024904-0.22820.410004
33-0.082366-0.75490.22621
34-0.034487-0.31610.376363
35-0.198514-1.81940.036205
360.2816572.58140.005788
37-0.137771-1.26270.105096
38-0.031764-0.29110.385839
39-0.097414-0.89280.187253
40-0.046978-0.43060.333944
41-0.030425-0.27890.390522
42-0.13913-1.27510.102887
43-0.050609-0.46380.32198
44-0.038968-0.35720.360937
45-0.070608-0.64710.259655
46-0.050586-0.46360.322057
47-0.199697-1.83030.035379
480.1937551.77580.039694


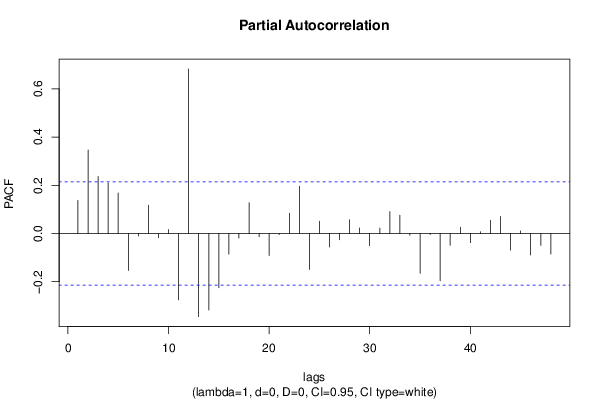
Partial Autocorrelation Function
Time lag kPACF(k)T-STATP-value
10.1368621.25440.106596
20.3466453.17710.001041
30.2368982.17120.016368
40.209181.91720.029308
50.167981.53960.063713
6-0.153684-1.40850.081331
7-0.010575-0.09690.461509
80.1169541.07190.143417
9-0.017779-0.16290.435475
100.0165380.15160.439945
11-0.275327-2.52340.006753
120.6826676.25670
13-0.344866-3.16070.001094
14-0.3172-2.90720.002332
15-0.225065-2.06280.021113
16-0.085455-0.78320.217854
17-0.018996-0.17410.431103
180.1276921.17030.122592
19-0.013466-0.12340.451036
20-0.091247-0.83630.202682
21-0.003771-0.03460.486256
220.0838370.76840.222209
230.1962961.79910.037799
24-0.149439-1.36960.087226
250.0509780.46720.320776
26-0.055811-0.51150.305167
27-0.025606-0.23470.407512
280.0571280.52360.300971
290.0225940.20710.418227
30-0.050237-0.46040.323197
310.0224040.20530.418903
320.0910040.83410.203305
330.075790.69460.244604
34-0.006966-0.06380.474624
35-0.164966-1.51190.067152
36-0.004414-0.04050.483915
37-0.196064-1.7970.037969
38-0.048607-0.44550.328556
390.0257690.23620.406935
40-0.037906-0.34740.364576
410.0072580.06650.473561
420.0544750.49930.309446
430.070720.64820.259324
44-0.068895-0.63140.264736
450.0108710.09960.460435
46-0.089169-0.81720.208049
47-0.049126-0.45020.326846
48-0.085319-0.7820.218219

\begin{tabular}{lllllllll}
\hline
Partial Autocorrelation Function \tabularnewline
Time lag k & PACF(k) & T-STAT & P-value \tabularnewline
1 & 0.136862 & 1.2544 & 0.106596 \tabularnewline
2 & 0.346645 & 3.1771 & 0.001041 \tabularnewline
3 & 0.236898 & 2.1712 & 0.016368 \tabularnewline
4 & 0.20918 & 1.9172 & 0.029308 \tabularnewline
5 & 0.16798 & 1.5396 & 0.063713 \tabularnewline
6 & -0.153684 & -1.4085 & 0.081331 \tabularnewline
7 & -0.010575 & -0.0969 & 0.461509 \tabularnewline
8 & 0.116954 & 1.0719 & 0.143417 \tabularnewline
9 & -0.017779 & -0.1629 & 0.435475 \tabularnewline
10 & 0.016538 & 0.1516 & 0.439945 \tabularnewline
11 & -0.275327 & -2.5234 & 0.006753 \tabularnewline
12 & 0.682667 & 6.2567 & 0 \tabularnewline
13 & -0.344866 & -3.1607 & 0.001094 \tabularnewline
14 & -0.3172 & -2.9072 & 0.002332 \tabularnewline
15 & -0.225065 & -2.0628 & 0.021113 \tabularnewline
16 & -0.085455 & -0.7832 & 0.217854 \tabularnewline
17 & -0.018996 & -0.1741 & 0.431103 \tabularnewline
18 & 0.127692 & 1.1703 & 0.122592 \tabularnewline
19 & -0.013466 & -0.1234 & 0.451036 \tabularnewline
20 & -0.091247 & -0.8363 & 0.202682 \tabularnewline
21 & -0.003771 & -0.0346 & 0.486256 \tabularnewline
22 & 0.083837 & 0.7684 & 0.222209 \tabularnewline
23 & 0.196296 & 1.7991 & 0.037799 \tabularnewline
24 & -0.149439 & -1.3696 & 0.087226 \tabularnewline
25 & 0.050978 & 0.4672 & 0.320776 \tabularnewline
26 & -0.055811 & -0.5115 & 0.305167 \tabularnewline
27 & -0.025606 & -0.2347 & 0.407512 \tabularnewline
28 & 0.057128 & 0.5236 & 0.300971 \tabularnewline
29 & 0.022594 & 0.2071 & 0.418227 \tabularnewline
30 & -0.050237 & -0.4604 & 0.323197 \tabularnewline
31 & 0.022404 & 0.2053 & 0.418903 \tabularnewline
32 & 0.091004 & 0.8341 & 0.203305 \tabularnewline
33 & 0.07579 & 0.6946 & 0.244604 \tabularnewline
34 & -0.006966 & -0.0638 & 0.474624 \tabularnewline
35 & -0.164966 & -1.5119 & 0.067152 \tabularnewline
36 & -0.004414 & -0.0405 & 0.483915 \tabularnewline
37 & -0.196064 & -1.797 & 0.037969 \tabularnewline
38 & -0.048607 & -0.4455 & 0.328556 \tabularnewline
39 & 0.025769 & 0.2362 & 0.406935 \tabularnewline
40 & -0.037906 & -0.3474 & 0.364576 \tabularnewline
41 & 0.007258 & 0.0665 & 0.473561 \tabularnewline
42 & 0.054475 & 0.4993 & 0.309446 \tabularnewline
43 & 0.07072 & 0.6482 & 0.259324 \tabularnewline
44 & -0.068895 & -0.6314 & 0.264736 \tabularnewline
45 & 0.010871 & 0.0996 & 0.460435 \tabularnewline
46 & -0.089169 & -0.8172 & 0.208049 \tabularnewline
47 & -0.049126 & -0.4502 & 0.326846 \tabularnewline
48 & -0.085319 & -0.782 & 0.218219 \tabularnewline
\hline
\end{tabular}
%Source: https://freestatistics.org/blog/index.php?pk=234288&T=2

[TABLE]
[ROW][C]Partial Autocorrelation Function[/C][/ROW]
[ROW][C]Time lag k[/C][C]PACF(k)[/C][C]T-STAT[/C][C]P-value[/C][/ROW]
[ROW][C]1[/C][C]0.136862[/C][C]1.2544[/C][C]0.106596[/C][/ROW]
[ROW][C]2[/C][C]0.346645[/C][C]3.1771[/C][C]0.001041[/C][/ROW]
[ROW][C]3[/C][C]0.236898[/C][C]2.1712[/C][C]0.016368[/C][/ROW]
[ROW][C]4[/C][C]0.20918[/C][C]1.9172[/C][C]0.029308[/C][/ROW]
[ROW][C]5[/C][C]0.16798[/C][C]1.5396[/C][C]0.063713[/C][/ROW]
[ROW][C]6[/C][C]-0.153684[/C][C]-1.4085[/C][C]0.081331[/C][/ROW]
[ROW][C]7[/C][C]-0.010575[/C][C]-0.0969[/C][C]0.461509[/C][/ROW]
[ROW][C]8[/C][C]0.116954[/C][C]1.0719[/C][C]0.143417[/C][/ROW]
[ROW][C]9[/C][C]-0.017779[/C][C]-0.1629[/C][C]0.435475[/C][/ROW]
[ROW][C]10[/C][C]0.016538[/C][C]0.1516[/C][C]0.439945[/C][/ROW]
[ROW][C]11[/C][C]-0.275327[/C][C]-2.5234[/C][C]0.006753[/C][/ROW]
[ROW][C]12[/C][C]0.682667[/C][C]6.2567[/C][C]0[/C][/ROW]
[ROW][C]13[/C][C]-0.344866[/C][C]-3.1607[/C][C]0.001094[/C][/ROW]
[ROW][C]14[/C][C]-0.3172[/C][C]-2.9072[/C][C]0.002332[/C][/ROW]
[ROW][C]15[/C][C]-0.225065[/C][C]-2.0628[/C][C]0.021113[/C][/ROW]
[ROW][C]16[/C][C]-0.085455[/C][C]-0.7832[/C][C]0.217854[/C][/ROW]
[ROW][C]17[/C][C]-0.018996[/C][C]-0.1741[/C][C]0.431103[/C][/ROW]
[ROW][C]18[/C][C]0.127692[/C][C]1.1703[/C][C]0.122592[/C][/ROW]
[ROW][C]19[/C][C]-0.013466[/C][C]-0.1234[/C][C]0.451036[/C][/ROW]
[ROW][C]20[/C][C]-0.091247[/C][C]-0.8363[/C][C]0.202682[/C][/ROW]
[ROW][C]21[/C][C]-0.003771[/C][C]-0.0346[/C][C]0.486256[/C][/ROW]
[ROW][C]22[/C][C]0.083837[/C][C]0.7684[/C][C]0.222209[/C][/ROW]
[ROW][C]23[/C][C]0.196296[/C][C]1.7991[/C][C]0.037799[/C][/ROW]
[ROW][C]24[/C][C]-0.149439[/C][C]-1.3696[/C][C]0.087226[/C][/ROW]
[ROW][C]25[/C][C]0.050978[/C][C]0.4672[/C][C]0.320776[/C][/ROW]
[ROW][C]26[/C][C]-0.055811[/C][C]-0.5115[/C][C]0.305167[/C][/ROW]
[ROW][C]27[/C][C]-0.025606[/C][C]-0.2347[/C][C]0.407512[/C][/ROW]
[ROW][C]28[/C][C]0.057128[/C][C]0.5236[/C][C]0.300971[/C][/ROW]
[ROW][C]29[/C][C]0.022594[/C][C]0.2071[/C][C]0.418227[/C][/ROW]
[ROW][C]30[/C][C]-0.050237[/C][C]-0.4604[/C][C]0.323197[/C][/ROW]
[ROW][C]31[/C][C]0.022404[/C][C]0.2053[/C][C]0.418903[/C][/ROW]
[ROW][C]32[/C][C]0.091004[/C][C]0.8341[/C][C]0.203305[/C][/ROW]
[ROW][C]33[/C][C]0.07579[/C][C]0.6946[/C][C]0.244604[/C][/ROW]
[ROW][C]34[/C][C]-0.006966[/C][C]-0.0638[/C][C]0.474624[/C][/ROW]
[ROW][C]35[/C][C]-0.164966[/C][C]-1.5119[/C][C]0.067152[/C][/ROW]
[ROW][C]36[/C][C]-0.004414[/C][C]-0.0405[/C][C]0.483915[/C][/ROW]
[ROW][C]37[/C][C]-0.196064[/C][C]-1.797[/C][C]0.037969[/C][/ROW]
[ROW][C]38[/C][C]-0.048607[/C][C]-0.4455[/C][C]0.328556[/C][/ROW]
[ROW][C]39[/C][C]0.025769[/C][C]0.2362[/C][C]0.406935[/C][/ROW]
[ROW][C]40[/C][C]-0.037906[/C][C]-0.3474[/C][C]0.364576[/C][/ROW]
[ROW][C]41[/C][C]0.007258[/C][C]0.0665[/C][C]0.473561[/C][/ROW]
[ROW][C]42[/C][C]0.054475[/C][C]0.4993[/C][C]0.309446[/C][/ROW]
[ROW][C]43[/C][C]0.07072[/C][C]0.6482[/C][C]0.259324[/C][/ROW]
[ROW][C]44[/C][C]-0.068895[/C][C]-0.6314[/C][C]0.264736[/C][/ROW]
[ROW][C]45[/C][C]0.010871[/C][C]0.0996[/C][C]0.460435[/C][/ROW]
[ROW][C]46[/C][C]-0.089169[/C][C]-0.8172[/C][C]0.208049[/C][/ROW]
[ROW][C]47[/C][C]-0.049126[/C][C]-0.4502[/C][C]0.326846[/C][/ROW]
[ROW][C]48[/C][C]-0.085319[/C][C]-0.782[/C][C]0.218219[/C][/ROW]
[/TABLE]
Source: https://freestatistics.org/blog/index.php?pk=234288&T=2

Globally Unique Identifier (entire table): ba.freestatistics.org/blog/index.php?pk=234288&T=2

As an alternative you can also use a QR Code:  

The GUIDs for individual cells are displayed in the table below:

Partial Autocorrelation Function
Time lag kPACF(k)T-STATP-value
10.1368621.25440.106596
20.3466453.17710.001041
30.2368982.17120.016368
40.209181.91720.029308
50.167981.53960.063713
6-0.153684-1.40850.081331
7-0.010575-0.09690.461509
80.1169541.07190.143417
9-0.017779-0.16290.435475
100.0165380.15160.439945
11-0.275327-2.52340.006753
120.6826676.25670
13-0.344866-3.16070.001094
14-0.3172-2.90720.002332
15-0.225065-2.06280.021113
16-0.085455-0.78320.217854
17-0.018996-0.17410.431103
180.1276921.17030.122592
19-0.013466-0.12340.451036
20-0.091247-0.83630.202682
21-0.003771-0.03460.486256
220.0838370.76840.222209
230.1962961.79910.037799
24-0.149439-1.36960.087226
250.0509780.46720.320776
26-0.055811-0.51150.305167
27-0.025606-0.23470.407512
280.0571280.52360.300971
290.0225940.20710.418227
30-0.050237-0.46040.323197
310.0224040.20530.418903
320.0910040.83410.203305
330.075790.69460.244604
34-0.006966-0.06380.474624
35-0.164966-1.51190.067152
36-0.004414-0.04050.483915
37-0.196064-1.7970.037969
38-0.048607-0.44550.328556
390.0257690.23620.406935
40-0.037906-0.34740.364576
410.0072580.06650.473561
420.0544750.49930.309446
430.070720.64820.259324
44-0.068895-0.63140.264736
450.0108710.09960.460435
46-0.089169-0.81720.208049
47-0.049126-0.45020.326846
48-0.085319-0.7820.218219


Parameters (Session):
par1 = 48 ; par2 = 1 ; par3 = 0 ; par4 = 0 ; par5 = 12 ; par6 = White Noise ; par7 = 0.95 ;
Parameters (R input):
par1 = 48 ; par2 = 1 ; par3 = 0 ; par4 = 0 ; par5 = 12 ; par6 = White Noise ; par7 = 0.95 ; par8 = ;
R code (references can be found in the software module):
if (par1 == 'Default') {
par1 = 10*log10(length(x))
} else {
par1 <- as.numeric(par1)
}
par2 <- as.numeric(par2)
par3 <- as.numeric(par3)
par4 <- as.numeric(par4)
par5 <- as.numeric(par5)
if (par6 == 'White Noise') par6 <- 'white' else par6 <- 'ma'
par7 <- as.numeric(par7)
if (par8 != '') par8 <- as.numeric(par8)
ox <- x
if (par8 == '') {
if (par2 == 0) {
x <- log(x)
} else {
x <- (x ^ par2 - 1) / par2
}
} else {
x <- log(x,base=par8)
}
if (par3 > 0) x <- diff(x,lag=1,difference=par3)
if (par4 > 0) x <- diff(x,lag=par5,difference=par4)
bitmap(file='picts.png')
op <- par(mfrow=c(2,1))
plot(ox,type='l',main='Original Time Series',xlab='time',ylab='value')
if (par8=='') {
mytitle <- paste('Working Time Series (lambda=',par2,', d=',par3,', D=',par4,')',sep='')
mysub <- paste('(lambda=',par2,', d=',par3,', D=',par4,', CI=', par7, ', CI type=',par6,')',sep='')
} else {
mytitle <- paste('Working Time Series (base=',par8,', d=',par3,', D=',par4,')',sep='')
mysub <- paste('(base=',par8,', d=',par3,', D=',par4,', CI=', par7, ', CI type=',par6,')',sep='')
}
plot(x,type='l', main=mytitle,xlab='time',ylab='value')
par(op)
dev.off()
bitmap(file='pic1.png')
racf <- acf(x, par1, main='Autocorrelation', xlab='time lag', ylab='ACF', ci.type=par6, ci=par7, sub=mysub)
dev.off()
bitmap(file='pic2.png')
rpacf <- pacf(x,par1,main='Partial Autocorrelation',xlab='lags',ylab='PACF',sub=mysub)
dev.off()
(myacf <- c(racf$acf))
(mypacf <- c(rpacf$acf))
lengthx <- length(x)
sqrtn <- sqrt(lengthx)
load(file='createtable')
a<-table.start()
a<-table.row.start(a)
a<-table.element(a,'Autocorrelation Function',4,TRUE)
a<-table.row.end(a)
a<-table.row.start(a)
a<-table.element(a,'Time lag k',header=TRUE)
a<-table.element(a,hyperlink('basics.htm','ACF(k)','click here for more information about the Autocorrelation Function'),header=TRUE)
a<-table.element(a,'T-STAT',header=TRUE)
a<-table.element(a,'P-value',header=TRUE)
a<-table.row.end(a)
for (i in 2:(par1+1)) {
a<-table.row.start(a)
a<-table.element(a,i-1,header=TRUE)
a<-table.element(a,round(myacf[i],6))
mytstat <- myacf[i]*sqrtn
a<-table.element(a,round(mytstat,4))
a<-table.element(a,round(1-pt(abs(mytstat),lengthx),6))
a<-table.row.end(a)
}
a<-table.end(a)
table.save(a,file='mytable.tab')
a<-table.start()
a<-table.row.start(a)
a<-table.element(a,'Partial Autocorrelation Function',4,TRUE)
a<-table.row.end(a)
a<-table.row.start(a)
a<-table.element(a,'Time lag k',header=TRUE)
a<-table.element(a,hyperlink('basics.htm','PACF(k)','click here for more information about the Partial Autocorrelation Function'),header=TRUE)
a<-table.element(a,'T-STAT',header=TRUE)
a<-table.element(a,'P-value',header=TRUE)
a<-table.row.end(a)
for (i in 1:par1) {
a<-table.row.start(a)
a<-table.element(a,i,header=TRUE)
a<-table.element(a,round(mypacf[i],6))
mytstat <- mypacf[i]*sqrtn
a<-table.element(a,round(mytstat,4))
a<-table.element(a,round(1-pt(abs(mytstat),lengthx),6))
a<-table.row.end(a)
}
a<-table.end(a)
table.save(a,file='mytable1.tab')