Free Statistics

of Irreproducible Research!

Author's title

Author*Unverified author*
R Software Modulerwasp_autocorrelation.wasp
Title produced by software(Partial) Autocorrelation Function
Date of computationMon, 17 Mar 2014 08:12:51 -0400
Cite this page as followsStatistical Computations at FreeStatistics.org, Office for Research Development and Education, URL https://freestatistics.org/blog/index.php?v=date/2014/Mar/17/t1395058387w6cm533pi442sc2.htm/, Retrieved Tue, 14 May 2024 05:55:26 +0000
Statistical Computations at FreeStatistics.org, Office for Research Development and Education, URL https://freestatistics.org/blog/index.php?pk=234287, Retrieved Tue, 14 May 2024 05:55:26 +0000
QR Codes:

Original text written by user:
IsPrivate?No (this computation is public)
User-defined keywords
Estimated Impact94
Family? (F = Feedback message, R = changed R code, M = changed R Module, P = changed Parameters, D = changed Data)
-       [(Partial) Autocorrelation Function] [] [2014-03-17 12:12:51] [941d89646656d1688f5e273fb31a8e6b] [Current]
Feedback Forum

Post a new message
Dataseries X:
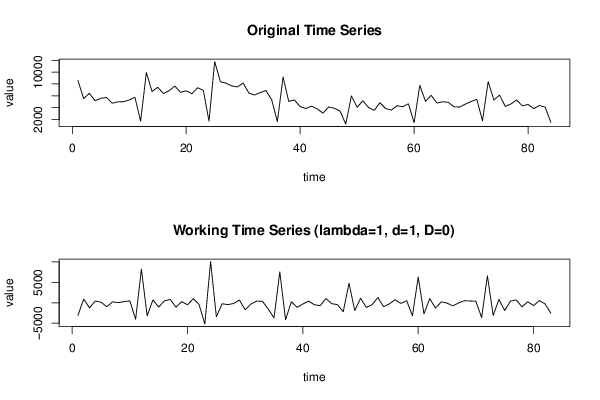
8584
5522
6423
5173
5583
5716
4752
4977
4999
5285
5747
1713
9923
6737
7433
6388
6855
7658
6585
6847
6353
7361
6929
1714
11798
8378
8131
7676
7505
8168
6455
6141
6554
6888
5339
1624
9187
5047
5289
4169
3862
4253
3768
3066
4108
3890
3420
1221
5984
4064
5151
4027
3530
4819
3855
3584
4322
4154
4656
1464
7780
5060
6084
4778
4989
4903
4142
4101
4595
5034
5407
1782
8395
5291
6116
4210
4621
5299
4293
4542
3831
4360
4088
1508


Summary of computational transaction
Raw Inputview raw input (R code)
Raw Outputview raw output of R engine
Computing time3 seconds
R Server'Herman Ole Andreas Wold' @ wold.wessa.net

\begin{tabular}{lllllllll}
\hline
Summary of computational transaction \tabularnewline
Raw Input & view raw input (R code)  \tabularnewline
Raw Output & view raw output of R engine  \tabularnewline
Computing time & 3 seconds \tabularnewline
R Server & 'Herman Ole Andreas Wold' @ wold.wessa.net \tabularnewline
\hline
\end{tabular}
%Source: https://freestatistics.org/blog/index.php?pk=234287&T=0

[TABLE]
[ROW][C]Summary of computational transaction[/C][/ROW]
[ROW][C]Raw Input[/C][C]view raw input (R code) [/C][/ROW]
[ROW][C]Raw Output[/C][C]view raw output of R engine [/C][/ROW]
[ROW][C]Computing time[/C][C]3 seconds[/C][/ROW]
[ROW][C]R Server[/C][C]'Herman Ole Andreas Wold' @ wold.wessa.net[/C][/ROW]
[/TABLE]
Source: https://freestatistics.org/blog/index.php?pk=234287&T=0

Globally Unique Identifier (entire table): ba.freestatistics.org/blog/index.php?pk=234287&T=0

As an alternative you can also use a QR Code:  

The GUIDs for individual cells are displayed in the table below:

Summary of computational transaction
Raw Inputview raw input (R code)
Raw Outputview raw output of R engine
Computing time3 seconds
R Server'Herman Ole Andreas Wold' @ wold.wessa.net


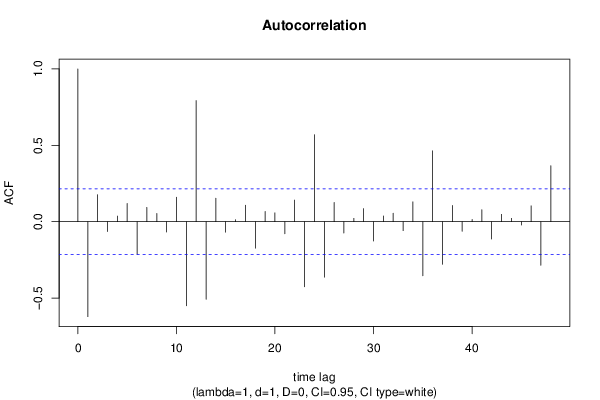
Autocorrelation Function
Time lag kACF(k)T-STATP-value
1-0.621998-5.66670
20.1763511.60660.055966
3-0.06468-0.58930.278643
40.0363350.3310.370729
50.1185021.07960.141723
6-0.213961-1.94930.02732
70.0934280.85120.198563
80.0537190.48940.312924
9-0.067991-0.61940.268667
100.1595051.45320.074976
11-0.550425-5.01461e-06
120.7928587.22330
13-0.508264-4.63057e-06
140.1530511.39440.083465
15-0.068416-0.62330.267397
160.0125080.1140.454776
170.1076710.98090.164738
18-0.173593-1.58150.058782
190.0667490.60810.272386
200.0576160.52490.300525
21-0.078664-0.71670.237798
220.1409831.28440.101285
23-0.425828-3.87950.000104
240.5696135.18941e-06
25-0.363369-3.31040.00069
260.1250211.1390.128991
27-0.074322-0.67710.25011
280.0215350.19620.422468
290.0855670.77960.218935
30-0.12705-1.15750.125198
310.0370540.33760.368265
320.054890.50010.309173
33-0.05872-0.5350.297052
340.1298361.18290.120121
35-0.35435-3.22830.000892
360.4637194.22473.1e-05
37-0.27856-2.53780.006512
380.1054140.96040.169831
39-0.062572-0.57010.285088
400.014320.13050.448257
410.0780760.71130.239444
42-0.113827-1.0370.15137
430.0477760.43530.332251
440.0214570.19550.422747
45-0.022383-0.20390.419458
460.1035480.94340.174116
47-0.285623-2.60210.005485
480.3660223.33460.000639

\begin{tabular}{lllllllll}
\hline
Autocorrelation Function \tabularnewline
Time lag k & ACF(k) & T-STAT & P-value \tabularnewline
1 & -0.621998 & -5.6667 & 0 \tabularnewline
2 & 0.176351 & 1.6066 & 0.055966 \tabularnewline
3 & -0.06468 & -0.5893 & 0.278643 \tabularnewline
4 & 0.036335 & 0.331 & 0.370729 \tabularnewline
5 & 0.118502 & 1.0796 & 0.141723 \tabularnewline
6 & -0.213961 & -1.9493 & 0.02732 \tabularnewline
7 & 0.093428 & 0.8512 & 0.198563 \tabularnewline
8 & 0.053719 & 0.4894 & 0.312924 \tabularnewline
9 & -0.067991 & -0.6194 & 0.268667 \tabularnewline
10 & 0.159505 & 1.4532 & 0.074976 \tabularnewline
11 & -0.550425 & -5.0146 & 1e-06 \tabularnewline
12 & 0.792858 & 7.2233 & 0 \tabularnewline
13 & -0.508264 & -4.6305 & 7e-06 \tabularnewline
14 & 0.153051 & 1.3944 & 0.083465 \tabularnewline
15 & -0.068416 & -0.6233 & 0.267397 \tabularnewline
16 & 0.012508 & 0.114 & 0.454776 \tabularnewline
17 & 0.107671 & 0.9809 & 0.164738 \tabularnewline
18 & -0.173593 & -1.5815 & 0.058782 \tabularnewline
19 & 0.066749 & 0.6081 & 0.272386 \tabularnewline
20 & 0.057616 & 0.5249 & 0.300525 \tabularnewline
21 & -0.078664 & -0.7167 & 0.237798 \tabularnewline
22 & 0.140983 & 1.2844 & 0.101285 \tabularnewline
23 & -0.425828 & -3.8795 & 0.000104 \tabularnewline
24 & 0.569613 & 5.1894 & 1e-06 \tabularnewline
25 & -0.363369 & -3.3104 & 0.00069 \tabularnewline
26 & 0.125021 & 1.139 & 0.128991 \tabularnewline
27 & -0.074322 & -0.6771 & 0.25011 \tabularnewline
28 & 0.021535 & 0.1962 & 0.422468 \tabularnewline
29 & 0.085567 & 0.7796 & 0.218935 \tabularnewline
30 & -0.12705 & -1.1575 & 0.125198 \tabularnewline
31 & 0.037054 & 0.3376 & 0.368265 \tabularnewline
32 & 0.05489 & 0.5001 & 0.309173 \tabularnewline
33 & -0.05872 & -0.535 & 0.297052 \tabularnewline
34 & 0.129836 & 1.1829 & 0.120121 \tabularnewline
35 & -0.35435 & -3.2283 & 0.000892 \tabularnewline
36 & 0.463719 & 4.2247 & 3.1e-05 \tabularnewline
37 & -0.27856 & -2.5378 & 0.006512 \tabularnewline
38 & 0.105414 & 0.9604 & 0.169831 \tabularnewline
39 & -0.062572 & -0.5701 & 0.285088 \tabularnewline
40 & 0.01432 & 0.1305 & 0.448257 \tabularnewline
41 & 0.078076 & 0.7113 & 0.239444 \tabularnewline
42 & -0.113827 & -1.037 & 0.15137 \tabularnewline
43 & 0.047776 & 0.4353 & 0.332251 \tabularnewline
44 & 0.021457 & 0.1955 & 0.422747 \tabularnewline
45 & -0.022383 & -0.2039 & 0.419458 \tabularnewline
46 & 0.103548 & 0.9434 & 0.174116 \tabularnewline
47 & -0.285623 & -2.6021 & 0.005485 \tabularnewline
48 & 0.366022 & 3.3346 & 0.000639 \tabularnewline
\hline
\end{tabular}
%Source: https://freestatistics.org/blog/index.php?pk=234287&T=1

[TABLE]
[ROW][C]Autocorrelation Function[/C][/ROW]
[ROW][C]Time lag k[/C][C]ACF(k)[/C][C]T-STAT[/C][C]P-value[/C][/ROW]
[ROW][C]1[/C][C]-0.621998[/C][C]-5.6667[/C][C]0[/C][/ROW]
[ROW][C]2[/C][C]0.176351[/C][C]1.6066[/C][C]0.055966[/C][/ROW]
[ROW][C]3[/C][C]-0.06468[/C][C]-0.5893[/C][C]0.278643[/C][/ROW]
[ROW][C]4[/C][C]0.036335[/C][C]0.331[/C][C]0.370729[/C][/ROW]
[ROW][C]5[/C][C]0.118502[/C][C]1.0796[/C][C]0.141723[/C][/ROW]
[ROW][C]6[/C][C]-0.213961[/C][C]-1.9493[/C][C]0.02732[/C][/ROW]
[ROW][C]7[/C][C]0.093428[/C][C]0.8512[/C][C]0.198563[/C][/ROW]
[ROW][C]8[/C][C]0.053719[/C][C]0.4894[/C][C]0.312924[/C][/ROW]
[ROW][C]9[/C][C]-0.067991[/C][C]-0.6194[/C][C]0.268667[/C][/ROW]
[ROW][C]10[/C][C]0.159505[/C][C]1.4532[/C][C]0.074976[/C][/ROW]
[ROW][C]11[/C][C]-0.550425[/C][C]-5.0146[/C][C]1e-06[/C][/ROW]
[ROW][C]12[/C][C]0.792858[/C][C]7.2233[/C][C]0[/C][/ROW]
[ROW][C]13[/C][C]-0.508264[/C][C]-4.6305[/C][C]7e-06[/C][/ROW]
[ROW][C]14[/C][C]0.153051[/C][C]1.3944[/C][C]0.083465[/C][/ROW]
[ROW][C]15[/C][C]-0.068416[/C][C]-0.6233[/C][C]0.267397[/C][/ROW]
[ROW][C]16[/C][C]0.012508[/C][C]0.114[/C][C]0.454776[/C][/ROW]
[ROW][C]17[/C][C]0.107671[/C][C]0.9809[/C][C]0.164738[/C][/ROW]
[ROW][C]18[/C][C]-0.173593[/C][C]-1.5815[/C][C]0.058782[/C][/ROW]
[ROW][C]19[/C][C]0.066749[/C][C]0.6081[/C][C]0.272386[/C][/ROW]
[ROW][C]20[/C][C]0.057616[/C][C]0.5249[/C][C]0.300525[/C][/ROW]
[ROW][C]21[/C][C]-0.078664[/C][C]-0.7167[/C][C]0.237798[/C][/ROW]
[ROW][C]22[/C][C]0.140983[/C][C]1.2844[/C][C]0.101285[/C][/ROW]
[ROW][C]23[/C][C]-0.425828[/C][C]-3.8795[/C][C]0.000104[/C][/ROW]
[ROW][C]24[/C][C]0.569613[/C][C]5.1894[/C][C]1e-06[/C][/ROW]
[ROW][C]25[/C][C]-0.363369[/C][C]-3.3104[/C][C]0.00069[/C][/ROW]
[ROW][C]26[/C][C]0.125021[/C][C]1.139[/C][C]0.128991[/C][/ROW]
[ROW][C]27[/C][C]-0.074322[/C][C]-0.6771[/C][C]0.25011[/C][/ROW]
[ROW][C]28[/C][C]0.021535[/C][C]0.1962[/C][C]0.422468[/C][/ROW]
[ROW][C]29[/C][C]0.085567[/C][C]0.7796[/C][C]0.218935[/C][/ROW]
[ROW][C]30[/C][C]-0.12705[/C][C]-1.1575[/C][C]0.125198[/C][/ROW]
[ROW][C]31[/C][C]0.037054[/C][C]0.3376[/C][C]0.368265[/C][/ROW]
[ROW][C]32[/C][C]0.05489[/C][C]0.5001[/C][C]0.309173[/C][/ROW]
[ROW][C]33[/C][C]-0.05872[/C][C]-0.535[/C][C]0.297052[/C][/ROW]
[ROW][C]34[/C][C]0.129836[/C][C]1.1829[/C][C]0.120121[/C][/ROW]
[ROW][C]35[/C][C]-0.35435[/C][C]-3.2283[/C][C]0.000892[/C][/ROW]
[ROW][C]36[/C][C]0.463719[/C][C]4.2247[/C][C]3.1e-05[/C][/ROW]
[ROW][C]37[/C][C]-0.27856[/C][C]-2.5378[/C][C]0.006512[/C][/ROW]
[ROW][C]38[/C][C]0.105414[/C][C]0.9604[/C][C]0.169831[/C][/ROW]
[ROW][C]39[/C][C]-0.062572[/C][C]-0.5701[/C][C]0.285088[/C][/ROW]
[ROW][C]40[/C][C]0.01432[/C][C]0.1305[/C][C]0.448257[/C][/ROW]
[ROW][C]41[/C][C]0.078076[/C][C]0.7113[/C][C]0.239444[/C][/ROW]
[ROW][C]42[/C][C]-0.113827[/C][C]-1.037[/C][C]0.15137[/C][/ROW]
[ROW][C]43[/C][C]0.047776[/C][C]0.4353[/C][C]0.332251[/C][/ROW]
[ROW][C]44[/C][C]0.021457[/C][C]0.1955[/C][C]0.422747[/C][/ROW]
[ROW][C]45[/C][C]-0.022383[/C][C]-0.2039[/C][C]0.419458[/C][/ROW]
[ROW][C]46[/C][C]0.103548[/C][C]0.9434[/C][C]0.174116[/C][/ROW]
[ROW][C]47[/C][C]-0.285623[/C][C]-2.6021[/C][C]0.005485[/C][/ROW]
[ROW][C]48[/C][C]0.366022[/C][C]3.3346[/C][C]0.000639[/C][/ROW]
[/TABLE]
Source: https://freestatistics.org/blog/index.php?pk=234287&T=1

Globally Unique Identifier (entire table): ba.freestatistics.org/blog/index.php?pk=234287&T=1

As an alternative you can also use a QR Code:  

The GUIDs for individual cells are displayed in the table below:

Autocorrelation Function
Time lag kACF(k)T-STATP-value
1-0.621998-5.66670
20.1763511.60660.055966
3-0.06468-0.58930.278643
40.0363350.3310.370729
50.1185021.07960.141723
6-0.213961-1.94930.02732
70.0934280.85120.198563
80.0537190.48940.312924
9-0.067991-0.61940.268667
100.1595051.45320.074976
11-0.550425-5.01461e-06
120.7928587.22330
13-0.508264-4.63057e-06
140.1530511.39440.083465
15-0.068416-0.62330.267397
160.0125080.1140.454776
170.1076710.98090.164738
18-0.173593-1.58150.058782
190.0667490.60810.272386
200.0576160.52490.300525
21-0.078664-0.71670.237798
220.1409831.28440.101285
23-0.425828-3.87950.000104
240.5696135.18941e-06
25-0.363369-3.31040.00069
260.1250211.1390.128991
27-0.074322-0.67710.25011
280.0215350.19620.422468
290.0855670.77960.218935
30-0.12705-1.15750.125198
310.0370540.33760.368265
320.054890.50010.309173
33-0.05872-0.5350.297052
340.1298361.18290.120121
35-0.35435-3.22830.000892
360.4637194.22473.1e-05
37-0.27856-2.53780.006512
380.1054140.96040.169831
39-0.062572-0.57010.285088
400.014320.13050.448257
410.0780760.71130.239444
42-0.113827-1.0370.15137
430.0477760.43530.332251
440.0214570.19550.422747
45-0.022383-0.20390.419458
460.1035480.94340.174116
47-0.285623-2.60210.005485
480.3660223.33460.000639


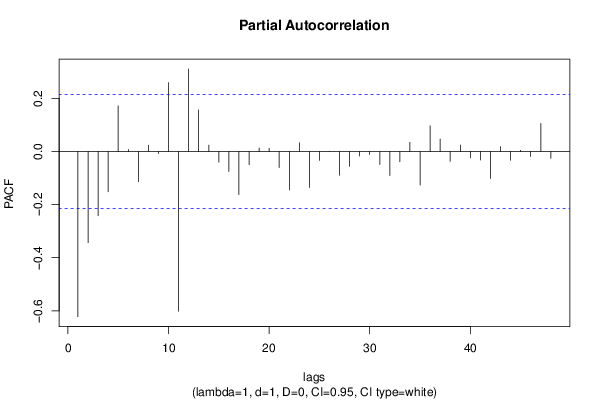
Partial Autocorrelation Function
Time lag kPACF(k)T-STATP-value
1-0.621998-5.66670
2-0.343376-3.12830.001213
3-0.242044-2.20510.015106
4-0.15205-1.38520.084845
50.1715151.56260.060979
60.007280.06630.473638
7-0.113854-1.03730.151313
80.0229930.20950.417296
9-0.007614-0.06940.472432
100.2589682.35930.010329
11-0.601566-5.48050
120.3105022.82880.002928
130.1558011.41940.079762
140.0236980.21590.414797
15-0.040372-0.36780.356977
16-0.07537-0.68670.247108
17-0.162533-1.48070.07123
18-0.050118-0.45660.324577
190.0128720.11730.453465
200.0114740.10450.458499
21-0.060651-0.55260.291027
22-0.14481-1.31930.095351
230.0329260.30.382474
24-0.136139-1.24030.109182
25-0.033611-0.30620.380105
260.0003080.00280.498884
27-0.09001-0.820.207274
28-0.056343-0.51330.304549
29-0.017263-0.15730.437707
30-0.011912-0.10850.456921
31-0.049145-0.44770.327757
32-0.090911-0.82820.204956
33-0.039185-0.3570.361001
340.034260.31210.377864
35-0.126702-1.15430.125842
360.0962550.87690.191528
370.0465060.42370.336442
38-0.037034-0.33740.368337
390.0239240.2180.414
40-0.023701-0.21590.414787
41-0.032037-0.29190.385555
42-0.101957-0.92890.177824
430.0181150.1650.434659
44-0.033279-0.30320.381254
450.0039370.03590.485738
46-0.019389-0.17660.430111
470.1052240.95860.170263
48-0.025576-0.2330.408163

\begin{tabular}{lllllllll}
\hline
Partial Autocorrelation Function \tabularnewline
Time lag k & PACF(k) & T-STAT & P-value \tabularnewline
1 & -0.621998 & -5.6667 & 0 \tabularnewline
2 & -0.343376 & -3.1283 & 0.001213 \tabularnewline
3 & -0.242044 & -2.2051 & 0.015106 \tabularnewline
4 & -0.15205 & -1.3852 & 0.084845 \tabularnewline
5 & 0.171515 & 1.5626 & 0.060979 \tabularnewline
6 & 0.00728 & 0.0663 & 0.473638 \tabularnewline
7 & -0.113854 & -1.0373 & 0.151313 \tabularnewline
8 & 0.022993 & 0.2095 & 0.417296 \tabularnewline
9 & -0.007614 & -0.0694 & 0.472432 \tabularnewline
10 & 0.258968 & 2.3593 & 0.010329 \tabularnewline
11 & -0.601566 & -5.4805 & 0 \tabularnewline
12 & 0.310502 & 2.8288 & 0.002928 \tabularnewline
13 & 0.155801 & 1.4194 & 0.079762 \tabularnewline
14 & 0.023698 & 0.2159 & 0.414797 \tabularnewline
15 & -0.040372 & -0.3678 & 0.356977 \tabularnewline
16 & -0.07537 & -0.6867 & 0.247108 \tabularnewline
17 & -0.162533 & -1.4807 & 0.07123 \tabularnewline
18 & -0.050118 & -0.4566 & 0.324577 \tabularnewline
19 & 0.012872 & 0.1173 & 0.453465 \tabularnewline
20 & 0.011474 & 0.1045 & 0.458499 \tabularnewline
21 & -0.060651 & -0.5526 & 0.291027 \tabularnewline
22 & -0.14481 & -1.3193 & 0.095351 \tabularnewline
23 & 0.032926 & 0.3 & 0.382474 \tabularnewline
24 & -0.136139 & -1.2403 & 0.109182 \tabularnewline
25 & -0.033611 & -0.3062 & 0.380105 \tabularnewline
26 & 0.000308 & 0.0028 & 0.498884 \tabularnewline
27 & -0.09001 & -0.82 & 0.207274 \tabularnewline
28 & -0.056343 & -0.5133 & 0.304549 \tabularnewline
29 & -0.017263 & -0.1573 & 0.437707 \tabularnewline
30 & -0.011912 & -0.1085 & 0.456921 \tabularnewline
31 & -0.049145 & -0.4477 & 0.327757 \tabularnewline
32 & -0.090911 & -0.8282 & 0.204956 \tabularnewline
33 & -0.039185 & -0.357 & 0.361001 \tabularnewline
34 & 0.03426 & 0.3121 & 0.377864 \tabularnewline
35 & -0.126702 & -1.1543 & 0.125842 \tabularnewline
36 & 0.096255 & 0.8769 & 0.191528 \tabularnewline
37 & 0.046506 & 0.4237 & 0.336442 \tabularnewline
38 & -0.037034 & -0.3374 & 0.368337 \tabularnewline
39 & 0.023924 & 0.218 & 0.414 \tabularnewline
40 & -0.023701 & -0.2159 & 0.414787 \tabularnewline
41 & -0.032037 & -0.2919 & 0.385555 \tabularnewline
42 & -0.101957 & -0.9289 & 0.177824 \tabularnewline
43 & 0.018115 & 0.165 & 0.434659 \tabularnewline
44 & -0.033279 & -0.3032 & 0.381254 \tabularnewline
45 & 0.003937 & 0.0359 & 0.485738 \tabularnewline
46 & -0.019389 & -0.1766 & 0.430111 \tabularnewline
47 & 0.105224 & 0.9586 & 0.170263 \tabularnewline
48 & -0.025576 & -0.233 & 0.408163 \tabularnewline
\hline
\end{tabular}
%Source: https://freestatistics.org/blog/index.php?pk=234287&T=2

[TABLE]
[ROW][C]Partial Autocorrelation Function[/C][/ROW]
[ROW][C]Time lag k[/C][C]PACF(k)[/C][C]T-STAT[/C][C]P-value[/C][/ROW]
[ROW][C]1[/C][C]-0.621998[/C][C]-5.6667[/C][C]0[/C][/ROW]
[ROW][C]2[/C][C]-0.343376[/C][C]-3.1283[/C][C]0.001213[/C][/ROW]
[ROW][C]3[/C][C]-0.242044[/C][C]-2.2051[/C][C]0.015106[/C][/ROW]
[ROW][C]4[/C][C]-0.15205[/C][C]-1.3852[/C][C]0.084845[/C][/ROW]
[ROW][C]5[/C][C]0.171515[/C][C]1.5626[/C][C]0.060979[/C][/ROW]
[ROW][C]6[/C][C]0.00728[/C][C]0.0663[/C][C]0.473638[/C][/ROW]
[ROW][C]7[/C][C]-0.113854[/C][C]-1.0373[/C][C]0.151313[/C][/ROW]
[ROW][C]8[/C][C]0.022993[/C][C]0.2095[/C][C]0.417296[/C][/ROW]
[ROW][C]9[/C][C]-0.007614[/C][C]-0.0694[/C][C]0.472432[/C][/ROW]
[ROW][C]10[/C][C]0.258968[/C][C]2.3593[/C][C]0.010329[/C][/ROW]
[ROW][C]11[/C][C]-0.601566[/C][C]-5.4805[/C][C]0[/C][/ROW]
[ROW][C]12[/C][C]0.310502[/C][C]2.8288[/C][C]0.002928[/C][/ROW]
[ROW][C]13[/C][C]0.155801[/C][C]1.4194[/C][C]0.079762[/C][/ROW]
[ROW][C]14[/C][C]0.023698[/C][C]0.2159[/C][C]0.414797[/C][/ROW]
[ROW][C]15[/C][C]-0.040372[/C][C]-0.3678[/C][C]0.356977[/C][/ROW]
[ROW][C]16[/C][C]-0.07537[/C][C]-0.6867[/C][C]0.247108[/C][/ROW]
[ROW][C]17[/C][C]-0.162533[/C][C]-1.4807[/C][C]0.07123[/C][/ROW]
[ROW][C]18[/C][C]-0.050118[/C][C]-0.4566[/C][C]0.324577[/C][/ROW]
[ROW][C]19[/C][C]0.012872[/C][C]0.1173[/C][C]0.453465[/C][/ROW]
[ROW][C]20[/C][C]0.011474[/C][C]0.1045[/C][C]0.458499[/C][/ROW]
[ROW][C]21[/C][C]-0.060651[/C][C]-0.5526[/C][C]0.291027[/C][/ROW]
[ROW][C]22[/C][C]-0.14481[/C][C]-1.3193[/C][C]0.095351[/C][/ROW]
[ROW][C]23[/C][C]0.032926[/C][C]0.3[/C][C]0.382474[/C][/ROW]
[ROW][C]24[/C][C]-0.136139[/C][C]-1.2403[/C][C]0.109182[/C][/ROW]
[ROW][C]25[/C][C]-0.033611[/C][C]-0.3062[/C][C]0.380105[/C][/ROW]
[ROW][C]26[/C][C]0.000308[/C][C]0.0028[/C][C]0.498884[/C][/ROW]
[ROW][C]27[/C][C]-0.09001[/C][C]-0.82[/C][C]0.207274[/C][/ROW]
[ROW][C]28[/C][C]-0.056343[/C][C]-0.5133[/C][C]0.304549[/C][/ROW]
[ROW][C]29[/C][C]-0.017263[/C][C]-0.1573[/C][C]0.437707[/C][/ROW]
[ROW][C]30[/C][C]-0.011912[/C][C]-0.1085[/C][C]0.456921[/C][/ROW]
[ROW][C]31[/C][C]-0.049145[/C][C]-0.4477[/C][C]0.327757[/C][/ROW]
[ROW][C]32[/C][C]-0.090911[/C][C]-0.8282[/C][C]0.204956[/C][/ROW]
[ROW][C]33[/C][C]-0.039185[/C][C]-0.357[/C][C]0.361001[/C][/ROW]
[ROW][C]34[/C][C]0.03426[/C][C]0.3121[/C][C]0.377864[/C][/ROW]
[ROW][C]35[/C][C]-0.126702[/C][C]-1.1543[/C][C]0.125842[/C][/ROW]
[ROW][C]36[/C][C]0.096255[/C][C]0.8769[/C][C]0.191528[/C][/ROW]
[ROW][C]37[/C][C]0.046506[/C][C]0.4237[/C][C]0.336442[/C][/ROW]
[ROW][C]38[/C][C]-0.037034[/C][C]-0.3374[/C][C]0.368337[/C][/ROW]
[ROW][C]39[/C][C]0.023924[/C][C]0.218[/C][C]0.414[/C][/ROW]
[ROW][C]40[/C][C]-0.023701[/C][C]-0.2159[/C][C]0.414787[/C][/ROW]
[ROW][C]41[/C][C]-0.032037[/C][C]-0.2919[/C][C]0.385555[/C][/ROW]
[ROW][C]42[/C][C]-0.101957[/C][C]-0.9289[/C][C]0.177824[/C][/ROW]
[ROW][C]43[/C][C]0.018115[/C][C]0.165[/C][C]0.434659[/C][/ROW]
[ROW][C]44[/C][C]-0.033279[/C][C]-0.3032[/C][C]0.381254[/C][/ROW]
[ROW][C]45[/C][C]0.003937[/C][C]0.0359[/C][C]0.485738[/C][/ROW]
[ROW][C]46[/C][C]-0.019389[/C][C]-0.1766[/C][C]0.430111[/C][/ROW]
[ROW][C]47[/C][C]0.105224[/C][C]0.9586[/C][C]0.170263[/C][/ROW]
[ROW][C]48[/C][C]-0.025576[/C][C]-0.233[/C][C]0.408163[/C][/ROW]
[/TABLE]
Source: https://freestatistics.org/blog/index.php?pk=234287&T=2

Globally Unique Identifier (entire table): ba.freestatistics.org/blog/index.php?pk=234287&T=2

As an alternative you can also use a QR Code:  

The GUIDs for individual cells are displayed in the table below:

Partial Autocorrelation Function
Time lag kPACF(k)T-STATP-value
1-0.621998-5.66670
2-0.343376-3.12830.001213
3-0.242044-2.20510.015106
4-0.15205-1.38520.084845
50.1715151.56260.060979
60.007280.06630.473638
7-0.113854-1.03730.151313
80.0229930.20950.417296
9-0.007614-0.06940.472432
100.2589682.35930.010329
11-0.601566-5.48050
120.3105022.82880.002928
130.1558011.41940.079762
140.0236980.21590.414797
15-0.040372-0.36780.356977
16-0.07537-0.68670.247108
17-0.162533-1.48070.07123
18-0.050118-0.45660.324577
190.0128720.11730.453465
200.0114740.10450.458499
21-0.060651-0.55260.291027
22-0.14481-1.31930.095351
230.0329260.30.382474
24-0.136139-1.24030.109182
25-0.033611-0.30620.380105
260.0003080.00280.498884
27-0.09001-0.820.207274
28-0.056343-0.51330.304549
29-0.017263-0.15730.437707
30-0.011912-0.10850.456921
31-0.049145-0.44770.327757
32-0.090911-0.82820.204956
33-0.039185-0.3570.361001
340.034260.31210.377864
35-0.126702-1.15430.125842
360.0962550.87690.191528
370.0465060.42370.336442
38-0.037034-0.33740.368337
390.0239240.2180.414
40-0.023701-0.21590.414787
41-0.032037-0.29190.385555
42-0.101957-0.92890.177824
430.0181150.1650.434659
44-0.033279-0.30320.381254
450.0039370.03590.485738
46-0.019389-0.17660.430111
470.1052240.95860.170263
48-0.025576-0.2330.408163


Parameters (Session):
par1 = 48 ; par2 = 1 ; par3 = 1 ; par4 = 0 ; par5 = 12 ; par6 = White Noise ; par7 = 0.95 ;
Parameters (R input):
par1 = 48 ; par2 = 1 ; par3 = 1 ; par4 = 0 ; par5 = 12 ; par6 = White Noise ; par7 = 0.95 ; par8 = ;
R code (references can be found in the software module):
if (par1 == 'Default') {
par1 = 10*log10(length(x))
} else {
par1 <- as.numeric(par1)
}
par2 <- as.numeric(par2)
par3 <- as.numeric(par3)
par4 <- as.numeric(par4)
par5 <- as.numeric(par5)
if (par6 == 'White Noise') par6 <- 'white' else par6 <- 'ma'
par7 <- as.numeric(par7)
if (par8 != '') par8 <- as.numeric(par8)
ox <- x
if (par8 == '') {
if (par2 == 0) {
x <- log(x)
} else {
x <- (x ^ par2 - 1) / par2
}
} else {
x <- log(x,base=par8)
}
if (par3 > 0) x <- diff(x,lag=1,difference=par3)
if (par4 > 0) x <- diff(x,lag=par5,difference=par4)
bitmap(file='picts.png')
op <- par(mfrow=c(2,1))
plot(ox,type='l',main='Original Time Series',xlab='time',ylab='value')
if (par8=='') {
mytitle <- paste('Working Time Series (lambda=',par2,', d=',par3,', D=',par4,')',sep='')
mysub <- paste('(lambda=',par2,', d=',par3,', D=',par4,', CI=', par7, ', CI type=',par6,')',sep='')
} else {
mytitle <- paste('Working Time Series (base=',par8,', d=',par3,', D=',par4,')',sep='')
mysub <- paste('(base=',par8,', d=',par3,', D=',par4,', CI=', par7, ', CI type=',par6,')',sep='')
}
plot(x,type='l', main=mytitle,xlab='time',ylab='value')
par(op)
dev.off()
bitmap(file='pic1.png')
racf <- acf(x, par1, main='Autocorrelation', xlab='time lag', ylab='ACF', ci.type=par6, ci=par7, sub=mysub)
dev.off()
bitmap(file='pic2.png')
rpacf <- pacf(x,par1,main='Partial Autocorrelation',xlab='lags',ylab='PACF',sub=mysub)
dev.off()
(myacf <- c(racf$acf))
(mypacf <- c(rpacf$acf))
lengthx <- length(x)
sqrtn <- sqrt(lengthx)
load(file='createtable')
a<-table.start()
a<-table.row.start(a)
a<-table.element(a,'Autocorrelation Function',4,TRUE)
a<-table.row.end(a)
a<-table.row.start(a)
a<-table.element(a,'Time lag k',header=TRUE)
a<-table.element(a,hyperlink('basics.htm','ACF(k)','click here for more information about the Autocorrelation Function'),header=TRUE)
a<-table.element(a,'T-STAT',header=TRUE)
a<-table.element(a,'P-value',header=TRUE)
a<-table.row.end(a)
for (i in 2:(par1+1)) {
a<-table.row.start(a)
a<-table.element(a,i-1,header=TRUE)
a<-table.element(a,round(myacf[i],6))
mytstat <- myacf[i]*sqrtn
a<-table.element(a,round(mytstat,4))
a<-table.element(a,round(1-pt(abs(mytstat),lengthx),6))
a<-table.row.end(a)
}
a<-table.end(a)
table.save(a,file='mytable.tab')
a<-table.start()
a<-table.row.start(a)
a<-table.element(a,'Partial Autocorrelation Function',4,TRUE)
a<-table.row.end(a)
a<-table.row.start(a)
a<-table.element(a,'Time lag k',header=TRUE)
a<-table.element(a,hyperlink('basics.htm','PACF(k)','click here for more information about the Partial Autocorrelation Function'),header=TRUE)
a<-table.element(a,'T-STAT',header=TRUE)
a<-table.element(a,'P-value',header=TRUE)
a<-table.row.end(a)
for (i in 1:par1) {
a<-table.row.start(a)
a<-table.element(a,i,header=TRUE)
a<-table.element(a,round(mypacf[i],6))
mytstat <- mypacf[i]*sqrtn
a<-table.element(a,round(mytstat,4))
a<-table.element(a,round(1-pt(abs(mytstat),lengthx),6))
a<-table.row.end(a)
}
a<-table.end(a)
table.save(a,file='mytable1.tab')