Free Statistics

of Irreproducible Research!

Author's title

Author*Unverified author*
R Software Modulerwasp_autocorrelation.wasp
Title produced by software(Partial) Autocorrelation Function
Date of computationSat, 15 Mar 2014 09:40:12 -0400
Cite this page as followsStatistical Computations at FreeStatistics.org, Office for Research Development and Education, URL https://freestatistics.org/blog/index.php?v=date/2014/Mar/15/t1394890840xqwbdmq8o8t85z7.htm/, Retrieved Mon, 13 May 2024 21:51:30 +0000
Statistical Computations at FreeStatistics.org, Office for Research Development and Education, URL https://freestatistics.org/blog/index.php?pk=234259, Retrieved Mon, 13 May 2024 21:51:30 +0000
QR Codes:

Original text written by user:
IsPrivate?No (this computation is public)
User-defined keywords
Estimated Impact163
Family? (F = Feedback message, R = changed R code, M = changed R Module, P = changed Parameters, D = changed Data)
-       [(Partial) Autocorrelation Function] [Verkoop Mini Nede...] [2014-03-15 13:40:12] [778963f9ed1fb67b9d5ff0854a52552f] [Current]
Feedback Forum

Post a new message
Dataseries X:
254
200
165
123
162
145
145
161
155
173
160
47
232
143
161
159
243
192
157
143
221
227
132
41
273
182
188
162
140
186
178
236
202
184
119
16
340
151
240
235
174
309
174
207
209
171
117
10
339
139
186
155
153
222
102
107
188
162
185
24
394
209
248
254
202
258
215
309
240
258
276
48
455
345
311
346
310
297
300
274
292
304
186
14
321
206
160
217
204
246
234
175
364
328
158
40
556
193
221
278
230
253
240
252
228
306
206
48
557
279
399
364
306
471
293
333
316
329
265
61
679
428
394
352
387
590
177
199
203
255
261
115


Summary of computational transaction
Raw Inputview raw input (R code)
Raw Outputview raw output of R engine
Computing time4 seconds
R Server'Gertrude Mary Cox' @ cox.wessa.net

\begin{tabular}{lllllllll}
\hline
Summary of computational transaction \tabularnewline
Raw Input & view raw input (R code)  \tabularnewline
Raw Output & view raw output of R engine  \tabularnewline
Computing time & 4 seconds \tabularnewline
R Server & 'Gertrude Mary Cox' @ cox.wessa.net \tabularnewline
\hline
\end{tabular}
%Source: https://freestatistics.org/blog/index.php?pk=234259&T=0

[TABLE]
[ROW][C]Summary of computational transaction[/C][/ROW]
[ROW][C]Raw Input[/C][C]view raw input (R code) [/C][/ROW]
[ROW][C]Raw Output[/C][C]view raw output of R engine [/C][/ROW]
[ROW][C]Computing time[/C][C]4 seconds[/C][/ROW]
[ROW][C]R Server[/C][C]'Gertrude Mary Cox' @ cox.wessa.net[/C][/ROW]
[/TABLE]
Source: https://freestatistics.org/blog/index.php?pk=234259&T=0

Globally Unique Identifier (entire table): ba.freestatistics.org/blog/index.php?pk=234259&T=0

As an alternative you can also use a QR Code:  

The GUIDs for individual cells are displayed in the table below:

Summary of computational transaction
Raw Inputview raw input (R code)
Raw Outputview raw output of R engine
Computing time4 seconds
R Server'Gertrude Mary Cox' @ cox.wessa.net


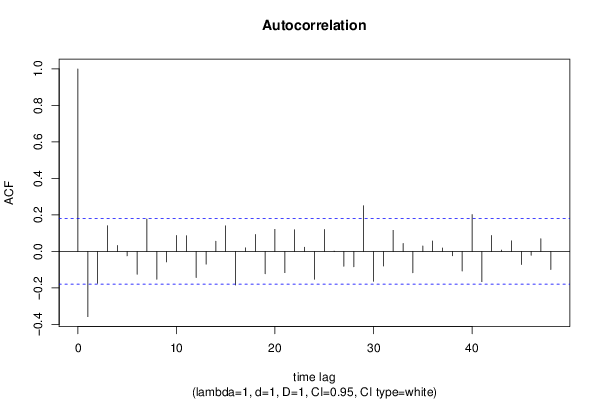
Autocorrelation Function
Time lag kACF(k)T-STATP-value
1-0.357435-3.89928e-05
2-0.175138-1.91050.029236
30.1403521.53110.064204
40.0320840.350.363481
5-0.024259-0.26460.395876
6-0.125018-1.36380.087605
70.1777631.93920.027424
8-0.152785-1.66670.049103
9-0.057479-0.6270.265922
100.0873460.95280.171304
110.085860.93660.175426
12-0.143281-1.5630.060352
13-0.069698-0.76030.224284
140.0561660.61270.270623
150.1401551.52890.064471
16-0.183902-2.00610.023555
170.0193890.21150.416427
180.0925571.00970.157348
19-0.122124-1.33220.092668
200.1209311.31920.094818
21-0.116111-1.26660.103883
220.1190111.29830.098356
230.0230410.25130.400989
24-0.15232-1.66160.049611
250.1198971.30790.096711
260.0016580.01810.492798
27-0.08155-0.88960.187736
28-0.084149-0.9180.18025
290.2503032.73050.003643
30-0.163105-1.77930.038874
31-0.080179-0.87470.191763
320.1155781.26080.104923
330.0430360.46950.319796
34-0.116469-1.27050.103187
350.0293790.32050.374582
360.0567990.61960.268352
370.0183870.20060.420686
38-0.023754-0.25910.397992
39-0.106972-1.16690.122786
400.20162.19920.014899
41-0.165677-1.80730.036619
420.0876530.95620.17046
430.0071730.07820.468882
440.0577670.63020.264899
45-0.071962-0.7850.217004
46-0.020678-0.22560.410962
470.0690890.75370.226267
48-0.099412-1.08450.140177

\begin{tabular}{lllllllll}
\hline
Autocorrelation Function \tabularnewline
Time lag k & ACF(k) & T-STAT & P-value \tabularnewline
1 & -0.357435 & -3.8992 & 8e-05 \tabularnewline
2 & -0.175138 & -1.9105 & 0.029236 \tabularnewline
3 & 0.140352 & 1.5311 & 0.064204 \tabularnewline
4 & 0.032084 & 0.35 & 0.363481 \tabularnewline
5 & -0.024259 & -0.2646 & 0.395876 \tabularnewline
6 & -0.125018 & -1.3638 & 0.087605 \tabularnewline
7 & 0.177763 & 1.9392 & 0.027424 \tabularnewline
8 & -0.152785 & -1.6667 & 0.049103 \tabularnewline
9 & -0.057479 & -0.627 & 0.265922 \tabularnewline
10 & 0.087346 & 0.9528 & 0.171304 \tabularnewline
11 & 0.08586 & 0.9366 & 0.175426 \tabularnewline
12 & -0.143281 & -1.563 & 0.060352 \tabularnewline
13 & -0.069698 & -0.7603 & 0.224284 \tabularnewline
14 & 0.056166 & 0.6127 & 0.270623 \tabularnewline
15 & 0.140155 & 1.5289 & 0.064471 \tabularnewline
16 & -0.183902 & -2.0061 & 0.023555 \tabularnewline
17 & 0.019389 & 0.2115 & 0.416427 \tabularnewline
18 & 0.092557 & 1.0097 & 0.157348 \tabularnewline
19 & -0.122124 & -1.3322 & 0.092668 \tabularnewline
20 & 0.120931 & 1.3192 & 0.094818 \tabularnewline
21 & -0.116111 & -1.2666 & 0.103883 \tabularnewline
22 & 0.119011 & 1.2983 & 0.098356 \tabularnewline
23 & 0.023041 & 0.2513 & 0.400989 \tabularnewline
24 & -0.15232 & -1.6616 & 0.049611 \tabularnewline
25 & 0.119897 & 1.3079 & 0.096711 \tabularnewline
26 & 0.001658 & 0.0181 & 0.492798 \tabularnewline
27 & -0.08155 & -0.8896 & 0.187736 \tabularnewline
28 & -0.084149 & -0.918 & 0.18025 \tabularnewline
29 & 0.250303 & 2.7305 & 0.003643 \tabularnewline
30 & -0.163105 & -1.7793 & 0.038874 \tabularnewline
31 & -0.080179 & -0.8747 & 0.191763 \tabularnewline
32 & 0.115578 & 1.2608 & 0.104923 \tabularnewline
33 & 0.043036 & 0.4695 & 0.319796 \tabularnewline
34 & -0.116469 & -1.2705 & 0.103187 \tabularnewline
35 & 0.029379 & 0.3205 & 0.374582 \tabularnewline
36 & 0.056799 & 0.6196 & 0.268352 \tabularnewline
37 & 0.018387 & 0.2006 & 0.420686 \tabularnewline
38 & -0.023754 & -0.2591 & 0.397992 \tabularnewline
39 & -0.106972 & -1.1669 & 0.122786 \tabularnewline
40 & 0.2016 & 2.1992 & 0.014899 \tabularnewline
41 & -0.165677 & -1.8073 & 0.036619 \tabularnewline
42 & 0.087653 & 0.9562 & 0.17046 \tabularnewline
43 & 0.007173 & 0.0782 & 0.468882 \tabularnewline
44 & 0.057767 & 0.6302 & 0.264899 \tabularnewline
45 & -0.071962 & -0.785 & 0.217004 \tabularnewline
46 & -0.020678 & -0.2256 & 0.410962 \tabularnewline
47 & 0.069089 & 0.7537 & 0.226267 \tabularnewline
48 & -0.099412 & -1.0845 & 0.140177 \tabularnewline
\hline
\end{tabular}
%Source: https://freestatistics.org/blog/index.php?pk=234259&T=1

[TABLE]
[ROW][C]Autocorrelation Function[/C][/ROW]
[ROW][C]Time lag k[/C][C]ACF(k)[/C][C]T-STAT[/C][C]P-value[/C][/ROW]
[ROW][C]1[/C][C]-0.357435[/C][C]-3.8992[/C][C]8e-05[/C][/ROW]
[ROW][C]2[/C][C]-0.175138[/C][C]-1.9105[/C][C]0.029236[/C][/ROW]
[ROW][C]3[/C][C]0.140352[/C][C]1.5311[/C][C]0.064204[/C][/ROW]
[ROW][C]4[/C][C]0.032084[/C][C]0.35[/C][C]0.363481[/C][/ROW]
[ROW][C]5[/C][C]-0.024259[/C][C]-0.2646[/C][C]0.395876[/C][/ROW]
[ROW][C]6[/C][C]-0.125018[/C][C]-1.3638[/C][C]0.087605[/C][/ROW]
[ROW][C]7[/C][C]0.177763[/C][C]1.9392[/C][C]0.027424[/C][/ROW]
[ROW][C]8[/C][C]-0.152785[/C][C]-1.6667[/C][C]0.049103[/C][/ROW]
[ROW][C]9[/C][C]-0.057479[/C][C]-0.627[/C][C]0.265922[/C][/ROW]
[ROW][C]10[/C][C]0.087346[/C][C]0.9528[/C][C]0.171304[/C][/ROW]
[ROW][C]11[/C][C]0.08586[/C][C]0.9366[/C][C]0.175426[/C][/ROW]
[ROW][C]12[/C][C]-0.143281[/C][C]-1.563[/C][C]0.060352[/C][/ROW]
[ROW][C]13[/C][C]-0.069698[/C][C]-0.7603[/C][C]0.224284[/C][/ROW]
[ROW][C]14[/C][C]0.056166[/C][C]0.6127[/C][C]0.270623[/C][/ROW]
[ROW][C]15[/C][C]0.140155[/C][C]1.5289[/C][C]0.064471[/C][/ROW]
[ROW][C]16[/C][C]-0.183902[/C][C]-2.0061[/C][C]0.023555[/C][/ROW]
[ROW][C]17[/C][C]0.019389[/C][C]0.2115[/C][C]0.416427[/C][/ROW]
[ROW][C]18[/C][C]0.092557[/C][C]1.0097[/C][C]0.157348[/C][/ROW]
[ROW][C]19[/C][C]-0.122124[/C][C]-1.3322[/C][C]0.092668[/C][/ROW]
[ROW][C]20[/C][C]0.120931[/C][C]1.3192[/C][C]0.094818[/C][/ROW]
[ROW][C]21[/C][C]-0.116111[/C][C]-1.2666[/C][C]0.103883[/C][/ROW]
[ROW][C]22[/C][C]0.119011[/C][C]1.2983[/C][C]0.098356[/C][/ROW]
[ROW][C]23[/C][C]0.023041[/C][C]0.2513[/C][C]0.400989[/C][/ROW]
[ROW][C]24[/C][C]-0.15232[/C][C]-1.6616[/C][C]0.049611[/C][/ROW]
[ROW][C]25[/C][C]0.119897[/C][C]1.3079[/C][C]0.096711[/C][/ROW]
[ROW][C]26[/C][C]0.001658[/C][C]0.0181[/C][C]0.492798[/C][/ROW]
[ROW][C]27[/C][C]-0.08155[/C][C]-0.8896[/C][C]0.187736[/C][/ROW]
[ROW][C]28[/C][C]-0.084149[/C][C]-0.918[/C][C]0.18025[/C][/ROW]
[ROW][C]29[/C][C]0.250303[/C][C]2.7305[/C][C]0.003643[/C][/ROW]
[ROW][C]30[/C][C]-0.163105[/C][C]-1.7793[/C][C]0.038874[/C][/ROW]
[ROW][C]31[/C][C]-0.080179[/C][C]-0.8747[/C][C]0.191763[/C][/ROW]
[ROW][C]32[/C][C]0.115578[/C][C]1.2608[/C][C]0.104923[/C][/ROW]
[ROW][C]33[/C][C]0.043036[/C][C]0.4695[/C][C]0.319796[/C][/ROW]
[ROW][C]34[/C][C]-0.116469[/C][C]-1.2705[/C][C]0.103187[/C][/ROW]
[ROW][C]35[/C][C]0.029379[/C][C]0.3205[/C][C]0.374582[/C][/ROW]
[ROW][C]36[/C][C]0.056799[/C][C]0.6196[/C][C]0.268352[/C][/ROW]
[ROW][C]37[/C][C]0.018387[/C][C]0.2006[/C][C]0.420686[/C][/ROW]
[ROW][C]38[/C][C]-0.023754[/C][C]-0.2591[/C][C]0.397992[/C][/ROW]
[ROW][C]39[/C][C]-0.106972[/C][C]-1.1669[/C][C]0.122786[/C][/ROW]
[ROW][C]40[/C][C]0.2016[/C][C]2.1992[/C][C]0.014899[/C][/ROW]
[ROW][C]41[/C][C]-0.165677[/C][C]-1.8073[/C][C]0.036619[/C][/ROW]
[ROW][C]42[/C][C]0.087653[/C][C]0.9562[/C][C]0.17046[/C][/ROW]
[ROW][C]43[/C][C]0.007173[/C][C]0.0782[/C][C]0.468882[/C][/ROW]
[ROW][C]44[/C][C]0.057767[/C][C]0.6302[/C][C]0.264899[/C][/ROW]
[ROW][C]45[/C][C]-0.071962[/C][C]-0.785[/C][C]0.217004[/C][/ROW]
[ROW][C]46[/C][C]-0.020678[/C][C]-0.2256[/C][C]0.410962[/C][/ROW]
[ROW][C]47[/C][C]0.069089[/C][C]0.7537[/C][C]0.226267[/C][/ROW]
[ROW][C]48[/C][C]-0.099412[/C][C]-1.0845[/C][C]0.140177[/C][/ROW]
[/TABLE]
Source: https://freestatistics.org/blog/index.php?pk=234259&T=1

Globally Unique Identifier (entire table): ba.freestatistics.org/blog/index.php?pk=234259&T=1

As an alternative you can also use a QR Code:  

The GUIDs for individual cells are displayed in the table below:

Autocorrelation Function
Time lag kACF(k)T-STATP-value
1-0.357435-3.89928e-05
2-0.175138-1.91050.029236
30.1403521.53110.064204
40.0320840.350.363481
5-0.024259-0.26460.395876
6-0.125018-1.36380.087605
70.1777631.93920.027424
8-0.152785-1.66670.049103
9-0.057479-0.6270.265922
100.0873460.95280.171304
110.085860.93660.175426
12-0.143281-1.5630.060352
13-0.069698-0.76030.224284
140.0561660.61270.270623
150.1401551.52890.064471
16-0.183902-2.00610.023555
170.0193890.21150.416427
180.0925571.00970.157348
19-0.122124-1.33220.092668
200.1209311.31920.094818
21-0.116111-1.26660.103883
220.1190111.29830.098356
230.0230410.25130.400989
24-0.15232-1.66160.049611
250.1198971.30790.096711
260.0016580.01810.492798
27-0.08155-0.88960.187736
28-0.084149-0.9180.18025
290.2503032.73050.003643
30-0.163105-1.77930.038874
31-0.080179-0.87470.191763
320.1155781.26080.104923
330.0430360.46950.319796
34-0.116469-1.27050.103187
350.0293790.32050.374582
360.0567990.61960.268352
370.0183870.20060.420686
38-0.023754-0.25910.397992
39-0.106972-1.16690.122786
400.20162.19920.014899
41-0.165677-1.80730.036619
420.0876530.95620.17046
430.0071730.07820.468882
440.0577670.63020.264899
45-0.071962-0.7850.217004
46-0.020678-0.22560.410962
470.0690890.75370.226267
48-0.099412-1.08450.140177


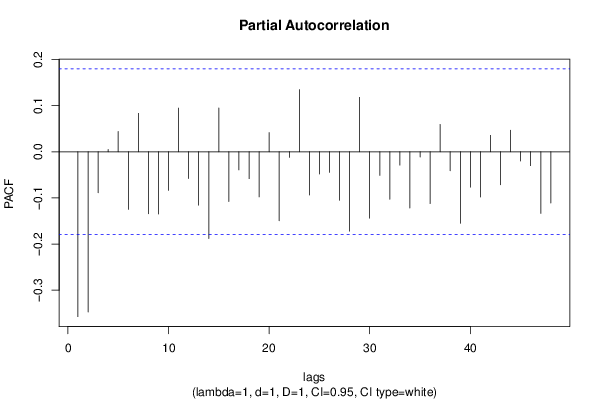
Partial Autocorrelation Function
Time lag kPACF(k)T-STATP-value
1-0.357435-3.89928e-05
2-0.347264-3.78820.00012
3-0.088796-0.96860.167343
40.0051940.05670.477454
50.0438820.47870.316515
6-0.124929-1.36280.087758
70.0834020.90980.182381
8-0.134235-1.46430.07287
9-0.134777-1.47020.072068
10-0.083625-0.91220.181743
110.094731.03340.151759
12-0.057886-0.63150.264474
13-0.115639-1.26150.104804
14-0.188123-2.05220.021173
150.0948431.03460.151474
16-0.107834-1.17630.120905
17-0.039169-0.42730.334972
18-0.058212-0.6350.263318
19-0.097798-1.06680.1441
200.0415790.45360.32548
21-0.14943-1.63010.052864
22-0.012137-0.13240.447446
230.1348721.47130.071927
24-0.093541-1.02040.154801
25-0.048128-0.5250.300274
26-0.044672-0.48730.313466
27-0.104904-1.14440.127384
28-0.171965-1.87590.031559
290.1180961.28830.100074
30-0.14376-1.56820.059741
31-0.051124-0.55770.289049
32-0.102824-1.12170.132129
33-0.02886-0.31480.376722
34-0.121849-1.32920.09316
35-0.011366-0.1240.450768
36-0.112308-1.22510.111472
370.0594360.64840.258999
38-0.041118-0.44850.327288
39-0.154874-1.68950.046873
40-0.076547-0.8350.202687
41-0.098156-1.07080.143223
420.0356840.38930.348887
43-0.071446-0.77940.218651
440.0468650.51120.305067
45-0.020029-0.21850.413711
46-0.029935-0.32660.37229
47-0.133457-1.45580.074034
48-0.110884-1.20960.114414

\begin{tabular}{lllllllll}
\hline
Partial Autocorrelation Function \tabularnewline
Time lag k & PACF(k) & T-STAT & P-value \tabularnewline
1 & -0.357435 & -3.8992 & 8e-05 \tabularnewline
2 & -0.347264 & -3.7882 & 0.00012 \tabularnewline
3 & -0.088796 & -0.9686 & 0.167343 \tabularnewline
4 & 0.005194 & 0.0567 & 0.477454 \tabularnewline
5 & 0.043882 & 0.4787 & 0.316515 \tabularnewline
6 & -0.124929 & -1.3628 & 0.087758 \tabularnewline
7 & 0.083402 & 0.9098 & 0.182381 \tabularnewline
8 & -0.134235 & -1.4643 & 0.07287 \tabularnewline
9 & -0.134777 & -1.4702 & 0.072068 \tabularnewline
10 & -0.083625 & -0.9122 & 0.181743 \tabularnewline
11 & 0.09473 & 1.0334 & 0.151759 \tabularnewline
12 & -0.057886 & -0.6315 & 0.264474 \tabularnewline
13 & -0.115639 & -1.2615 & 0.104804 \tabularnewline
14 & -0.188123 & -2.0522 & 0.021173 \tabularnewline
15 & 0.094843 & 1.0346 & 0.151474 \tabularnewline
16 & -0.107834 & -1.1763 & 0.120905 \tabularnewline
17 & -0.039169 & -0.4273 & 0.334972 \tabularnewline
18 & -0.058212 & -0.635 & 0.263318 \tabularnewline
19 & -0.097798 & -1.0668 & 0.1441 \tabularnewline
20 & 0.041579 & 0.4536 & 0.32548 \tabularnewline
21 & -0.14943 & -1.6301 & 0.052864 \tabularnewline
22 & -0.012137 & -0.1324 & 0.447446 \tabularnewline
23 & 0.134872 & 1.4713 & 0.071927 \tabularnewline
24 & -0.093541 & -1.0204 & 0.154801 \tabularnewline
25 & -0.048128 & -0.525 & 0.300274 \tabularnewline
26 & -0.044672 & -0.4873 & 0.313466 \tabularnewline
27 & -0.104904 & -1.1444 & 0.127384 \tabularnewline
28 & -0.171965 & -1.8759 & 0.031559 \tabularnewline
29 & 0.118096 & 1.2883 & 0.100074 \tabularnewline
30 & -0.14376 & -1.5682 & 0.059741 \tabularnewline
31 & -0.051124 & -0.5577 & 0.289049 \tabularnewline
32 & -0.102824 & -1.1217 & 0.132129 \tabularnewline
33 & -0.02886 & -0.3148 & 0.376722 \tabularnewline
34 & -0.121849 & -1.3292 & 0.09316 \tabularnewline
35 & -0.011366 & -0.124 & 0.450768 \tabularnewline
36 & -0.112308 & -1.2251 & 0.111472 \tabularnewline
37 & 0.059436 & 0.6484 & 0.258999 \tabularnewline
38 & -0.041118 & -0.4485 & 0.327288 \tabularnewline
39 & -0.154874 & -1.6895 & 0.046873 \tabularnewline
40 & -0.076547 & -0.835 & 0.202687 \tabularnewline
41 & -0.098156 & -1.0708 & 0.143223 \tabularnewline
42 & 0.035684 & 0.3893 & 0.348887 \tabularnewline
43 & -0.071446 & -0.7794 & 0.218651 \tabularnewline
44 & 0.046865 & 0.5112 & 0.305067 \tabularnewline
45 & -0.020029 & -0.2185 & 0.413711 \tabularnewline
46 & -0.029935 & -0.3266 & 0.37229 \tabularnewline
47 & -0.133457 & -1.4558 & 0.074034 \tabularnewline
48 & -0.110884 & -1.2096 & 0.114414 \tabularnewline
\hline
\end{tabular}
%Source: https://freestatistics.org/blog/index.php?pk=234259&T=2

[TABLE]
[ROW][C]Partial Autocorrelation Function[/C][/ROW]
[ROW][C]Time lag k[/C][C]PACF(k)[/C][C]T-STAT[/C][C]P-value[/C][/ROW]
[ROW][C]1[/C][C]-0.357435[/C][C]-3.8992[/C][C]8e-05[/C][/ROW]
[ROW][C]2[/C][C]-0.347264[/C][C]-3.7882[/C][C]0.00012[/C][/ROW]
[ROW][C]3[/C][C]-0.088796[/C][C]-0.9686[/C][C]0.167343[/C][/ROW]
[ROW][C]4[/C][C]0.005194[/C][C]0.0567[/C][C]0.477454[/C][/ROW]
[ROW][C]5[/C][C]0.043882[/C][C]0.4787[/C][C]0.316515[/C][/ROW]
[ROW][C]6[/C][C]-0.124929[/C][C]-1.3628[/C][C]0.087758[/C][/ROW]
[ROW][C]7[/C][C]0.083402[/C][C]0.9098[/C][C]0.182381[/C][/ROW]
[ROW][C]8[/C][C]-0.134235[/C][C]-1.4643[/C][C]0.07287[/C][/ROW]
[ROW][C]9[/C][C]-0.134777[/C][C]-1.4702[/C][C]0.072068[/C][/ROW]
[ROW][C]10[/C][C]-0.083625[/C][C]-0.9122[/C][C]0.181743[/C][/ROW]
[ROW][C]11[/C][C]0.09473[/C][C]1.0334[/C][C]0.151759[/C][/ROW]
[ROW][C]12[/C][C]-0.057886[/C][C]-0.6315[/C][C]0.264474[/C][/ROW]
[ROW][C]13[/C][C]-0.115639[/C][C]-1.2615[/C][C]0.104804[/C][/ROW]
[ROW][C]14[/C][C]-0.188123[/C][C]-2.0522[/C][C]0.021173[/C][/ROW]
[ROW][C]15[/C][C]0.094843[/C][C]1.0346[/C][C]0.151474[/C][/ROW]
[ROW][C]16[/C][C]-0.107834[/C][C]-1.1763[/C][C]0.120905[/C][/ROW]
[ROW][C]17[/C][C]-0.039169[/C][C]-0.4273[/C][C]0.334972[/C][/ROW]
[ROW][C]18[/C][C]-0.058212[/C][C]-0.635[/C][C]0.263318[/C][/ROW]
[ROW][C]19[/C][C]-0.097798[/C][C]-1.0668[/C][C]0.1441[/C][/ROW]
[ROW][C]20[/C][C]0.041579[/C][C]0.4536[/C][C]0.32548[/C][/ROW]
[ROW][C]21[/C][C]-0.14943[/C][C]-1.6301[/C][C]0.052864[/C][/ROW]
[ROW][C]22[/C][C]-0.012137[/C][C]-0.1324[/C][C]0.447446[/C][/ROW]
[ROW][C]23[/C][C]0.134872[/C][C]1.4713[/C][C]0.071927[/C][/ROW]
[ROW][C]24[/C][C]-0.093541[/C][C]-1.0204[/C][C]0.154801[/C][/ROW]
[ROW][C]25[/C][C]-0.048128[/C][C]-0.525[/C][C]0.300274[/C][/ROW]
[ROW][C]26[/C][C]-0.044672[/C][C]-0.4873[/C][C]0.313466[/C][/ROW]
[ROW][C]27[/C][C]-0.104904[/C][C]-1.1444[/C][C]0.127384[/C][/ROW]
[ROW][C]28[/C][C]-0.171965[/C][C]-1.8759[/C][C]0.031559[/C][/ROW]
[ROW][C]29[/C][C]0.118096[/C][C]1.2883[/C][C]0.100074[/C][/ROW]
[ROW][C]30[/C][C]-0.14376[/C][C]-1.5682[/C][C]0.059741[/C][/ROW]
[ROW][C]31[/C][C]-0.051124[/C][C]-0.5577[/C][C]0.289049[/C][/ROW]
[ROW][C]32[/C][C]-0.102824[/C][C]-1.1217[/C][C]0.132129[/C][/ROW]
[ROW][C]33[/C][C]-0.02886[/C][C]-0.3148[/C][C]0.376722[/C][/ROW]
[ROW][C]34[/C][C]-0.121849[/C][C]-1.3292[/C][C]0.09316[/C][/ROW]
[ROW][C]35[/C][C]-0.011366[/C][C]-0.124[/C][C]0.450768[/C][/ROW]
[ROW][C]36[/C][C]-0.112308[/C][C]-1.2251[/C][C]0.111472[/C][/ROW]
[ROW][C]37[/C][C]0.059436[/C][C]0.6484[/C][C]0.258999[/C][/ROW]
[ROW][C]38[/C][C]-0.041118[/C][C]-0.4485[/C][C]0.327288[/C][/ROW]
[ROW][C]39[/C][C]-0.154874[/C][C]-1.6895[/C][C]0.046873[/C][/ROW]
[ROW][C]40[/C][C]-0.076547[/C][C]-0.835[/C][C]0.202687[/C][/ROW]
[ROW][C]41[/C][C]-0.098156[/C][C]-1.0708[/C][C]0.143223[/C][/ROW]
[ROW][C]42[/C][C]0.035684[/C][C]0.3893[/C][C]0.348887[/C][/ROW]
[ROW][C]43[/C][C]-0.071446[/C][C]-0.7794[/C][C]0.218651[/C][/ROW]
[ROW][C]44[/C][C]0.046865[/C][C]0.5112[/C][C]0.305067[/C][/ROW]
[ROW][C]45[/C][C]-0.020029[/C][C]-0.2185[/C][C]0.413711[/C][/ROW]
[ROW][C]46[/C][C]-0.029935[/C][C]-0.3266[/C][C]0.37229[/C][/ROW]
[ROW][C]47[/C][C]-0.133457[/C][C]-1.4558[/C][C]0.074034[/C][/ROW]
[ROW][C]48[/C][C]-0.110884[/C][C]-1.2096[/C][C]0.114414[/C][/ROW]
[/TABLE]
Source: https://freestatistics.org/blog/index.php?pk=234259&T=2

Globally Unique Identifier (entire table): ba.freestatistics.org/blog/index.php?pk=234259&T=2

As an alternative you can also use a QR Code:  

The GUIDs for individual cells are displayed in the table below:

Partial Autocorrelation Function
Time lag kPACF(k)T-STATP-value
1-0.357435-3.89928e-05
2-0.347264-3.78820.00012
3-0.088796-0.96860.167343
40.0051940.05670.477454
50.0438820.47870.316515
6-0.124929-1.36280.087758
70.0834020.90980.182381
8-0.134235-1.46430.07287
9-0.134777-1.47020.072068
10-0.083625-0.91220.181743
110.094731.03340.151759
12-0.057886-0.63150.264474
13-0.115639-1.26150.104804
14-0.188123-2.05220.021173
150.0948431.03460.151474
16-0.107834-1.17630.120905
17-0.039169-0.42730.334972
18-0.058212-0.6350.263318
19-0.097798-1.06680.1441
200.0415790.45360.32548
21-0.14943-1.63010.052864
22-0.012137-0.13240.447446
230.1348721.47130.071927
24-0.093541-1.02040.154801
25-0.048128-0.5250.300274
26-0.044672-0.48730.313466
27-0.104904-1.14440.127384
28-0.171965-1.87590.031559
290.1180961.28830.100074
30-0.14376-1.56820.059741
31-0.051124-0.55770.289049
32-0.102824-1.12170.132129
33-0.02886-0.31480.376722
34-0.121849-1.32920.09316
35-0.011366-0.1240.450768
36-0.112308-1.22510.111472
370.0594360.64840.258999
38-0.041118-0.44850.327288
39-0.154874-1.68950.046873
40-0.076547-0.8350.202687
41-0.098156-1.07080.143223
420.0356840.38930.348887
43-0.071446-0.77940.218651
440.0468650.51120.305067
45-0.020029-0.21850.413711
46-0.029935-0.32660.37229
47-0.133457-1.45580.074034
48-0.110884-1.20960.114414


Parameters (Session):
par1 = 48 ; par2 = 1 ; par3 = 1 ; par4 = 1 ; par5 = 12 ; par6 = White Noise ; par7 = 0.95 ;
Parameters (R input):
par1 = 48 ; par2 = 1 ; par3 = 1 ; par4 = 1 ; par5 = 12 ; par6 = White Noise ; par7 = 0.95 ; par8 = ;
R code (references can be found in the software module):
par8 <- ''
par7 <- '0.95'
par6 <- 'White Noise'
par5 <- '12'
par4 <- '1'
par3 <- '1'
par2 <- '1'
par1 <- 'Default'
if (par1 == 'Default') {
par1 = 10*log10(length(x))
} else {
par1 <- as.numeric(par1)
}
par2 <- as.numeric(par2)
par3 <- as.numeric(par3)
par4 <- as.numeric(par4)
par5 <- as.numeric(par5)
if (par6 == 'White Noise') par6 <- 'white' else par6 <- 'ma'
par7 <- as.numeric(par7)
if (par8 != '') par8 <- as.numeric(par8)
ox <- x
if (par8 == '') {
if (par2 == 0) {
x <- log(x)
} else {
x <- (x ^ par2 - 1) / par2
}
} else {
x <- log(x,base=par8)
}
if (par3 > 0) x <- diff(x,lag=1,difference=par3)
if (par4 > 0) x <- diff(x,lag=par5,difference=par4)
bitmap(file='picts.png')
op <- par(mfrow=c(2,1))
plot(ox,type='l',main='Original Time Series',xlab='time',ylab='value')
if (par8=='') {
mytitle <- paste('Working Time Series (lambda=',par2,', d=',par3,', D=',par4,')',sep='')
mysub <- paste('(lambda=',par2,', d=',par3,', D=',par4,', CI=', par7, ', CI type=',par6,')',sep='')
} else {
mytitle <- paste('Working Time Series (base=',par8,', d=',par3,', D=',par4,')',sep='')
mysub <- paste('(base=',par8,', d=',par3,', D=',par4,', CI=', par7, ', CI type=',par6,')',sep='')
}
plot(x,type='l', main=mytitle,xlab='time',ylab='value')
par(op)
dev.off()
bitmap(file='pic1.png')
racf <- acf(x, par1, main='Autocorrelation', xlab='time lag', ylab='ACF', ci.type=par6, ci=par7, sub=mysub)
dev.off()
bitmap(file='pic2.png')
rpacf <- pacf(x,par1,main='Partial Autocorrelation',xlab='lags',ylab='PACF',sub=mysub)
dev.off()
(myacf <- c(racf$acf))
(mypacf <- c(rpacf$acf))
lengthx <- length(x)
sqrtn <- sqrt(lengthx)
load(file='createtable')
a<-table.start()
a<-table.row.start(a)
a<-table.element(a,'Autocorrelation Function',4,TRUE)
a<-table.row.end(a)
a<-table.row.start(a)
a<-table.element(a,'Time lag k',header=TRUE)
a<-table.element(a,hyperlink('basics.htm','ACF(k)','click here for more information about the Autocorrelation Function'),header=TRUE)
a<-table.element(a,'T-STAT',header=TRUE)
a<-table.element(a,'P-value',header=TRUE)
a<-table.row.end(a)
for (i in 2:(par1+1)) {
a<-table.row.start(a)
a<-table.element(a,i-1,header=TRUE)
a<-table.element(a,round(myacf[i],6))
mytstat <- myacf[i]*sqrtn
a<-table.element(a,round(mytstat,4))
a<-table.element(a,round(1-pt(abs(mytstat),lengthx),6))
a<-table.row.end(a)
}
a<-table.end(a)
table.save(a,file='mytable.tab')
a<-table.start()
a<-table.row.start(a)
a<-table.element(a,'Partial Autocorrelation Function',4,TRUE)
a<-table.row.end(a)
a<-table.row.start(a)
a<-table.element(a,'Time lag k',header=TRUE)
a<-table.element(a,hyperlink('basics.htm','PACF(k)','click here for more information about the Partial Autocorrelation Function'),header=TRUE)
a<-table.element(a,'T-STAT',header=TRUE)
a<-table.element(a,'P-value',header=TRUE)
a<-table.row.end(a)
for (i in 1:par1) {
a<-table.row.start(a)
a<-table.element(a,i,header=TRUE)
a<-table.element(a,round(mypacf[i],6))
mytstat <- mypacf[i]*sqrtn
a<-table.element(a,round(mytstat,4))
a<-table.element(a,round(1-pt(abs(mytstat),lengthx),6))
a<-table.row.end(a)
}
a<-table.end(a)
table.save(a,file='mytable1.tab')