Free Statistics

of Irreproducible Research!

Author's title

Author*Unverified author*
R Software Modulerwasp_autocorrelation.wasp
Title produced by software(Partial) Autocorrelation Function
Date of computationThu, 13 Mar 2014 09:23:28 -0400
Cite this page as followsStatistical Computations at FreeStatistics.org, Office for Research Development and Education, URL https://freestatistics.org/blog/index.php?v=date/2014/Mar/13/t1394717045jzojoeu5t3wsiiq.htm/, Retrieved Tue, 14 May 2024 19:24:14 +0000
Statistical Computations at FreeStatistics.org, Office for Research Development and Education, URL https://freestatistics.org/blog/index.php?pk=234234, Retrieved Tue, 14 May 2024 19:24:14 +0000
QR Codes:

Original text written by user:
IsPrivate?No (this computation is public)
User-defined keywords
Estimated Impact131
Family? (F = Feedback message, R = changed R code, M = changed R Module, P = changed Parameters, D = changed Data)
-       [(Partial) Autocorrelation Function] [] [2014-03-13 13:23:28] [3faf596b3f292f8d9ff7bbf57fa10dd3] [Current]
Feedback Forum

Post a new message
Dataseries X:
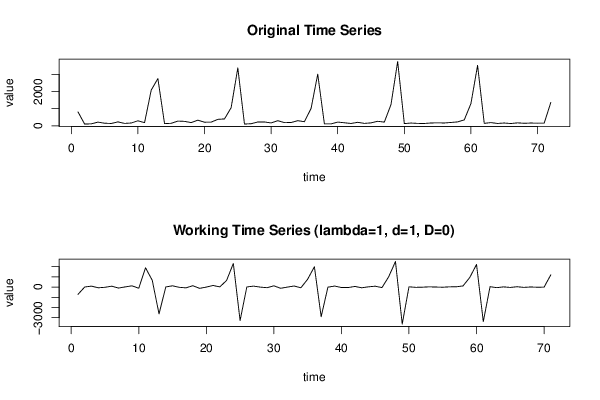
812
100
113
213
149
134
228
138
162
291
182
2081
2752
125
144
274
257
186
327
209
213
375
400
1054
3377
101
120
221
222
167
297
185
189
298
237
1011
3013
110
109
215
176
134
202
139
169
262
214
1238
3748
127
160
138
134
163
172
163
193
226
344
1294
3524
141
186
135
161
131
170
146
160
151
151
1365


Summary of computational transaction
Raw Inputview raw input (R code)
Raw Outputview raw output of R engine
Computing time3 seconds
R Server'Gwilym Jenkins' @ jenkins.wessa.net

\begin{tabular}{lllllllll}
\hline
Summary of computational transaction \tabularnewline
Raw Input & view raw input (R code)  \tabularnewline
Raw Output & view raw output of R engine  \tabularnewline
Computing time & 3 seconds \tabularnewline
R Server & 'Gwilym Jenkins' @ jenkins.wessa.net \tabularnewline
\hline
\end{tabular}
%Source: https://freestatistics.org/blog/index.php?pk=234234&T=0

[TABLE]
[ROW][C]Summary of computational transaction[/C][/ROW]
[ROW][C]Raw Input[/C][C]view raw input (R code) [/C][/ROW]
[ROW][C]Raw Output[/C][C]view raw output of R engine [/C][/ROW]
[ROW][C]Computing time[/C][C]3 seconds[/C][/ROW]
[ROW][C]R Server[/C][C]'Gwilym Jenkins' @ jenkins.wessa.net[/C][/ROW]
[/TABLE]
Source: https://freestatistics.org/blog/index.php?pk=234234&T=0

Globally Unique Identifier (entire table): ba.freestatistics.org/blog/index.php?pk=234234&T=0

As an alternative you can also use a QR Code:  

The GUIDs for individual cells are displayed in the table below:

Summary of computational transaction
Raw Inputview raw input (R code)
Raw Outputview raw output of R engine
Computing time3 seconds
R Server'Gwilym Jenkins' @ jenkins.wessa.net


Autocorrelation Function
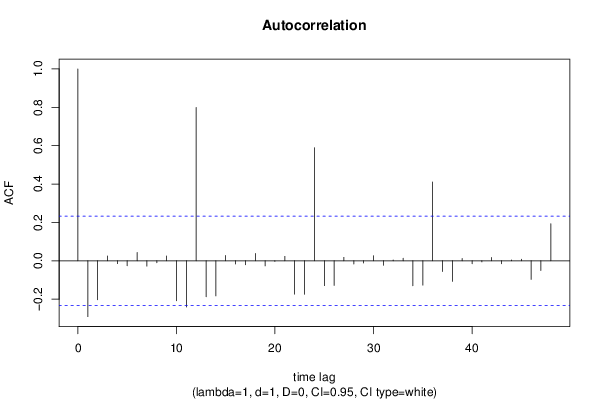
Time lag kACF(k)T-STATP-value
1-0.290954-2.45160.008342
2-0.203043-1.71090.045735
30.0249470.21020.417056
4-0.014736-0.12420.450766
5-0.025811-0.21750.414228
60.0431060.36320.358761
7-0.027648-0.2330.40823
8-0.010102-0.08510.466203
90.0249940.21060.416901
10-0.207905-1.75180.04206
11-0.240481-2.02630.023244
120.7995636.73720
13-0.18771-1.58170.059085
14-0.182594-1.53860.064178
150.0279620.23560.407206
16-0.016589-0.13980.444614
17-0.020897-0.17610.430366
180.0383510.32320.373765
19-0.026471-0.22310.412068
20-0.003126-0.02630.48953
210.0231660.19520.422896
22-0.173563-1.46250.074013
23-0.174209-1.46790.073272
240.589684.96872e-06
25-0.129371-1.09010.139678
26-0.127921-1.07790.142368
270.0182370.15370.439154
28-0.016896-0.14240.443596
29-0.011135-0.09380.462755
300.0267490.22540.411162
31-0.022773-0.19190.42419
320.0039260.03310.486852
330.0130450.10990.456392
34-0.129586-1.09190.139282
35-0.126804-1.06850.144464
360.4108233.46170.000456
37-0.05546-0.46730.320855
38-0.10704-0.90190.185071
390.0118280.09970.460446
40-0.015617-0.13160.447841
41-0.005467-0.04610.481693
420.0174850.14730.441645
43-0.01563-0.13170.447795
440.0044160.03720.485211
450.0082820.06980.47228
46-0.096773-0.81540.208779
47-0.050761-0.42770.335074
480.1932781.62860.053914

\begin{tabular}{lllllllll}
\hline
Autocorrelation Function \tabularnewline
Time lag k & ACF(k) & T-STAT & P-value \tabularnewline
1 & -0.290954 & -2.4516 & 0.008342 \tabularnewline
2 & -0.203043 & -1.7109 & 0.045735 \tabularnewline
3 & 0.024947 & 0.2102 & 0.417056 \tabularnewline
4 & -0.014736 & -0.1242 & 0.450766 \tabularnewline
5 & -0.025811 & -0.2175 & 0.414228 \tabularnewline
6 & 0.043106 & 0.3632 & 0.358761 \tabularnewline
7 & -0.027648 & -0.233 & 0.40823 \tabularnewline
8 & -0.010102 & -0.0851 & 0.466203 \tabularnewline
9 & 0.024994 & 0.2106 & 0.416901 \tabularnewline
10 & -0.207905 & -1.7518 & 0.04206 \tabularnewline
11 & -0.240481 & -2.0263 & 0.023244 \tabularnewline
12 & 0.799563 & 6.7372 & 0 \tabularnewline
13 & -0.18771 & -1.5817 & 0.059085 \tabularnewline
14 & -0.182594 & -1.5386 & 0.064178 \tabularnewline
15 & 0.027962 & 0.2356 & 0.407206 \tabularnewline
16 & -0.016589 & -0.1398 & 0.444614 \tabularnewline
17 & -0.020897 & -0.1761 & 0.430366 \tabularnewline
18 & 0.038351 & 0.3232 & 0.373765 \tabularnewline
19 & -0.026471 & -0.2231 & 0.412068 \tabularnewline
20 & -0.003126 & -0.0263 & 0.48953 \tabularnewline
21 & 0.023166 & 0.1952 & 0.422896 \tabularnewline
22 & -0.173563 & -1.4625 & 0.074013 \tabularnewline
23 & -0.174209 & -1.4679 & 0.073272 \tabularnewline
24 & 0.58968 & 4.9687 & 2e-06 \tabularnewline
25 & -0.129371 & -1.0901 & 0.139678 \tabularnewline
26 & -0.127921 & -1.0779 & 0.142368 \tabularnewline
27 & 0.018237 & 0.1537 & 0.439154 \tabularnewline
28 & -0.016896 & -0.1424 & 0.443596 \tabularnewline
29 & -0.011135 & -0.0938 & 0.462755 \tabularnewline
30 & 0.026749 & 0.2254 & 0.411162 \tabularnewline
31 & -0.022773 & -0.1919 & 0.42419 \tabularnewline
32 & 0.003926 & 0.0331 & 0.486852 \tabularnewline
33 & 0.013045 & 0.1099 & 0.456392 \tabularnewline
34 & -0.129586 & -1.0919 & 0.139282 \tabularnewline
35 & -0.126804 & -1.0685 & 0.144464 \tabularnewline
36 & 0.410823 & 3.4617 & 0.000456 \tabularnewline
37 & -0.05546 & -0.4673 & 0.320855 \tabularnewline
38 & -0.10704 & -0.9019 & 0.185071 \tabularnewline
39 & 0.011828 & 0.0997 & 0.460446 \tabularnewline
40 & -0.015617 & -0.1316 & 0.447841 \tabularnewline
41 & -0.005467 & -0.0461 & 0.481693 \tabularnewline
42 & 0.017485 & 0.1473 & 0.441645 \tabularnewline
43 & -0.01563 & -0.1317 & 0.447795 \tabularnewline
44 & 0.004416 & 0.0372 & 0.485211 \tabularnewline
45 & 0.008282 & 0.0698 & 0.47228 \tabularnewline
46 & -0.096773 & -0.8154 & 0.208779 \tabularnewline
47 & -0.050761 & -0.4277 & 0.335074 \tabularnewline
48 & 0.193278 & 1.6286 & 0.053914 \tabularnewline
\hline
\end{tabular}
%Source: https://freestatistics.org/blog/index.php?pk=234234&T=1

[TABLE]
[ROW][C]Autocorrelation Function[/C][/ROW]
[ROW][C]Time lag k[/C][C]ACF(k)[/C][C]T-STAT[/C][C]P-value[/C][/ROW]
[ROW][C]1[/C][C]-0.290954[/C][C]-2.4516[/C][C]0.008342[/C][/ROW]
[ROW][C]2[/C][C]-0.203043[/C][C]-1.7109[/C][C]0.045735[/C][/ROW]
[ROW][C]3[/C][C]0.024947[/C][C]0.2102[/C][C]0.417056[/C][/ROW]
[ROW][C]4[/C][C]-0.014736[/C][C]-0.1242[/C][C]0.450766[/C][/ROW]
[ROW][C]5[/C][C]-0.025811[/C][C]-0.2175[/C][C]0.414228[/C][/ROW]
[ROW][C]6[/C][C]0.043106[/C][C]0.3632[/C][C]0.358761[/C][/ROW]
[ROW][C]7[/C][C]-0.027648[/C][C]-0.233[/C][C]0.40823[/C][/ROW]
[ROW][C]8[/C][C]-0.010102[/C][C]-0.0851[/C][C]0.466203[/C][/ROW]
[ROW][C]9[/C][C]0.024994[/C][C]0.2106[/C][C]0.416901[/C][/ROW]
[ROW][C]10[/C][C]-0.207905[/C][C]-1.7518[/C][C]0.04206[/C][/ROW]
[ROW][C]11[/C][C]-0.240481[/C][C]-2.0263[/C][C]0.023244[/C][/ROW]
[ROW][C]12[/C][C]0.799563[/C][C]6.7372[/C][C]0[/C][/ROW]
[ROW][C]13[/C][C]-0.18771[/C][C]-1.5817[/C][C]0.059085[/C][/ROW]
[ROW][C]14[/C][C]-0.182594[/C][C]-1.5386[/C][C]0.064178[/C][/ROW]
[ROW][C]15[/C][C]0.027962[/C][C]0.2356[/C][C]0.407206[/C][/ROW]
[ROW][C]16[/C][C]-0.016589[/C][C]-0.1398[/C][C]0.444614[/C][/ROW]
[ROW][C]17[/C][C]-0.020897[/C][C]-0.1761[/C][C]0.430366[/C][/ROW]
[ROW][C]18[/C][C]0.038351[/C][C]0.3232[/C][C]0.373765[/C][/ROW]
[ROW][C]19[/C][C]-0.026471[/C][C]-0.2231[/C][C]0.412068[/C][/ROW]
[ROW][C]20[/C][C]-0.003126[/C][C]-0.0263[/C][C]0.48953[/C][/ROW]
[ROW][C]21[/C][C]0.023166[/C][C]0.1952[/C][C]0.422896[/C][/ROW]
[ROW][C]22[/C][C]-0.173563[/C][C]-1.4625[/C][C]0.074013[/C][/ROW]
[ROW][C]23[/C][C]-0.174209[/C][C]-1.4679[/C][C]0.073272[/C][/ROW]
[ROW][C]24[/C][C]0.58968[/C][C]4.9687[/C][C]2e-06[/C][/ROW]
[ROW][C]25[/C][C]-0.129371[/C][C]-1.0901[/C][C]0.139678[/C][/ROW]
[ROW][C]26[/C][C]-0.127921[/C][C]-1.0779[/C][C]0.142368[/C][/ROW]
[ROW][C]27[/C][C]0.018237[/C][C]0.1537[/C][C]0.439154[/C][/ROW]
[ROW][C]28[/C][C]-0.016896[/C][C]-0.1424[/C][C]0.443596[/C][/ROW]
[ROW][C]29[/C][C]-0.011135[/C][C]-0.0938[/C][C]0.462755[/C][/ROW]
[ROW][C]30[/C][C]0.026749[/C][C]0.2254[/C][C]0.411162[/C][/ROW]
[ROW][C]31[/C][C]-0.022773[/C][C]-0.1919[/C][C]0.42419[/C][/ROW]
[ROW][C]32[/C][C]0.003926[/C][C]0.0331[/C][C]0.486852[/C][/ROW]
[ROW][C]33[/C][C]0.013045[/C][C]0.1099[/C][C]0.456392[/C][/ROW]
[ROW][C]34[/C][C]-0.129586[/C][C]-1.0919[/C][C]0.139282[/C][/ROW]
[ROW][C]35[/C][C]-0.126804[/C][C]-1.0685[/C][C]0.144464[/C][/ROW]
[ROW][C]36[/C][C]0.410823[/C][C]3.4617[/C][C]0.000456[/C][/ROW]
[ROW][C]37[/C][C]-0.05546[/C][C]-0.4673[/C][C]0.320855[/C][/ROW]
[ROW][C]38[/C][C]-0.10704[/C][C]-0.9019[/C][C]0.185071[/C][/ROW]
[ROW][C]39[/C][C]0.011828[/C][C]0.0997[/C][C]0.460446[/C][/ROW]
[ROW][C]40[/C][C]-0.015617[/C][C]-0.1316[/C][C]0.447841[/C][/ROW]
[ROW][C]41[/C][C]-0.005467[/C][C]-0.0461[/C][C]0.481693[/C][/ROW]
[ROW][C]42[/C][C]0.017485[/C][C]0.1473[/C][C]0.441645[/C][/ROW]
[ROW][C]43[/C][C]-0.01563[/C][C]-0.1317[/C][C]0.447795[/C][/ROW]
[ROW][C]44[/C][C]0.004416[/C][C]0.0372[/C][C]0.485211[/C][/ROW]
[ROW][C]45[/C][C]0.008282[/C][C]0.0698[/C][C]0.47228[/C][/ROW]
[ROW][C]46[/C][C]-0.096773[/C][C]-0.8154[/C][C]0.208779[/C][/ROW]
[ROW][C]47[/C][C]-0.050761[/C][C]-0.4277[/C][C]0.335074[/C][/ROW]
[ROW][C]48[/C][C]0.193278[/C][C]1.6286[/C][C]0.053914[/C][/ROW]
[/TABLE]
Source: https://freestatistics.org/blog/index.php?pk=234234&T=1

Globally Unique Identifier (entire table): ba.freestatistics.org/blog/index.php?pk=234234&T=1

As an alternative you can also use a QR Code:  

The GUIDs for individual cells are displayed in the table below:

Autocorrelation Function
Time lag kACF(k)T-STATP-value
1-0.290954-2.45160.008342
2-0.203043-1.71090.045735
30.0249470.21020.417056
4-0.014736-0.12420.450766
5-0.025811-0.21750.414228
60.0431060.36320.358761
7-0.027648-0.2330.40823
8-0.010102-0.08510.466203
90.0249940.21060.416901
10-0.207905-1.75180.04206
11-0.240481-2.02630.023244
120.7995636.73720
13-0.18771-1.58170.059085
14-0.182594-1.53860.064178
150.0279620.23560.407206
16-0.016589-0.13980.444614
17-0.020897-0.17610.430366
180.0383510.32320.373765
19-0.026471-0.22310.412068
20-0.003126-0.02630.48953
210.0231660.19520.422896
22-0.173563-1.46250.074013
23-0.174209-1.46790.073272
240.589684.96872e-06
25-0.129371-1.09010.139678
26-0.127921-1.07790.142368
270.0182370.15370.439154
28-0.016896-0.14240.443596
29-0.011135-0.09380.462755
300.0267490.22540.411162
31-0.022773-0.19190.42419
320.0039260.03310.486852
330.0130450.10990.456392
34-0.129586-1.09190.139282
35-0.126804-1.06850.144464
360.4108233.46170.000456
37-0.05546-0.46730.320855
38-0.10704-0.90190.185071
390.0118280.09970.460446
40-0.015617-0.13160.447841
41-0.005467-0.04610.481693
420.0174850.14730.441645
43-0.01563-0.13170.447795
440.0044160.03720.485211
450.0082820.06980.47228
46-0.096773-0.81540.208779
47-0.050761-0.42770.335074
480.1932781.62860.053914


Partial Autocorrelation Function
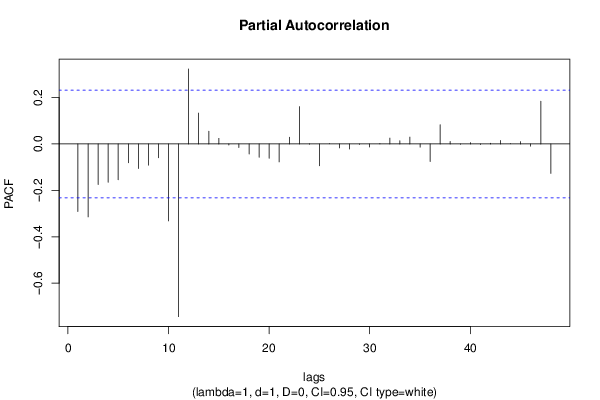
Time lag kPACF(k)T-STATP-value
1-0.290954-2.45160.008342
2-0.314304-2.64840.00498
3-0.174739-1.47240.07267
4-0.16512-1.39130.084235
5-0.153981-1.29750.099335
6-0.08127-0.68480.247852
7-0.106057-0.89370.187263
8-0.091139-0.7680.222531
9-0.05954-0.50170.308719
10-0.331398-2.79240.003359
11-0.744362-6.27210
120.3234892.72580.004037
130.1331951.12230.132754
140.0549490.4630.322387
150.0243520.20520.419005
16-0.004357-0.03670.48541
17-0.014855-0.12520.450372
18-0.042848-0.3610.359568
19-0.057274-0.48260.315433
20-0.061491-0.51810.302987
21-0.077147-0.65010.258877
220.029420.24790.402465
230.1611991.35830.089336
24-0.000976-0.00820.496732
25-0.093984-0.79190.215521
260.0005140.00430.498278
27-0.016707-0.14080.444224
28-0.021703-0.18290.427708
29-0.001743-0.01470.494161
30-0.012915-0.10880.456825
310.0006110.00520.497952
320.0253140.21330.415852
330.0139460.11750.453395
340.0296970.25020.401565
35-0.013514-0.11390.45483
36-0.075495-0.63610.263367
370.0830340.69970.243215
380.0107560.09060.464019
39-0.001351-0.01140.495475
400.0060750.05120.479661
41-0.00223-0.01880.492529
420.0033510.02820.488776
430.0153150.1290.448844
440.0004240.00360.498578
450.0101350.08540.466091
46-0.009427-0.07940.468455
470.1841561.55170.062587
48-0.126848-1.06880.144381

\begin{tabular}{lllllllll}
\hline
Partial Autocorrelation Function \tabularnewline
Time lag k & PACF(k) & T-STAT & P-value \tabularnewline
1 & -0.290954 & -2.4516 & 0.008342 \tabularnewline
2 & -0.314304 & -2.6484 & 0.00498 \tabularnewline
3 & -0.174739 & -1.4724 & 0.07267 \tabularnewline
4 & -0.16512 & -1.3913 & 0.084235 \tabularnewline
5 & -0.153981 & -1.2975 & 0.099335 \tabularnewline
6 & -0.08127 & -0.6848 & 0.247852 \tabularnewline
7 & -0.106057 & -0.8937 & 0.187263 \tabularnewline
8 & -0.091139 & -0.768 & 0.222531 \tabularnewline
9 & -0.05954 & -0.5017 & 0.308719 \tabularnewline
10 & -0.331398 & -2.7924 & 0.003359 \tabularnewline
11 & -0.744362 & -6.2721 & 0 \tabularnewline
12 & 0.323489 & 2.7258 & 0.004037 \tabularnewline
13 & 0.133195 & 1.1223 & 0.132754 \tabularnewline
14 & 0.054949 & 0.463 & 0.322387 \tabularnewline
15 & 0.024352 & 0.2052 & 0.419005 \tabularnewline
16 & -0.004357 & -0.0367 & 0.48541 \tabularnewline
17 & -0.014855 & -0.1252 & 0.450372 \tabularnewline
18 & -0.042848 & -0.361 & 0.359568 \tabularnewline
19 & -0.057274 & -0.4826 & 0.315433 \tabularnewline
20 & -0.061491 & -0.5181 & 0.302987 \tabularnewline
21 & -0.077147 & -0.6501 & 0.258877 \tabularnewline
22 & 0.02942 & 0.2479 & 0.402465 \tabularnewline
23 & 0.161199 & 1.3583 & 0.089336 \tabularnewline
24 & -0.000976 & -0.0082 & 0.496732 \tabularnewline
25 & -0.093984 & -0.7919 & 0.215521 \tabularnewline
26 & 0.000514 & 0.0043 & 0.498278 \tabularnewline
27 & -0.016707 & -0.1408 & 0.444224 \tabularnewline
28 & -0.021703 & -0.1829 & 0.427708 \tabularnewline
29 & -0.001743 & -0.0147 & 0.494161 \tabularnewline
30 & -0.012915 & -0.1088 & 0.456825 \tabularnewline
31 & 0.000611 & 0.0052 & 0.497952 \tabularnewline
32 & 0.025314 & 0.2133 & 0.415852 \tabularnewline
33 & 0.013946 & 0.1175 & 0.453395 \tabularnewline
34 & 0.029697 & 0.2502 & 0.401565 \tabularnewline
35 & -0.013514 & -0.1139 & 0.45483 \tabularnewline
36 & -0.075495 & -0.6361 & 0.263367 \tabularnewline
37 & 0.083034 & 0.6997 & 0.243215 \tabularnewline
38 & 0.010756 & 0.0906 & 0.464019 \tabularnewline
39 & -0.001351 & -0.0114 & 0.495475 \tabularnewline
40 & 0.006075 & 0.0512 & 0.479661 \tabularnewline
41 & -0.00223 & -0.0188 & 0.492529 \tabularnewline
42 & 0.003351 & 0.0282 & 0.488776 \tabularnewline
43 & 0.015315 & 0.129 & 0.448844 \tabularnewline
44 & 0.000424 & 0.0036 & 0.498578 \tabularnewline
45 & 0.010135 & 0.0854 & 0.466091 \tabularnewline
46 & -0.009427 & -0.0794 & 0.468455 \tabularnewline
47 & 0.184156 & 1.5517 & 0.062587 \tabularnewline
48 & -0.126848 & -1.0688 & 0.144381 \tabularnewline
\hline
\end{tabular}
%Source: https://freestatistics.org/blog/index.php?pk=234234&T=2

[TABLE]
[ROW][C]Partial Autocorrelation Function[/C][/ROW]
[ROW][C]Time lag k[/C][C]PACF(k)[/C][C]T-STAT[/C][C]P-value[/C][/ROW]
[ROW][C]1[/C][C]-0.290954[/C][C]-2.4516[/C][C]0.008342[/C][/ROW]
[ROW][C]2[/C][C]-0.314304[/C][C]-2.6484[/C][C]0.00498[/C][/ROW]
[ROW][C]3[/C][C]-0.174739[/C][C]-1.4724[/C][C]0.07267[/C][/ROW]
[ROW][C]4[/C][C]-0.16512[/C][C]-1.3913[/C][C]0.084235[/C][/ROW]
[ROW][C]5[/C][C]-0.153981[/C][C]-1.2975[/C][C]0.099335[/C][/ROW]
[ROW][C]6[/C][C]-0.08127[/C][C]-0.6848[/C][C]0.247852[/C][/ROW]
[ROW][C]7[/C][C]-0.106057[/C][C]-0.8937[/C][C]0.187263[/C][/ROW]
[ROW][C]8[/C][C]-0.091139[/C][C]-0.768[/C][C]0.222531[/C][/ROW]
[ROW][C]9[/C][C]-0.05954[/C][C]-0.5017[/C][C]0.308719[/C][/ROW]
[ROW][C]10[/C][C]-0.331398[/C][C]-2.7924[/C][C]0.003359[/C][/ROW]
[ROW][C]11[/C][C]-0.744362[/C][C]-6.2721[/C][C]0[/C][/ROW]
[ROW][C]12[/C][C]0.323489[/C][C]2.7258[/C][C]0.004037[/C][/ROW]
[ROW][C]13[/C][C]0.133195[/C][C]1.1223[/C][C]0.132754[/C][/ROW]
[ROW][C]14[/C][C]0.054949[/C][C]0.463[/C][C]0.322387[/C][/ROW]
[ROW][C]15[/C][C]0.024352[/C][C]0.2052[/C][C]0.419005[/C][/ROW]
[ROW][C]16[/C][C]-0.004357[/C][C]-0.0367[/C][C]0.48541[/C][/ROW]
[ROW][C]17[/C][C]-0.014855[/C][C]-0.1252[/C][C]0.450372[/C][/ROW]
[ROW][C]18[/C][C]-0.042848[/C][C]-0.361[/C][C]0.359568[/C][/ROW]
[ROW][C]19[/C][C]-0.057274[/C][C]-0.4826[/C][C]0.315433[/C][/ROW]
[ROW][C]20[/C][C]-0.061491[/C][C]-0.5181[/C][C]0.302987[/C][/ROW]
[ROW][C]21[/C][C]-0.077147[/C][C]-0.6501[/C][C]0.258877[/C][/ROW]
[ROW][C]22[/C][C]0.02942[/C][C]0.2479[/C][C]0.402465[/C][/ROW]
[ROW][C]23[/C][C]0.161199[/C][C]1.3583[/C][C]0.089336[/C][/ROW]
[ROW][C]24[/C][C]-0.000976[/C][C]-0.0082[/C][C]0.496732[/C][/ROW]
[ROW][C]25[/C][C]-0.093984[/C][C]-0.7919[/C][C]0.215521[/C][/ROW]
[ROW][C]26[/C][C]0.000514[/C][C]0.0043[/C][C]0.498278[/C][/ROW]
[ROW][C]27[/C][C]-0.016707[/C][C]-0.1408[/C][C]0.444224[/C][/ROW]
[ROW][C]28[/C][C]-0.021703[/C][C]-0.1829[/C][C]0.427708[/C][/ROW]
[ROW][C]29[/C][C]-0.001743[/C][C]-0.0147[/C][C]0.494161[/C][/ROW]
[ROW][C]30[/C][C]-0.012915[/C][C]-0.1088[/C][C]0.456825[/C][/ROW]
[ROW][C]31[/C][C]0.000611[/C][C]0.0052[/C][C]0.497952[/C][/ROW]
[ROW][C]32[/C][C]0.025314[/C][C]0.2133[/C][C]0.415852[/C][/ROW]
[ROW][C]33[/C][C]0.013946[/C][C]0.1175[/C][C]0.453395[/C][/ROW]
[ROW][C]34[/C][C]0.029697[/C][C]0.2502[/C][C]0.401565[/C][/ROW]
[ROW][C]35[/C][C]-0.013514[/C][C]-0.1139[/C][C]0.45483[/C][/ROW]
[ROW][C]36[/C][C]-0.075495[/C][C]-0.6361[/C][C]0.263367[/C][/ROW]
[ROW][C]37[/C][C]0.083034[/C][C]0.6997[/C][C]0.243215[/C][/ROW]
[ROW][C]38[/C][C]0.010756[/C][C]0.0906[/C][C]0.464019[/C][/ROW]
[ROW][C]39[/C][C]-0.001351[/C][C]-0.0114[/C][C]0.495475[/C][/ROW]
[ROW][C]40[/C][C]0.006075[/C][C]0.0512[/C][C]0.479661[/C][/ROW]
[ROW][C]41[/C][C]-0.00223[/C][C]-0.0188[/C][C]0.492529[/C][/ROW]
[ROW][C]42[/C][C]0.003351[/C][C]0.0282[/C][C]0.488776[/C][/ROW]
[ROW][C]43[/C][C]0.015315[/C][C]0.129[/C][C]0.448844[/C][/ROW]
[ROW][C]44[/C][C]0.000424[/C][C]0.0036[/C][C]0.498578[/C][/ROW]
[ROW][C]45[/C][C]0.010135[/C][C]0.0854[/C][C]0.466091[/C][/ROW]
[ROW][C]46[/C][C]-0.009427[/C][C]-0.0794[/C][C]0.468455[/C][/ROW]
[ROW][C]47[/C][C]0.184156[/C][C]1.5517[/C][C]0.062587[/C][/ROW]
[ROW][C]48[/C][C]-0.126848[/C][C]-1.0688[/C][C]0.144381[/C][/ROW]
[/TABLE]
Source: https://freestatistics.org/blog/index.php?pk=234234&T=2

Globally Unique Identifier (entire table): ba.freestatistics.org/blog/index.php?pk=234234&T=2

As an alternative you can also use a QR Code:  

The GUIDs for individual cells are displayed in the table below:

Partial Autocorrelation Function
Time lag kPACF(k)T-STATP-value
1-0.290954-2.45160.008342
2-0.314304-2.64840.00498
3-0.174739-1.47240.07267
4-0.16512-1.39130.084235
5-0.153981-1.29750.099335
6-0.08127-0.68480.247852
7-0.106057-0.89370.187263
8-0.091139-0.7680.222531
9-0.05954-0.50170.308719
10-0.331398-2.79240.003359
11-0.744362-6.27210
120.3234892.72580.004037
130.1331951.12230.132754
140.0549490.4630.322387
150.0243520.20520.419005
16-0.004357-0.03670.48541
17-0.014855-0.12520.450372
18-0.042848-0.3610.359568
19-0.057274-0.48260.315433
20-0.061491-0.51810.302987
21-0.077147-0.65010.258877
220.029420.24790.402465
230.1611991.35830.089336
24-0.000976-0.00820.496732
25-0.093984-0.79190.215521
260.0005140.00430.498278
27-0.016707-0.14080.444224
28-0.021703-0.18290.427708
29-0.001743-0.01470.494161
30-0.012915-0.10880.456825
310.0006110.00520.497952
320.0253140.21330.415852
330.0139460.11750.453395
340.0296970.25020.401565
35-0.013514-0.11390.45483
36-0.075495-0.63610.263367
370.0830340.69970.243215
380.0107560.09060.464019
39-0.001351-0.01140.495475
400.0060750.05120.479661
41-0.00223-0.01880.492529
420.0033510.02820.488776
430.0153150.1290.448844
440.0004240.00360.498578
450.0101350.08540.466091
46-0.009427-0.07940.468455
470.1841561.55170.062587
48-0.126848-1.06880.144381


Parameters (Session):
par1 = 48 ; par2 = 1 ; par3 = 1 ; par4 = 0 ; par5 = 12 ; par6 = White Noise ; par7 = 0.95 ;
Parameters (R input):
par1 = 48 ; par2 = 1 ; par3 = 1 ; par4 = 0 ; par5 = 12 ; par6 = White Noise ; par7 = 0.95 ; par8 = ;
R code (references can be found in the software module):
par8 <- ''
par7 <- '0.95'
par6 <- 'White Noise'
par5 <- '12'
par4 <- '0'
par3 <- '0'
par2 <- '1'
par1 <- '48'
if (par1 == 'Default') {
par1 = 10*log10(length(x))
} else {
par1 <- as.numeric(par1)
}
par2 <- as.numeric(par2)
par3 <- as.numeric(par3)
par4 <- as.numeric(par4)
par5 <- as.numeric(par5)
if (par6 == 'White Noise') par6 <- 'white' else par6 <- 'ma'
par7 <- as.numeric(par7)
if (par8 != '') par8 <- as.numeric(par8)
ox <- x
if (par8 == '') {
if (par2 == 0) {
x <- log(x)
} else {
x <- (x ^ par2 - 1) / par2
}
} else {
x <- log(x,base=par8)
}
if (par3 > 0) x <- diff(x,lag=1,difference=par3)
if (par4 > 0) x <- diff(x,lag=par5,difference=par4)
bitmap(file='picts.png')
op <- par(mfrow=c(2,1))
plot(ox,type='l',main='Original Time Series',xlab='time',ylab='value')
if (par8=='') {
mytitle <- paste('Working Time Series (lambda=',par2,', d=',par3,', D=',par4,')',sep='')
mysub <- paste('(lambda=',par2,', d=',par3,', D=',par4,', CI=', par7, ', CI type=',par6,')',sep='')
} else {
mytitle <- paste('Working Time Series (base=',par8,', d=',par3,', D=',par4,')',sep='')
mysub <- paste('(base=',par8,', d=',par3,', D=',par4,', CI=', par7, ', CI type=',par6,')',sep='')
}
plot(x,type='l', main=mytitle,xlab='time',ylab='value')
par(op)
dev.off()
bitmap(file='pic1.png')
racf <- acf(x, par1, main='Autocorrelation', xlab='time lag', ylab='ACF', ci.type=par6, ci=par7, sub=mysub)
dev.off()
bitmap(file='pic2.png')
rpacf <- pacf(x,par1,main='Partial Autocorrelation',xlab='lags',ylab='PACF',sub=mysub)
dev.off()
(myacf <- c(racf$acf))
(mypacf <- c(rpacf$acf))
lengthx <- length(x)
sqrtn <- sqrt(lengthx)
load(file='createtable')
a<-table.start()
a<-table.row.start(a)
a<-table.element(a,'Autocorrelation Function',4,TRUE)
a<-table.row.end(a)
a<-table.row.start(a)
a<-table.element(a,'Time lag k',header=TRUE)
a<-table.element(a,hyperlink('basics.htm','ACF(k)','click here for more information about the Autocorrelation Function'),header=TRUE)
a<-table.element(a,'T-STAT',header=TRUE)
a<-table.element(a,'P-value',header=TRUE)
a<-table.row.end(a)
for (i in 2:(par1+1)) {
a<-table.row.start(a)
a<-table.element(a,i-1,header=TRUE)
a<-table.element(a,round(myacf[i],6))
mytstat <- myacf[i]*sqrtn
a<-table.element(a,round(mytstat,4))
a<-table.element(a,round(1-pt(abs(mytstat),lengthx),6))
a<-table.row.end(a)
}
a<-table.end(a)
table.save(a,file='mytable.tab')
a<-table.start()
a<-table.row.start(a)
a<-table.element(a,'Partial Autocorrelation Function',4,TRUE)
a<-table.row.end(a)
a<-table.row.start(a)
a<-table.element(a,'Time lag k',header=TRUE)
a<-table.element(a,hyperlink('basics.htm','PACF(k)','click here for more information about the Partial Autocorrelation Function'),header=TRUE)
a<-table.element(a,'T-STAT',header=TRUE)
a<-table.element(a,'P-value',header=TRUE)
a<-table.row.end(a)
for (i in 1:par1) {
a<-table.row.start(a)
a<-table.element(a,i,header=TRUE)
a<-table.element(a,round(mypacf[i],6))
mytstat <- mypacf[i]*sqrtn
a<-table.element(a,round(mytstat,4))
a<-table.element(a,round(1-pt(abs(mytstat),lengthx),6))
a<-table.row.end(a)
}
a<-table.end(a)
table.save(a,file='mytable1.tab')