Free Statistics

of Irreproducible Research!

Author's title

Author*Unverified author*
R Software Modulerwasp_autocorrelation.wasp
Title produced by software(Partial) Autocorrelation Function
Date of computationThu, 13 Mar 2014 09:22:31 -0400
Cite this page as followsStatistical Computations at FreeStatistics.org, Office for Research Development and Education, URL https://freestatistics.org/blog/index.php?v=date/2014/Mar/13/t13947169909w0dp1xlrmirae9.htm/, Retrieved Tue, 14 May 2024 17:27:12 +0000
Statistical Computations at FreeStatistics.org, Office for Research Development and Education, URL https://freestatistics.org/blog/index.php?pk=234231, Retrieved Tue, 14 May 2024 17:27:12 +0000
QR Codes:

Original text written by user:
IsPrivate?No (this computation is public)
User-defined keywords
Estimated Impact135
Family? (F = Feedback message, R = changed R code, M = changed R Module, P = changed Parameters, D = changed Data)
-       [(Partial) Autocorrelation Function] [] [2014-03-13 13:22:31] [bc172ccc2f9d668294f33daae64cfa82] [Current]
Feedback Forum

Post a new message
Dataseries X:
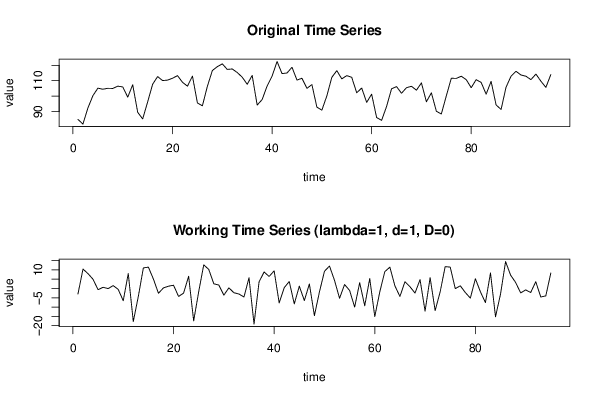
85
82
92.4
100.3
105.2
104.5
105.1
105
106.5
106
99.4
107.4
89.6
85.3
96.3
107.7
112.7
110.1
110.4
111.6
113.3
109
106.5
113
95.6
93.8
106.4
116.6
119.1
120.9
117.3
117.6
115.3
112.3
107.7
113.4
94.3
97.8
106.6
113
122.4
114.6
115
118.7
110.4
111.6
105.1
107.5
92.9
91
100.2
112.2
116.5
111.2
113.3
112.2
102.2
105.3
96
101.3
86.2
84.4
93.4
104.8
106.2
101.9
105.5
106.4
103.9
108.6
96.4
102.2
90.3
88.5
100.2
111.6
111.5
112.9
110.7
105.5
110.7
108.9
101.3
109.6
94.4
91.4
105.8
112.9
116.1
113.7
112.9
110.7
114.3
109.7
105.7
114


Summary of computational transaction
Raw Inputview raw input (R code)
Raw Outputview raw output of R engine
Computing time4 seconds
R Server'Gwilym Jenkins' @ jenkins.wessa.net

\begin{tabular}{lllllllll}
\hline
Summary of computational transaction \tabularnewline
Raw Input & view raw input (R code)  \tabularnewline
Raw Output & view raw output of R engine  \tabularnewline
Computing time & 4 seconds \tabularnewline
R Server & 'Gwilym Jenkins' @ jenkins.wessa.net \tabularnewline
\hline
\end{tabular}
%Source: https://freestatistics.org/blog/index.php?pk=234231&T=0

[TABLE]
[ROW][C]Summary of computational transaction[/C][/ROW]
[ROW][C]Raw Input[/C][C]view raw input (R code) [/C][/ROW]
[ROW][C]Raw Output[/C][C]view raw output of R engine [/C][/ROW]
[ROW][C]Computing time[/C][C]4 seconds[/C][/ROW]
[ROW][C]R Server[/C][C]'Gwilym Jenkins' @ jenkins.wessa.net[/C][/ROW]
[/TABLE]
Source: https://freestatistics.org/blog/index.php?pk=234231&T=0

Globally Unique Identifier (entire table): ba.freestatistics.org/blog/index.php?pk=234231&T=0

As an alternative you can also use a QR Code:  

The GUIDs for individual cells are displayed in the table below:

Summary of computational transaction
Raw Inputview raw input (R code)
Raw Outputview raw output of R engine
Computing time4 seconds
R Server'Gwilym Jenkins' @ jenkins.wessa.net


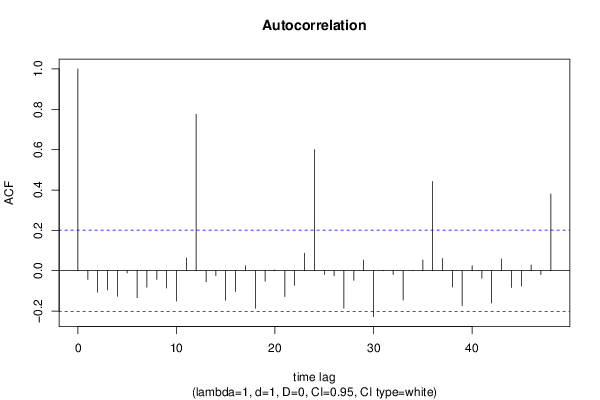
Autocorrelation Function
Time lag kACF(k)T-STATP-value
1-0.042935-0.41850.338269
2-0.106272-1.03580.151459
3-0.09513-0.92720.178082
4-0.126503-1.2330.110309
5-0.011443-0.11150.455717
6-0.133325-1.29950.09846
7-0.081263-0.7920.215152
8-0.043046-0.41960.337877
9-0.08573-0.83560.202742
10-0.150423-1.46610.072956
110.0629130.61320.270606
120.7751247.5550
13-0.054507-0.53130.298235
14-0.024538-0.23920.405744
15-0.146846-1.43130.077816
16-0.102792-1.00190.15947
170.0245290.23910.40578
18-0.185644-1.80940.036773
19-0.052154-0.50830.306197
200.0038530.03760.485062
21-0.127603-1.24370.108331
22-0.072574-0.70740.240535
230.0866330.84440.200286
240.6001675.84970
25-0.018707-0.18230.427854
26-0.024423-0.2380.406179
27-0.18577-1.81070.036677
28-0.047475-0.46270.322309
290.0534470.52090.301811
30-0.227587-2.21820.01446
310.0010960.01070.495748
32-0.018667-0.18190.428009
33-0.144713-1.41050.080831
34-0.000597-0.00580.497683
350.0535910.52230.301323
360.4421274.30932e-05
370.060850.59310.277265
38-0.080281-0.78250.217938
39-0.172532-1.68160.047962
400.025140.2450.40348
41-0.037253-0.36310.35867
42-0.160152-1.5610.060928
430.0584850.570.284999
44-0.08312-0.81020.209938
45-0.075752-0.73830.231063
460.0280350.27330.392627
47-0.019014-0.18530.426683
480.3801113.70490.000178

\begin{tabular}{lllllllll}
\hline
Autocorrelation Function \tabularnewline
Time lag k & ACF(k) & T-STAT & P-value \tabularnewline
1 & -0.042935 & -0.4185 & 0.338269 \tabularnewline
2 & -0.106272 & -1.0358 & 0.151459 \tabularnewline
3 & -0.09513 & -0.9272 & 0.178082 \tabularnewline
4 & -0.126503 & -1.233 & 0.110309 \tabularnewline
5 & -0.011443 & -0.1115 & 0.455717 \tabularnewline
6 & -0.133325 & -1.2995 & 0.09846 \tabularnewline
7 & -0.081263 & -0.792 & 0.215152 \tabularnewline
8 & -0.043046 & -0.4196 & 0.337877 \tabularnewline
9 & -0.08573 & -0.8356 & 0.202742 \tabularnewline
10 & -0.150423 & -1.4661 & 0.072956 \tabularnewline
11 & 0.062913 & 0.6132 & 0.270606 \tabularnewline
12 & 0.775124 & 7.555 & 0 \tabularnewline
13 & -0.054507 & -0.5313 & 0.298235 \tabularnewline
14 & -0.024538 & -0.2392 & 0.405744 \tabularnewline
15 & -0.146846 & -1.4313 & 0.077816 \tabularnewline
16 & -0.102792 & -1.0019 & 0.15947 \tabularnewline
17 & 0.024529 & 0.2391 & 0.40578 \tabularnewline
18 & -0.185644 & -1.8094 & 0.036773 \tabularnewline
19 & -0.052154 & -0.5083 & 0.306197 \tabularnewline
20 & 0.003853 & 0.0376 & 0.485062 \tabularnewline
21 & -0.127603 & -1.2437 & 0.108331 \tabularnewline
22 & -0.072574 & -0.7074 & 0.240535 \tabularnewline
23 & 0.086633 & 0.8444 & 0.200286 \tabularnewline
24 & 0.600167 & 5.8497 & 0 \tabularnewline
25 & -0.018707 & -0.1823 & 0.427854 \tabularnewline
26 & -0.024423 & -0.238 & 0.406179 \tabularnewline
27 & -0.18577 & -1.8107 & 0.036677 \tabularnewline
28 & -0.047475 & -0.4627 & 0.322309 \tabularnewline
29 & 0.053447 & 0.5209 & 0.301811 \tabularnewline
30 & -0.227587 & -2.2182 & 0.01446 \tabularnewline
31 & 0.001096 & 0.0107 & 0.495748 \tabularnewline
32 & -0.018667 & -0.1819 & 0.428009 \tabularnewline
33 & -0.144713 & -1.4105 & 0.080831 \tabularnewline
34 & -0.000597 & -0.0058 & 0.497683 \tabularnewline
35 & 0.053591 & 0.5223 & 0.301323 \tabularnewline
36 & 0.442127 & 4.3093 & 2e-05 \tabularnewline
37 & 0.06085 & 0.5931 & 0.277265 \tabularnewline
38 & -0.080281 & -0.7825 & 0.217938 \tabularnewline
39 & -0.172532 & -1.6816 & 0.047962 \tabularnewline
40 & 0.02514 & 0.245 & 0.40348 \tabularnewline
41 & -0.037253 & -0.3631 & 0.35867 \tabularnewline
42 & -0.160152 & -1.561 & 0.060928 \tabularnewline
43 & 0.058485 & 0.57 & 0.284999 \tabularnewline
44 & -0.08312 & -0.8102 & 0.209938 \tabularnewline
45 & -0.075752 & -0.7383 & 0.231063 \tabularnewline
46 & 0.028035 & 0.2733 & 0.392627 \tabularnewline
47 & -0.019014 & -0.1853 & 0.426683 \tabularnewline
48 & 0.380111 & 3.7049 & 0.000178 \tabularnewline
\hline
\end{tabular}
%Source: https://freestatistics.org/blog/index.php?pk=234231&T=1

[TABLE]
[ROW][C]Autocorrelation Function[/C][/ROW]
[ROW][C]Time lag k[/C][C]ACF(k)[/C][C]T-STAT[/C][C]P-value[/C][/ROW]
[ROW][C]1[/C][C]-0.042935[/C][C]-0.4185[/C][C]0.338269[/C][/ROW]
[ROW][C]2[/C][C]-0.106272[/C][C]-1.0358[/C][C]0.151459[/C][/ROW]
[ROW][C]3[/C][C]-0.09513[/C][C]-0.9272[/C][C]0.178082[/C][/ROW]
[ROW][C]4[/C][C]-0.126503[/C][C]-1.233[/C][C]0.110309[/C][/ROW]
[ROW][C]5[/C][C]-0.011443[/C][C]-0.1115[/C][C]0.455717[/C][/ROW]
[ROW][C]6[/C][C]-0.133325[/C][C]-1.2995[/C][C]0.09846[/C][/ROW]
[ROW][C]7[/C][C]-0.081263[/C][C]-0.792[/C][C]0.215152[/C][/ROW]
[ROW][C]8[/C][C]-0.043046[/C][C]-0.4196[/C][C]0.337877[/C][/ROW]
[ROW][C]9[/C][C]-0.08573[/C][C]-0.8356[/C][C]0.202742[/C][/ROW]
[ROW][C]10[/C][C]-0.150423[/C][C]-1.4661[/C][C]0.072956[/C][/ROW]
[ROW][C]11[/C][C]0.062913[/C][C]0.6132[/C][C]0.270606[/C][/ROW]
[ROW][C]12[/C][C]0.775124[/C][C]7.555[/C][C]0[/C][/ROW]
[ROW][C]13[/C][C]-0.054507[/C][C]-0.5313[/C][C]0.298235[/C][/ROW]
[ROW][C]14[/C][C]-0.024538[/C][C]-0.2392[/C][C]0.405744[/C][/ROW]
[ROW][C]15[/C][C]-0.146846[/C][C]-1.4313[/C][C]0.077816[/C][/ROW]
[ROW][C]16[/C][C]-0.102792[/C][C]-1.0019[/C][C]0.15947[/C][/ROW]
[ROW][C]17[/C][C]0.024529[/C][C]0.2391[/C][C]0.40578[/C][/ROW]
[ROW][C]18[/C][C]-0.185644[/C][C]-1.8094[/C][C]0.036773[/C][/ROW]
[ROW][C]19[/C][C]-0.052154[/C][C]-0.5083[/C][C]0.306197[/C][/ROW]
[ROW][C]20[/C][C]0.003853[/C][C]0.0376[/C][C]0.485062[/C][/ROW]
[ROW][C]21[/C][C]-0.127603[/C][C]-1.2437[/C][C]0.108331[/C][/ROW]
[ROW][C]22[/C][C]-0.072574[/C][C]-0.7074[/C][C]0.240535[/C][/ROW]
[ROW][C]23[/C][C]0.086633[/C][C]0.8444[/C][C]0.200286[/C][/ROW]
[ROW][C]24[/C][C]0.600167[/C][C]5.8497[/C][C]0[/C][/ROW]
[ROW][C]25[/C][C]-0.018707[/C][C]-0.1823[/C][C]0.427854[/C][/ROW]
[ROW][C]26[/C][C]-0.024423[/C][C]-0.238[/C][C]0.406179[/C][/ROW]
[ROW][C]27[/C][C]-0.18577[/C][C]-1.8107[/C][C]0.036677[/C][/ROW]
[ROW][C]28[/C][C]-0.047475[/C][C]-0.4627[/C][C]0.322309[/C][/ROW]
[ROW][C]29[/C][C]0.053447[/C][C]0.5209[/C][C]0.301811[/C][/ROW]
[ROW][C]30[/C][C]-0.227587[/C][C]-2.2182[/C][C]0.01446[/C][/ROW]
[ROW][C]31[/C][C]0.001096[/C][C]0.0107[/C][C]0.495748[/C][/ROW]
[ROW][C]32[/C][C]-0.018667[/C][C]-0.1819[/C][C]0.428009[/C][/ROW]
[ROW][C]33[/C][C]-0.144713[/C][C]-1.4105[/C][C]0.080831[/C][/ROW]
[ROW][C]34[/C][C]-0.000597[/C][C]-0.0058[/C][C]0.497683[/C][/ROW]
[ROW][C]35[/C][C]0.053591[/C][C]0.5223[/C][C]0.301323[/C][/ROW]
[ROW][C]36[/C][C]0.442127[/C][C]4.3093[/C][C]2e-05[/C][/ROW]
[ROW][C]37[/C][C]0.06085[/C][C]0.5931[/C][C]0.277265[/C][/ROW]
[ROW][C]38[/C][C]-0.080281[/C][C]-0.7825[/C][C]0.217938[/C][/ROW]
[ROW][C]39[/C][C]-0.172532[/C][C]-1.6816[/C][C]0.047962[/C][/ROW]
[ROW][C]40[/C][C]0.02514[/C][C]0.245[/C][C]0.40348[/C][/ROW]
[ROW][C]41[/C][C]-0.037253[/C][C]-0.3631[/C][C]0.35867[/C][/ROW]
[ROW][C]42[/C][C]-0.160152[/C][C]-1.561[/C][C]0.060928[/C][/ROW]
[ROW][C]43[/C][C]0.058485[/C][C]0.57[/C][C]0.284999[/C][/ROW]
[ROW][C]44[/C][C]-0.08312[/C][C]-0.8102[/C][C]0.209938[/C][/ROW]
[ROW][C]45[/C][C]-0.075752[/C][C]-0.7383[/C][C]0.231063[/C][/ROW]
[ROW][C]46[/C][C]0.028035[/C][C]0.2733[/C][C]0.392627[/C][/ROW]
[ROW][C]47[/C][C]-0.019014[/C][C]-0.1853[/C][C]0.426683[/C][/ROW]
[ROW][C]48[/C][C]0.380111[/C][C]3.7049[/C][C]0.000178[/C][/ROW]
[/TABLE]
Source: https://freestatistics.org/blog/index.php?pk=234231&T=1

Globally Unique Identifier (entire table): ba.freestatistics.org/blog/index.php?pk=234231&T=1

As an alternative you can also use a QR Code:  

The GUIDs for individual cells are displayed in the table below:

Autocorrelation Function
Time lag kACF(k)T-STATP-value
1-0.042935-0.41850.338269
2-0.106272-1.03580.151459
3-0.09513-0.92720.178082
4-0.126503-1.2330.110309
5-0.011443-0.11150.455717
6-0.133325-1.29950.09846
7-0.081263-0.7920.215152
8-0.043046-0.41960.337877
9-0.08573-0.83560.202742
10-0.150423-1.46610.072956
110.0629130.61320.270606
120.7751247.5550
13-0.054507-0.53130.298235
14-0.024538-0.23920.405744
15-0.146846-1.43130.077816
16-0.102792-1.00190.15947
170.0245290.23910.40578
18-0.185644-1.80940.036773
19-0.052154-0.50830.306197
200.0038530.03760.485062
21-0.127603-1.24370.108331
22-0.072574-0.70740.240535
230.0866330.84440.200286
240.6001675.84970
25-0.018707-0.18230.427854
26-0.024423-0.2380.406179
27-0.18577-1.81070.036677
28-0.047475-0.46270.322309
290.0534470.52090.301811
30-0.227587-2.21820.01446
310.0010960.01070.495748
32-0.018667-0.18190.428009
33-0.144713-1.41050.080831
34-0.000597-0.00580.497683
350.0535910.52230.301323
360.4421274.30932e-05
370.060850.59310.277265
38-0.080281-0.78250.217938
39-0.172532-1.68160.047962
400.025140.2450.40348
41-0.037253-0.36310.35867
42-0.160152-1.5610.060928
430.0584850.570.284999
44-0.08312-0.81020.209938
45-0.075752-0.73830.231063
460.0280350.27330.392627
47-0.019014-0.18530.426683
480.3801113.70490.000178


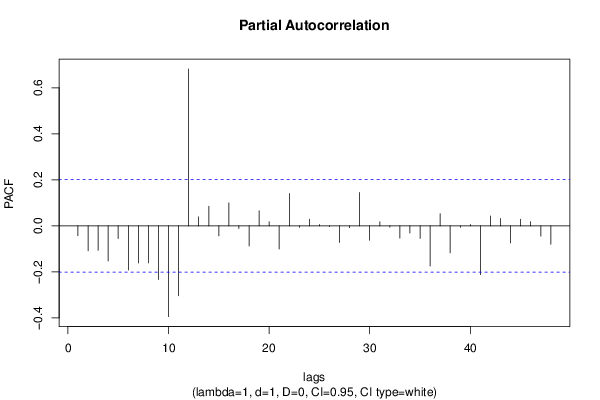
Partial Autocorrelation Function
Time lag kPACF(k)T-STATP-value
1-0.042935-0.41850.338269
2-0.108316-1.05570.146885
3-0.106278-1.03590.151445
4-0.152503-1.48640.07024
5-0.054795-0.53410.297268
6-0.191899-1.87040.032254
7-0.16109-1.57010.059858
8-0.160873-1.5680.060103
9-0.232947-2.27050.012719
10-0.394305-3.84320.00011
11-0.303518-2.95830.001952
120.6817256.64460
130.0391630.38170.351761
140.085110.82950.204438
15-0.04352-0.42420.336195
160.0999440.97410.166232
17-0.011048-0.10770.457236
18-0.087477-0.85260.198008
190.065470.63810.262464
200.0180690.17610.430289
21-0.100641-0.98090.16456
220.1403961.36840.087206
23-0.006664-0.0650.474174
240.0285790.27860.390597
250.0061440.05990.476185
26-0.003294-0.03210.487227
27-0.072025-0.7020.242194
28-0.007585-0.07390.470612
290.1447621.4110.080761
30-0.062523-0.60940.271856
310.0182350.17770.429655
32-0.005481-0.05340.478752
33-0.053384-0.52030.302025
34-0.030974-0.30190.381697
35-0.054293-0.52920.298958
36-0.174215-1.6980.046387
370.0529570.51620.30347
38-0.117129-1.14160.128238
39-0.006614-0.06450.474366
400.0059730.05820.476847
41-0.211764-2.0640.020871
420.042830.41750.338643
430.0317920.30990.378669
44-0.073903-0.72030.236548
450.0289290.2820.389293
460.0184350.17970.428891
47-0.044467-0.43340.332849
48-0.079632-0.77620.219793

\begin{tabular}{lllllllll}
\hline
Partial Autocorrelation Function \tabularnewline
Time lag k & PACF(k) & T-STAT & P-value \tabularnewline
1 & -0.042935 & -0.4185 & 0.338269 \tabularnewline
2 & -0.108316 & -1.0557 & 0.146885 \tabularnewline
3 & -0.106278 & -1.0359 & 0.151445 \tabularnewline
4 & -0.152503 & -1.4864 & 0.07024 \tabularnewline
5 & -0.054795 & -0.5341 & 0.297268 \tabularnewline
6 & -0.191899 & -1.8704 & 0.032254 \tabularnewline
7 & -0.16109 & -1.5701 & 0.059858 \tabularnewline
8 & -0.160873 & -1.568 & 0.060103 \tabularnewline
9 & -0.232947 & -2.2705 & 0.012719 \tabularnewline
10 & -0.394305 & -3.8432 & 0.00011 \tabularnewline
11 & -0.303518 & -2.9583 & 0.001952 \tabularnewline
12 & 0.681725 & 6.6446 & 0 \tabularnewline
13 & 0.039163 & 0.3817 & 0.351761 \tabularnewline
14 & 0.08511 & 0.8295 & 0.204438 \tabularnewline
15 & -0.04352 & -0.4242 & 0.336195 \tabularnewline
16 & 0.099944 & 0.9741 & 0.166232 \tabularnewline
17 & -0.011048 & -0.1077 & 0.457236 \tabularnewline
18 & -0.087477 & -0.8526 & 0.198008 \tabularnewline
19 & 0.06547 & 0.6381 & 0.262464 \tabularnewline
20 & 0.018069 & 0.1761 & 0.430289 \tabularnewline
21 & -0.100641 & -0.9809 & 0.16456 \tabularnewline
22 & 0.140396 & 1.3684 & 0.087206 \tabularnewline
23 & -0.006664 & -0.065 & 0.474174 \tabularnewline
24 & 0.028579 & 0.2786 & 0.390597 \tabularnewline
25 & 0.006144 & 0.0599 & 0.476185 \tabularnewline
26 & -0.003294 & -0.0321 & 0.487227 \tabularnewline
27 & -0.072025 & -0.702 & 0.242194 \tabularnewline
28 & -0.007585 & -0.0739 & 0.470612 \tabularnewline
29 & 0.144762 & 1.411 & 0.080761 \tabularnewline
30 & -0.062523 & -0.6094 & 0.271856 \tabularnewline
31 & 0.018235 & 0.1777 & 0.429655 \tabularnewline
32 & -0.005481 & -0.0534 & 0.478752 \tabularnewline
33 & -0.053384 & -0.5203 & 0.302025 \tabularnewline
34 & -0.030974 & -0.3019 & 0.381697 \tabularnewline
35 & -0.054293 & -0.5292 & 0.298958 \tabularnewline
36 & -0.174215 & -1.698 & 0.046387 \tabularnewline
37 & 0.052957 & 0.5162 & 0.30347 \tabularnewline
38 & -0.117129 & -1.1416 & 0.128238 \tabularnewline
39 & -0.006614 & -0.0645 & 0.474366 \tabularnewline
40 & 0.005973 & 0.0582 & 0.476847 \tabularnewline
41 & -0.211764 & -2.064 & 0.020871 \tabularnewline
42 & 0.04283 & 0.4175 & 0.338643 \tabularnewline
43 & 0.031792 & 0.3099 & 0.378669 \tabularnewline
44 & -0.073903 & -0.7203 & 0.236548 \tabularnewline
45 & 0.028929 & 0.282 & 0.389293 \tabularnewline
46 & 0.018435 & 0.1797 & 0.428891 \tabularnewline
47 & -0.044467 & -0.4334 & 0.332849 \tabularnewline
48 & -0.079632 & -0.7762 & 0.219793 \tabularnewline
\hline
\end{tabular}
%Source: https://freestatistics.org/blog/index.php?pk=234231&T=2

[TABLE]
[ROW][C]Partial Autocorrelation Function[/C][/ROW]
[ROW][C]Time lag k[/C][C]PACF(k)[/C][C]T-STAT[/C][C]P-value[/C][/ROW]
[ROW][C]1[/C][C]-0.042935[/C][C]-0.4185[/C][C]0.338269[/C][/ROW]
[ROW][C]2[/C][C]-0.108316[/C][C]-1.0557[/C][C]0.146885[/C][/ROW]
[ROW][C]3[/C][C]-0.106278[/C][C]-1.0359[/C][C]0.151445[/C][/ROW]
[ROW][C]4[/C][C]-0.152503[/C][C]-1.4864[/C][C]0.07024[/C][/ROW]
[ROW][C]5[/C][C]-0.054795[/C][C]-0.5341[/C][C]0.297268[/C][/ROW]
[ROW][C]6[/C][C]-0.191899[/C][C]-1.8704[/C][C]0.032254[/C][/ROW]
[ROW][C]7[/C][C]-0.16109[/C][C]-1.5701[/C][C]0.059858[/C][/ROW]
[ROW][C]8[/C][C]-0.160873[/C][C]-1.568[/C][C]0.060103[/C][/ROW]
[ROW][C]9[/C][C]-0.232947[/C][C]-2.2705[/C][C]0.012719[/C][/ROW]
[ROW][C]10[/C][C]-0.394305[/C][C]-3.8432[/C][C]0.00011[/C][/ROW]
[ROW][C]11[/C][C]-0.303518[/C][C]-2.9583[/C][C]0.001952[/C][/ROW]
[ROW][C]12[/C][C]0.681725[/C][C]6.6446[/C][C]0[/C][/ROW]
[ROW][C]13[/C][C]0.039163[/C][C]0.3817[/C][C]0.351761[/C][/ROW]
[ROW][C]14[/C][C]0.08511[/C][C]0.8295[/C][C]0.204438[/C][/ROW]
[ROW][C]15[/C][C]-0.04352[/C][C]-0.4242[/C][C]0.336195[/C][/ROW]
[ROW][C]16[/C][C]0.099944[/C][C]0.9741[/C][C]0.166232[/C][/ROW]
[ROW][C]17[/C][C]-0.011048[/C][C]-0.1077[/C][C]0.457236[/C][/ROW]
[ROW][C]18[/C][C]-0.087477[/C][C]-0.8526[/C][C]0.198008[/C][/ROW]
[ROW][C]19[/C][C]0.06547[/C][C]0.6381[/C][C]0.262464[/C][/ROW]
[ROW][C]20[/C][C]0.018069[/C][C]0.1761[/C][C]0.430289[/C][/ROW]
[ROW][C]21[/C][C]-0.100641[/C][C]-0.9809[/C][C]0.16456[/C][/ROW]
[ROW][C]22[/C][C]0.140396[/C][C]1.3684[/C][C]0.087206[/C][/ROW]
[ROW][C]23[/C][C]-0.006664[/C][C]-0.065[/C][C]0.474174[/C][/ROW]
[ROW][C]24[/C][C]0.028579[/C][C]0.2786[/C][C]0.390597[/C][/ROW]
[ROW][C]25[/C][C]0.006144[/C][C]0.0599[/C][C]0.476185[/C][/ROW]
[ROW][C]26[/C][C]-0.003294[/C][C]-0.0321[/C][C]0.487227[/C][/ROW]
[ROW][C]27[/C][C]-0.072025[/C][C]-0.702[/C][C]0.242194[/C][/ROW]
[ROW][C]28[/C][C]-0.007585[/C][C]-0.0739[/C][C]0.470612[/C][/ROW]
[ROW][C]29[/C][C]0.144762[/C][C]1.411[/C][C]0.080761[/C][/ROW]
[ROW][C]30[/C][C]-0.062523[/C][C]-0.6094[/C][C]0.271856[/C][/ROW]
[ROW][C]31[/C][C]0.018235[/C][C]0.1777[/C][C]0.429655[/C][/ROW]
[ROW][C]32[/C][C]-0.005481[/C][C]-0.0534[/C][C]0.478752[/C][/ROW]
[ROW][C]33[/C][C]-0.053384[/C][C]-0.5203[/C][C]0.302025[/C][/ROW]
[ROW][C]34[/C][C]-0.030974[/C][C]-0.3019[/C][C]0.381697[/C][/ROW]
[ROW][C]35[/C][C]-0.054293[/C][C]-0.5292[/C][C]0.298958[/C][/ROW]
[ROW][C]36[/C][C]-0.174215[/C][C]-1.698[/C][C]0.046387[/C][/ROW]
[ROW][C]37[/C][C]0.052957[/C][C]0.5162[/C][C]0.30347[/C][/ROW]
[ROW][C]38[/C][C]-0.117129[/C][C]-1.1416[/C][C]0.128238[/C][/ROW]
[ROW][C]39[/C][C]-0.006614[/C][C]-0.0645[/C][C]0.474366[/C][/ROW]
[ROW][C]40[/C][C]0.005973[/C][C]0.0582[/C][C]0.476847[/C][/ROW]
[ROW][C]41[/C][C]-0.211764[/C][C]-2.064[/C][C]0.020871[/C][/ROW]
[ROW][C]42[/C][C]0.04283[/C][C]0.4175[/C][C]0.338643[/C][/ROW]
[ROW][C]43[/C][C]0.031792[/C][C]0.3099[/C][C]0.378669[/C][/ROW]
[ROW][C]44[/C][C]-0.073903[/C][C]-0.7203[/C][C]0.236548[/C][/ROW]
[ROW][C]45[/C][C]0.028929[/C][C]0.282[/C][C]0.389293[/C][/ROW]
[ROW][C]46[/C][C]0.018435[/C][C]0.1797[/C][C]0.428891[/C][/ROW]
[ROW][C]47[/C][C]-0.044467[/C][C]-0.4334[/C][C]0.332849[/C][/ROW]
[ROW][C]48[/C][C]-0.079632[/C][C]-0.7762[/C][C]0.219793[/C][/ROW]
[/TABLE]
Source: https://freestatistics.org/blog/index.php?pk=234231&T=2

Globally Unique Identifier (entire table): ba.freestatistics.org/blog/index.php?pk=234231&T=2

As an alternative you can also use a QR Code:  

The GUIDs for individual cells are displayed in the table below:

Partial Autocorrelation Function
Time lag kPACF(k)T-STATP-value
1-0.042935-0.41850.338269
2-0.108316-1.05570.146885
3-0.106278-1.03590.151445
4-0.152503-1.48640.07024
5-0.054795-0.53410.297268
6-0.191899-1.87040.032254
7-0.16109-1.57010.059858
8-0.160873-1.5680.060103
9-0.232947-2.27050.012719
10-0.394305-3.84320.00011
11-0.303518-2.95830.001952
120.6817256.64460
130.0391630.38170.351761
140.085110.82950.204438
15-0.04352-0.42420.336195
160.0999440.97410.166232
17-0.011048-0.10770.457236
18-0.087477-0.85260.198008
190.065470.63810.262464
200.0180690.17610.430289
21-0.100641-0.98090.16456
220.1403961.36840.087206
23-0.006664-0.0650.474174
240.0285790.27860.390597
250.0061440.05990.476185
26-0.003294-0.03210.487227
27-0.072025-0.7020.242194
28-0.007585-0.07390.470612
290.1447621.4110.080761
30-0.062523-0.60940.271856
310.0182350.17770.429655
32-0.005481-0.05340.478752
33-0.053384-0.52030.302025
34-0.030974-0.30190.381697
35-0.054293-0.52920.298958
36-0.174215-1.6980.046387
370.0529570.51620.30347
38-0.117129-1.14160.128238
39-0.006614-0.06450.474366
400.0059730.05820.476847
41-0.211764-2.0640.020871
420.042830.41750.338643
430.0317920.30990.378669
44-0.073903-0.72030.236548
450.0289290.2820.389293
460.0184350.17970.428891
47-0.044467-0.43340.332849
48-0.079632-0.77620.219793


Parameters (Session):
par1 = 48 ; par2 = 1 ; par3 = 1 ; par4 = 0 ; par5 = 12 ; par6 = White Noise ; par7 = 0.95 ;
Parameters (R input):
par1 = 48 ; par2 = 1 ; par3 = 1 ; par4 = 0 ; par5 = 12 ; par6 = White Noise ; par7 = 0.95 ; par8 = ;
R code (references can be found in the software module):
par8 <- ''
par7 <- '0.95'
par6 <- 'White Noise'
par5 <- '12'
par4 <- '0'
par3 <- '0'
par2 <- '1'
par1 <- '48'
if (par1 == 'Default') {
par1 = 10*log10(length(x))
} else {
par1 <- as.numeric(par1)
}
par2 <- as.numeric(par2)
par3 <- as.numeric(par3)
par4 <- as.numeric(par4)
par5 <- as.numeric(par5)
if (par6 == 'White Noise') par6 <- 'white' else par6 <- 'ma'
par7 <- as.numeric(par7)
if (par8 != '') par8 <- as.numeric(par8)
ox <- x
if (par8 == '') {
if (par2 == 0) {
x <- log(x)
} else {
x <- (x ^ par2 - 1) / par2
}
} else {
x <- log(x,base=par8)
}
if (par3 > 0) x <- diff(x,lag=1,difference=par3)
if (par4 > 0) x <- diff(x,lag=par5,difference=par4)
bitmap(file='picts.png')
op <- par(mfrow=c(2,1))
plot(ox,type='l',main='Original Time Series',xlab='time',ylab='value')
if (par8=='') {
mytitle <- paste('Working Time Series (lambda=',par2,', d=',par3,', D=',par4,')',sep='')
mysub <- paste('(lambda=',par2,', d=',par3,', D=',par4,', CI=', par7, ', CI type=',par6,')',sep='')
} else {
mytitle <- paste('Working Time Series (base=',par8,', d=',par3,', D=',par4,')',sep='')
mysub <- paste('(base=',par8,', d=',par3,', D=',par4,', CI=', par7, ', CI type=',par6,')',sep='')
}
plot(x,type='l', main=mytitle,xlab='time',ylab='value')
par(op)
dev.off()
bitmap(file='pic1.png')
racf <- acf(x, par1, main='Autocorrelation', xlab='time lag', ylab='ACF', ci.type=par6, ci=par7, sub=mysub)
dev.off()
bitmap(file='pic2.png')
rpacf <- pacf(x,par1,main='Partial Autocorrelation',xlab='lags',ylab='PACF',sub=mysub)
dev.off()
(myacf <- c(racf$acf))
(mypacf <- c(rpacf$acf))
lengthx <- length(x)
sqrtn <- sqrt(lengthx)
load(file='createtable')
a<-table.start()
a<-table.row.start(a)
a<-table.element(a,'Autocorrelation Function',4,TRUE)
a<-table.row.end(a)
a<-table.row.start(a)
a<-table.element(a,'Time lag k',header=TRUE)
a<-table.element(a,hyperlink('basics.htm','ACF(k)','click here for more information about the Autocorrelation Function'),header=TRUE)
a<-table.element(a,'T-STAT',header=TRUE)
a<-table.element(a,'P-value',header=TRUE)
a<-table.row.end(a)
for (i in 2:(par1+1)) {
a<-table.row.start(a)
a<-table.element(a,i-1,header=TRUE)
a<-table.element(a,round(myacf[i],6))
mytstat <- myacf[i]*sqrtn
a<-table.element(a,round(mytstat,4))
a<-table.element(a,round(1-pt(abs(mytstat),lengthx),6))
a<-table.row.end(a)
}
a<-table.end(a)
table.save(a,file='mytable.tab')
a<-table.start()
a<-table.row.start(a)
a<-table.element(a,'Partial Autocorrelation Function',4,TRUE)
a<-table.row.end(a)
a<-table.row.start(a)
a<-table.element(a,'Time lag k',header=TRUE)
a<-table.element(a,hyperlink('basics.htm','PACF(k)','click here for more information about the Partial Autocorrelation Function'),header=TRUE)
a<-table.element(a,'T-STAT',header=TRUE)
a<-table.element(a,'P-value',header=TRUE)
a<-table.row.end(a)
for (i in 1:par1) {
a<-table.row.start(a)
a<-table.element(a,i,header=TRUE)
a<-table.element(a,round(mypacf[i],6))
mytstat <- mypacf[i]*sqrtn
a<-table.element(a,round(mytstat,4))
a<-table.element(a,round(1-pt(abs(mytstat),lengthx),6))
a<-table.row.end(a)
}
a<-table.end(a)
table.save(a,file='mytable1.tab')