Free Statistics

of Irreproducible Research!

Author's title

Author*Unverified author*
R Software Modulerwasp_autocorrelation.wasp
Title produced by software(Partial) Autocorrelation Function
Date of computationMon, 03 Mar 2014 16:12:06 -0500
Cite this page as followsStatistical Computations at FreeStatistics.org, Office for Research Development and Education, URL https://freestatistics.org/blog/index.php?v=date/2014/Mar/03/t1393881329mbshne68l2e5umh.htm/, Retrieved Tue, 14 May 2024 06:29:40 +0000
Statistical Computations at FreeStatistics.org, Office for Research Development and Education, URL https://freestatistics.org/blog/index.php?pk=234161, Retrieved Tue, 14 May 2024 06:29:40 +0000
QR Codes:

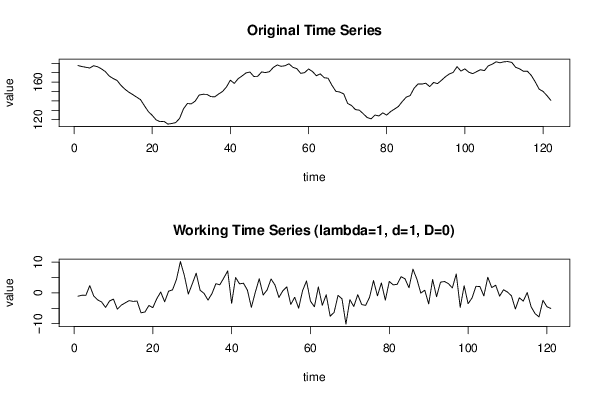
Original text written by user:same data as the previous set, but with (if I read the options correct) a first differencing applied. First set: http://www.freestatistics.org/blog/index.php?v=date/2014/Mar/03/t1393881034ioslw0ua0gai488.htm/
IsPrivate?No (this computation is public)
User-defined keywords
Estimated Impact94
Family? (F = Feedback message, R = changed R code, M = changed R Module, P = changed Parameters, D = changed Data)
-       [(Partial) Autocorrelation Function] [Sydney, AU Temps,...] [2014-03-03 21:12:06] [d41d8cd98f00b204e9800998ecf8427e] [Current]
Feedback Forum

Post a new message
Dataseries X:
177.6
176.5285714
175.7714286
174.9857143
177.3571429
176.3714286
174.1
171.1714286
166.4571429
163.8
161.7857143
156.5142857
152.5428571
149.3142857
146.8142857
144.0571429
141.4142857
134.9571429
128.7428571
124.6571429
119.8714286
117.9857143
118.2857143
115.4142857
115.9714286
116.9714286
121.3571429
131.5714286
137.2428571
136.8714286
139.7857143
146.2
147.0714286
146.9142857
144.5857143
144.3571429
147.3571429
150.0142857
154.8571429
162.0285714
158.6142857
163.6428571
166.6
169.7571429
170.6714286
165.9714286
166.1714286
170.7857143
170.1142857
171.0857143
175.6285714
178.2
176.7285714
177.4428571
179.4142857
175.6714286
174.2571429
169.3
170.0428571
173.9428571
171.2714286
166.7714286
168.7285714
164.7
164.1
156.5142857
150.2
149.4
147.4857143
137.3571429
135.1571429
130.7428571
130.1714286
126.4
122.3428571
120.9571429
124.9857143
124.0428571
127.3
124.9714286
128.7
131.3285714
134.1285714
139.4142857
144
145.6857143
153.4428571
157.9428571
157.9
158.7857143
155.2142857
159.6
158.3714286
161.8714286
165.5857143
168.6142857
170.2428571
176.4142857
171.7285714
174.0571429
170.5714286
168.9285714
171.0857143
173.1571429
172.1857143
177.3
179.0428571
181.5571429
180.5285714
181.5714286
181.8428571
180.9142857
175.6857143
174.1
171.4428571
171.5714286
167.0571429
160.3142857
152.5285714
150.1285714
145.6571429
140.6


Summary of computational transaction
Raw Inputview raw input (R code)
Raw Outputview raw output of R engine
Computing time4 seconds
R Server'Gertrude Mary Cox' @ cox.wessa.net

\begin{tabular}{lllllllll}
\hline
Summary of computational transaction \tabularnewline
Raw Input & view raw input (R code)  \tabularnewline
Raw Output & view raw output of R engine  \tabularnewline
Computing time & 4 seconds \tabularnewline
R Server & 'Gertrude Mary Cox' @ cox.wessa.net \tabularnewline
\hline
\end{tabular}
%Source: https://freestatistics.org/blog/index.php?pk=234161&T=0

[TABLE]
[ROW][C]Summary of computational transaction[/C][/ROW]
[ROW][C]Raw Input[/C][C]view raw input (R code) [/C][/ROW]
[ROW][C]Raw Output[/C][C]view raw output of R engine [/C][/ROW]
[ROW][C]Computing time[/C][C]4 seconds[/C][/ROW]
[ROW][C]R Server[/C][C]'Gertrude Mary Cox' @ cox.wessa.net[/C][/ROW]
[/TABLE]
Source: https://freestatistics.org/blog/index.php?pk=234161&T=0

Globally Unique Identifier (entire table): ba.freestatistics.org/blog/index.php?pk=234161&T=0

As an alternative you can also use a QR Code:  

The GUIDs for individual cells are displayed in the table below:

Summary of computational transaction
Raw Inputview raw input (R code)
Raw Outputview raw output of R engine
Computing time4 seconds
R Server'Gertrude Mary Cox' @ cox.wessa.net


Autocorrelation Function
Time lag kACF(k)T-STATP-value
10.4270554.69764e-06
20.4001184.40131.2e-05
30.3678364.04624.6e-05
40.3412253.75350.000135
50.2684512.9530.001891
60.2282342.51060.006686
7-0.048831-0.53710.296077
80.2493872.74330.003504
90.0737720.81150.209338
100.0838570.92240.17907
110.0928011.02080.15469
120.045880.50470.307349
13-0.07661-0.84270.200525
14-0.112651-1.23920.108842
15-0.179561-1.97520.025263
16-0.097721-1.07490.142273
17-0.146471-1.61120.054873
18-0.24015-2.64160.00467
19-0.190943-2.10040.018886
20-0.168221-1.85040.033346
21-0.155916-1.71510.044445
22-0.20145-2.21590.014283
23-0.131033-1.44140.076033
24-0.200008-2.20010.01485
25-0.200239-2.20260.014758
26-0.242551-2.66810.004337
27-0.168344-1.85180.033247
28-0.252215-2.77440.003204
29-0.145095-1.5960.056544
30-0.344602-3.79060.000118
31-0.228471-2.51320.00664
32-0.19905-2.18960.015238
33-0.172982-1.90280.029721
34-0.223128-2.45440.007767
35-0.107301-1.18030.120097
36-0.237506-2.61260.005063
37-0.065702-0.72270.235621
38-0.183257-2.01580.023017
39-0.098704-1.08570.139875
40-0.080301-0.88330.189411
41-0.08234-0.90570.183436
42-0.093744-1.03120.152254
430.0927561.02030.154807
440.0928391.02120.154591
450.1621441.78360.038499
460.1511121.66220.049527
470.198732.1860.015369
480.2088912.29780.011645
490.2218662.44050.008057
500.2115972.32760.010798
510.1964712.16120.016325
520.2649232.91410.002125
530.2258012.48380.007184
540.228772.51650.006581
550.310353.41380.000436
560.2959293.25520.000735
570.1725211.89770.030057
580.1989182.18810.015292
590.1074671.18210.119735
600.1392241.53150.064132

\begin{tabular}{lllllllll}
\hline
Autocorrelation Function \tabularnewline
Time lag k & ACF(k) & T-STAT & P-value \tabularnewline
1 & 0.427055 & 4.6976 & 4e-06 \tabularnewline
2 & 0.400118 & 4.4013 & 1.2e-05 \tabularnewline
3 & 0.367836 & 4.0462 & 4.6e-05 \tabularnewline
4 & 0.341225 & 3.7535 & 0.000135 \tabularnewline
5 & 0.268451 & 2.953 & 0.001891 \tabularnewline
6 & 0.228234 & 2.5106 & 0.006686 \tabularnewline
7 & -0.048831 & -0.5371 & 0.296077 \tabularnewline
8 & 0.249387 & 2.7433 & 0.003504 \tabularnewline
9 & 0.073772 & 0.8115 & 0.209338 \tabularnewline
10 & 0.083857 & 0.9224 & 0.17907 \tabularnewline
11 & 0.092801 & 1.0208 & 0.15469 \tabularnewline
12 & 0.04588 & 0.5047 & 0.307349 \tabularnewline
13 & -0.07661 & -0.8427 & 0.200525 \tabularnewline
14 & -0.112651 & -1.2392 & 0.108842 \tabularnewline
15 & -0.179561 & -1.9752 & 0.025263 \tabularnewline
16 & -0.097721 & -1.0749 & 0.142273 \tabularnewline
17 & -0.146471 & -1.6112 & 0.054873 \tabularnewline
18 & -0.24015 & -2.6416 & 0.00467 \tabularnewline
19 & -0.190943 & -2.1004 & 0.018886 \tabularnewline
20 & -0.168221 & -1.8504 & 0.033346 \tabularnewline
21 & -0.155916 & -1.7151 & 0.044445 \tabularnewline
22 & -0.20145 & -2.2159 & 0.014283 \tabularnewline
23 & -0.131033 & -1.4414 & 0.076033 \tabularnewline
24 & -0.200008 & -2.2001 & 0.01485 \tabularnewline
25 & -0.200239 & -2.2026 & 0.014758 \tabularnewline
26 & -0.242551 & -2.6681 & 0.004337 \tabularnewline
27 & -0.168344 & -1.8518 & 0.033247 \tabularnewline
28 & -0.252215 & -2.7744 & 0.003204 \tabularnewline
29 & -0.145095 & -1.596 & 0.056544 \tabularnewline
30 & -0.344602 & -3.7906 & 0.000118 \tabularnewline
31 & -0.228471 & -2.5132 & 0.00664 \tabularnewline
32 & -0.19905 & -2.1896 & 0.015238 \tabularnewline
33 & -0.172982 & -1.9028 & 0.029721 \tabularnewline
34 & -0.223128 & -2.4544 & 0.007767 \tabularnewline
35 & -0.107301 & -1.1803 & 0.120097 \tabularnewline
36 & -0.237506 & -2.6126 & 0.005063 \tabularnewline
37 & -0.065702 & -0.7227 & 0.235621 \tabularnewline
38 & -0.183257 & -2.0158 & 0.023017 \tabularnewline
39 & -0.098704 & -1.0857 & 0.139875 \tabularnewline
40 & -0.080301 & -0.8833 & 0.189411 \tabularnewline
41 & -0.08234 & -0.9057 & 0.183436 \tabularnewline
42 & -0.093744 & -1.0312 & 0.152254 \tabularnewline
43 & 0.092756 & 1.0203 & 0.154807 \tabularnewline
44 & 0.092839 & 1.0212 & 0.154591 \tabularnewline
45 & 0.162144 & 1.7836 & 0.038499 \tabularnewline
46 & 0.151112 & 1.6622 & 0.049527 \tabularnewline
47 & 0.19873 & 2.186 & 0.015369 \tabularnewline
48 & 0.208891 & 2.2978 & 0.011645 \tabularnewline
49 & 0.221866 & 2.4405 & 0.008057 \tabularnewline
50 & 0.211597 & 2.3276 & 0.010798 \tabularnewline
51 & 0.196471 & 2.1612 & 0.016325 \tabularnewline
52 & 0.264923 & 2.9141 & 0.002125 \tabularnewline
53 & 0.225801 & 2.4838 & 0.007184 \tabularnewline
54 & 0.22877 & 2.5165 & 0.006581 \tabularnewline
55 & 0.31035 & 3.4138 & 0.000436 \tabularnewline
56 & 0.295929 & 3.2552 & 0.000735 \tabularnewline
57 & 0.172521 & 1.8977 & 0.030057 \tabularnewline
58 & 0.198918 & 2.1881 & 0.015292 \tabularnewline
59 & 0.107467 & 1.1821 & 0.119735 \tabularnewline
60 & 0.139224 & 1.5315 & 0.064132 \tabularnewline
\hline
\end{tabular}
%Source: https://freestatistics.org/blog/index.php?pk=234161&T=1

[TABLE]
[ROW][C]Autocorrelation Function[/C][/ROW]
[ROW][C]Time lag k[/C][C]ACF(k)[/C][C]T-STAT[/C][C]P-value[/C][/ROW]
[ROW][C]1[/C][C]0.427055[/C][C]4.6976[/C][C]4e-06[/C][/ROW]
[ROW][C]2[/C][C]0.400118[/C][C]4.4013[/C][C]1.2e-05[/C][/ROW]
[ROW][C]3[/C][C]0.367836[/C][C]4.0462[/C][C]4.6e-05[/C][/ROW]
[ROW][C]4[/C][C]0.341225[/C][C]3.7535[/C][C]0.000135[/C][/ROW]
[ROW][C]5[/C][C]0.268451[/C][C]2.953[/C][C]0.001891[/C][/ROW]
[ROW][C]6[/C][C]0.228234[/C][C]2.5106[/C][C]0.006686[/C][/ROW]
[ROW][C]7[/C][C]-0.048831[/C][C]-0.5371[/C][C]0.296077[/C][/ROW]
[ROW][C]8[/C][C]0.249387[/C][C]2.7433[/C][C]0.003504[/C][/ROW]
[ROW][C]9[/C][C]0.073772[/C][C]0.8115[/C][C]0.209338[/C][/ROW]
[ROW][C]10[/C][C]0.083857[/C][C]0.9224[/C][C]0.17907[/C][/ROW]
[ROW][C]11[/C][C]0.092801[/C][C]1.0208[/C][C]0.15469[/C][/ROW]
[ROW][C]12[/C][C]0.04588[/C][C]0.5047[/C][C]0.307349[/C][/ROW]
[ROW][C]13[/C][C]-0.07661[/C][C]-0.8427[/C][C]0.200525[/C][/ROW]
[ROW][C]14[/C][C]-0.112651[/C][C]-1.2392[/C][C]0.108842[/C][/ROW]
[ROW][C]15[/C][C]-0.179561[/C][C]-1.9752[/C][C]0.025263[/C][/ROW]
[ROW][C]16[/C][C]-0.097721[/C][C]-1.0749[/C][C]0.142273[/C][/ROW]
[ROW][C]17[/C][C]-0.146471[/C][C]-1.6112[/C][C]0.054873[/C][/ROW]
[ROW][C]18[/C][C]-0.24015[/C][C]-2.6416[/C][C]0.00467[/C][/ROW]
[ROW][C]19[/C][C]-0.190943[/C][C]-2.1004[/C][C]0.018886[/C][/ROW]
[ROW][C]20[/C][C]-0.168221[/C][C]-1.8504[/C][C]0.033346[/C][/ROW]
[ROW][C]21[/C][C]-0.155916[/C][C]-1.7151[/C][C]0.044445[/C][/ROW]
[ROW][C]22[/C][C]-0.20145[/C][C]-2.2159[/C][C]0.014283[/C][/ROW]
[ROW][C]23[/C][C]-0.131033[/C][C]-1.4414[/C][C]0.076033[/C][/ROW]
[ROW][C]24[/C][C]-0.200008[/C][C]-2.2001[/C][C]0.01485[/C][/ROW]
[ROW][C]25[/C][C]-0.200239[/C][C]-2.2026[/C][C]0.014758[/C][/ROW]
[ROW][C]26[/C][C]-0.242551[/C][C]-2.6681[/C][C]0.004337[/C][/ROW]
[ROW][C]27[/C][C]-0.168344[/C][C]-1.8518[/C][C]0.033247[/C][/ROW]
[ROW][C]28[/C][C]-0.252215[/C][C]-2.7744[/C][C]0.003204[/C][/ROW]
[ROW][C]29[/C][C]-0.145095[/C][C]-1.596[/C][C]0.056544[/C][/ROW]
[ROW][C]30[/C][C]-0.344602[/C][C]-3.7906[/C][C]0.000118[/C][/ROW]
[ROW][C]31[/C][C]-0.228471[/C][C]-2.5132[/C][C]0.00664[/C][/ROW]
[ROW][C]32[/C][C]-0.19905[/C][C]-2.1896[/C][C]0.015238[/C][/ROW]
[ROW][C]33[/C][C]-0.172982[/C][C]-1.9028[/C][C]0.029721[/C][/ROW]
[ROW][C]34[/C][C]-0.223128[/C][C]-2.4544[/C][C]0.007767[/C][/ROW]
[ROW][C]35[/C][C]-0.107301[/C][C]-1.1803[/C][C]0.120097[/C][/ROW]
[ROW][C]36[/C][C]-0.237506[/C][C]-2.6126[/C][C]0.005063[/C][/ROW]
[ROW][C]37[/C][C]-0.065702[/C][C]-0.7227[/C][C]0.235621[/C][/ROW]
[ROW][C]38[/C][C]-0.183257[/C][C]-2.0158[/C][C]0.023017[/C][/ROW]
[ROW][C]39[/C][C]-0.098704[/C][C]-1.0857[/C][C]0.139875[/C][/ROW]
[ROW][C]40[/C][C]-0.080301[/C][C]-0.8833[/C][C]0.189411[/C][/ROW]
[ROW][C]41[/C][C]-0.08234[/C][C]-0.9057[/C][C]0.183436[/C][/ROW]
[ROW][C]42[/C][C]-0.093744[/C][C]-1.0312[/C][C]0.152254[/C][/ROW]
[ROW][C]43[/C][C]0.092756[/C][C]1.0203[/C][C]0.154807[/C][/ROW]
[ROW][C]44[/C][C]0.092839[/C][C]1.0212[/C][C]0.154591[/C][/ROW]
[ROW][C]45[/C][C]0.162144[/C][C]1.7836[/C][C]0.038499[/C][/ROW]
[ROW][C]46[/C][C]0.151112[/C][C]1.6622[/C][C]0.049527[/C][/ROW]
[ROW][C]47[/C][C]0.19873[/C][C]2.186[/C][C]0.015369[/C][/ROW]
[ROW][C]48[/C][C]0.208891[/C][C]2.2978[/C][C]0.011645[/C][/ROW]
[ROW][C]49[/C][C]0.221866[/C][C]2.4405[/C][C]0.008057[/C][/ROW]
[ROW][C]50[/C][C]0.211597[/C][C]2.3276[/C][C]0.010798[/C][/ROW]
[ROW][C]51[/C][C]0.196471[/C][C]2.1612[/C][C]0.016325[/C][/ROW]
[ROW][C]52[/C][C]0.264923[/C][C]2.9141[/C][C]0.002125[/C][/ROW]
[ROW][C]53[/C][C]0.225801[/C][C]2.4838[/C][C]0.007184[/C][/ROW]
[ROW][C]54[/C][C]0.22877[/C][C]2.5165[/C][C]0.006581[/C][/ROW]
[ROW][C]55[/C][C]0.31035[/C][C]3.4138[/C][C]0.000436[/C][/ROW]
[ROW][C]56[/C][C]0.295929[/C][C]3.2552[/C][C]0.000735[/C][/ROW]
[ROW][C]57[/C][C]0.172521[/C][C]1.8977[/C][C]0.030057[/C][/ROW]
[ROW][C]58[/C][C]0.198918[/C][C]2.1881[/C][C]0.015292[/C][/ROW]
[ROW][C]59[/C][C]0.107467[/C][C]1.1821[/C][C]0.119735[/C][/ROW]
[ROW][C]60[/C][C]0.139224[/C][C]1.5315[/C][C]0.064132[/C][/ROW]
[/TABLE]
Source: https://freestatistics.org/blog/index.php?pk=234161&T=1

Globally Unique Identifier (entire table): ba.freestatistics.org/blog/index.php?pk=234161&T=1

As an alternative you can also use a QR Code:  

The GUIDs for individual cells are displayed in the table below:

Autocorrelation Function
Time lag kACF(k)T-STATP-value
10.4270554.69764e-06
20.4001184.40131.2e-05
30.3678364.04624.6e-05
40.3412253.75350.000135
50.2684512.9530.001891
60.2282342.51060.006686
7-0.048831-0.53710.296077
80.2493872.74330.003504
90.0737720.81150.209338
100.0838570.92240.17907
110.0928011.02080.15469
120.045880.50470.307349
13-0.07661-0.84270.200525
14-0.112651-1.23920.108842
15-0.179561-1.97520.025263
16-0.097721-1.07490.142273
17-0.146471-1.61120.054873
18-0.24015-2.64160.00467
19-0.190943-2.10040.018886
20-0.168221-1.85040.033346
21-0.155916-1.71510.044445
22-0.20145-2.21590.014283
23-0.131033-1.44140.076033
24-0.200008-2.20010.01485
25-0.200239-2.20260.014758
26-0.242551-2.66810.004337
27-0.168344-1.85180.033247
28-0.252215-2.77440.003204
29-0.145095-1.5960.056544
30-0.344602-3.79060.000118
31-0.228471-2.51320.00664
32-0.19905-2.18960.015238
33-0.172982-1.90280.029721
34-0.223128-2.45440.007767
35-0.107301-1.18030.120097
36-0.237506-2.61260.005063
37-0.065702-0.72270.235621
38-0.183257-2.01580.023017
39-0.098704-1.08570.139875
40-0.080301-0.88330.189411
41-0.08234-0.90570.183436
42-0.093744-1.03120.152254
430.0927561.02030.154807
440.0928391.02120.154591
450.1621441.78360.038499
460.1511121.66220.049527
470.198732.1860.015369
480.2088912.29780.011645
490.2218662.44050.008057
500.2115972.32760.010798
510.1964712.16120.016325
520.2649232.91410.002125
530.2258012.48380.007184
540.228772.51650.006581
550.310353.41380.000436
560.2959293.25520.000735
570.1725211.89770.030057
580.1989182.18810.015292
590.1074671.18210.119735
600.1392241.53150.064132


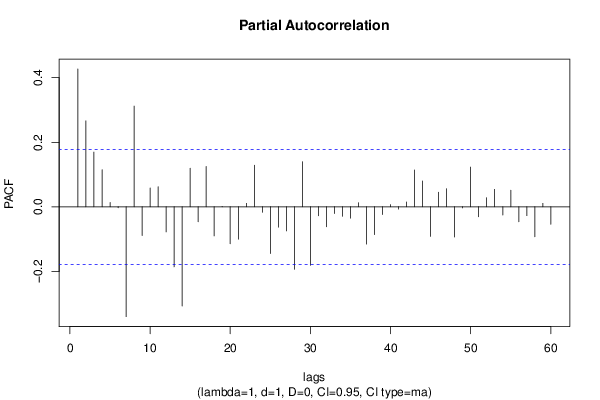
Partial Autocorrelation Function
Time lag kPACF(k)T-STATP-value
10.4270554.69764e-06
20.266312.92940.00203
30.1694751.86420.032357
40.1150551.26560.104043
50.013170.14490.442525
6-0.003165-0.03480.486142
7-0.340252-3.74280.00014
80.3120123.43210.00041
9-0.088916-0.97810.164994
100.0581450.63960.261824
110.0621010.68310.247921
12-0.077668-0.85440.1973
13-0.185979-2.04580.021473
14-0.307331-3.38060.000487
150.1192981.31230.095954
16-0.046514-0.51170.304912
170.124891.37380.086023
18-0.090165-0.99180.161634
190.0009030.00990.496043
20-0.114268-1.2570.105596
21-0.100118-1.10130.136476
220.0107070.11780.453221
230.128611.41470.079861
24-0.016636-0.1830.427553
25-0.144795-1.59270.056913
26-0.062965-0.69260.244941
27-0.074603-0.82060.206735
28-0.19359-2.12950.01762
290.1394951.53440.063765
30-0.181046-1.99150.024339
31-0.027798-0.30580.380148
32-0.061568-0.67720.249771
33-0.020914-0.230.409221
34-0.029397-0.32340.373486
35-0.034987-0.38490.35051
360.0126860.13950.444627
37-0.11551-1.27060.103152
38-0.086091-0.9470.172763
39-0.023816-0.2620.396891
400.006690.07360.47073
41-0.007085-0.07790.469004
420.0150770.16590.434275
430.1140431.25450.106045
440.0801750.88190.189783
45-0.09152-1.00670.15804
460.0453250.49860.309493
470.056150.61770.268983
48-0.093745-1.03120.152253
49-0.003332-0.03660.485413
500.1230531.35360.089196
51-0.030986-0.34080.366905
520.0283450.31180.377867
530.0540170.59420.27675
54-0.025436-0.27980.390055
550.0513180.56450.286732
56-0.046153-0.50770.306301
57-0.027277-0.30010.382326
58-0.092544-1.0180.155358
590.0107480.11820.45304
60-0.054287-0.59720.275758

\begin{tabular}{lllllllll}
\hline
Partial Autocorrelation Function \tabularnewline
Time lag k & PACF(k) & T-STAT & P-value \tabularnewline
1 & 0.427055 & 4.6976 & 4e-06 \tabularnewline
2 & 0.26631 & 2.9294 & 0.00203 \tabularnewline
3 & 0.169475 & 1.8642 & 0.032357 \tabularnewline
4 & 0.115055 & 1.2656 & 0.104043 \tabularnewline
5 & 0.01317 & 0.1449 & 0.442525 \tabularnewline
6 & -0.003165 & -0.0348 & 0.486142 \tabularnewline
7 & -0.340252 & -3.7428 & 0.00014 \tabularnewline
8 & 0.312012 & 3.4321 & 0.00041 \tabularnewline
9 & -0.088916 & -0.9781 & 0.164994 \tabularnewline
10 & 0.058145 & 0.6396 & 0.261824 \tabularnewline
11 & 0.062101 & 0.6831 & 0.247921 \tabularnewline
12 & -0.077668 & -0.8544 & 0.1973 \tabularnewline
13 & -0.185979 & -2.0458 & 0.021473 \tabularnewline
14 & -0.307331 & -3.3806 & 0.000487 \tabularnewline
15 & 0.119298 & 1.3123 & 0.095954 \tabularnewline
16 & -0.046514 & -0.5117 & 0.304912 \tabularnewline
17 & 0.12489 & 1.3738 & 0.086023 \tabularnewline
18 & -0.090165 & -0.9918 & 0.161634 \tabularnewline
19 & 0.000903 & 0.0099 & 0.496043 \tabularnewline
20 & -0.114268 & -1.257 & 0.105596 \tabularnewline
21 & -0.100118 & -1.1013 & 0.136476 \tabularnewline
22 & 0.010707 & 0.1178 & 0.453221 \tabularnewline
23 & 0.12861 & 1.4147 & 0.079861 \tabularnewline
24 & -0.016636 & -0.183 & 0.427553 \tabularnewline
25 & -0.144795 & -1.5927 & 0.056913 \tabularnewline
26 & -0.062965 & -0.6926 & 0.244941 \tabularnewline
27 & -0.074603 & -0.8206 & 0.206735 \tabularnewline
28 & -0.19359 & -2.1295 & 0.01762 \tabularnewline
29 & 0.139495 & 1.5344 & 0.063765 \tabularnewline
30 & -0.181046 & -1.9915 & 0.024339 \tabularnewline
31 & -0.027798 & -0.3058 & 0.380148 \tabularnewline
32 & -0.061568 & -0.6772 & 0.249771 \tabularnewline
33 & -0.020914 & -0.23 & 0.409221 \tabularnewline
34 & -0.029397 & -0.3234 & 0.373486 \tabularnewline
35 & -0.034987 & -0.3849 & 0.35051 \tabularnewline
36 & 0.012686 & 0.1395 & 0.444627 \tabularnewline
37 & -0.11551 & -1.2706 & 0.103152 \tabularnewline
38 & -0.086091 & -0.947 & 0.172763 \tabularnewline
39 & -0.023816 & -0.262 & 0.396891 \tabularnewline
40 & 0.00669 & 0.0736 & 0.47073 \tabularnewline
41 & -0.007085 & -0.0779 & 0.469004 \tabularnewline
42 & 0.015077 & 0.1659 & 0.434275 \tabularnewline
43 & 0.114043 & 1.2545 & 0.106045 \tabularnewline
44 & 0.080175 & 0.8819 & 0.189783 \tabularnewline
45 & -0.09152 & -1.0067 & 0.15804 \tabularnewline
46 & 0.045325 & 0.4986 & 0.309493 \tabularnewline
47 & 0.05615 & 0.6177 & 0.268983 \tabularnewline
48 & -0.093745 & -1.0312 & 0.152253 \tabularnewline
49 & -0.003332 & -0.0366 & 0.485413 \tabularnewline
50 & 0.123053 & 1.3536 & 0.089196 \tabularnewline
51 & -0.030986 & -0.3408 & 0.366905 \tabularnewline
52 & 0.028345 & 0.3118 & 0.377867 \tabularnewline
53 & 0.054017 & 0.5942 & 0.27675 \tabularnewline
54 & -0.025436 & -0.2798 & 0.390055 \tabularnewline
55 & 0.051318 & 0.5645 & 0.286732 \tabularnewline
56 & -0.046153 & -0.5077 & 0.306301 \tabularnewline
57 & -0.027277 & -0.3001 & 0.382326 \tabularnewline
58 & -0.092544 & -1.018 & 0.155358 \tabularnewline
59 & 0.010748 & 0.1182 & 0.45304 \tabularnewline
60 & -0.054287 & -0.5972 & 0.275758 \tabularnewline
\hline
\end{tabular}
%Source: https://freestatistics.org/blog/index.php?pk=234161&T=2

[TABLE]
[ROW][C]Partial Autocorrelation Function[/C][/ROW]
[ROW][C]Time lag k[/C][C]PACF(k)[/C][C]T-STAT[/C][C]P-value[/C][/ROW]
[ROW][C]1[/C][C]0.427055[/C][C]4.6976[/C][C]4e-06[/C][/ROW]
[ROW][C]2[/C][C]0.26631[/C][C]2.9294[/C][C]0.00203[/C][/ROW]
[ROW][C]3[/C][C]0.169475[/C][C]1.8642[/C][C]0.032357[/C][/ROW]
[ROW][C]4[/C][C]0.115055[/C][C]1.2656[/C][C]0.104043[/C][/ROW]
[ROW][C]5[/C][C]0.01317[/C][C]0.1449[/C][C]0.442525[/C][/ROW]
[ROW][C]6[/C][C]-0.003165[/C][C]-0.0348[/C][C]0.486142[/C][/ROW]
[ROW][C]7[/C][C]-0.340252[/C][C]-3.7428[/C][C]0.00014[/C][/ROW]
[ROW][C]8[/C][C]0.312012[/C][C]3.4321[/C][C]0.00041[/C][/ROW]
[ROW][C]9[/C][C]-0.088916[/C][C]-0.9781[/C][C]0.164994[/C][/ROW]
[ROW][C]10[/C][C]0.058145[/C][C]0.6396[/C][C]0.261824[/C][/ROW]
[ROW][C]11[/C][C]0.062101[/C][C]0.6831[/C][C]0.247921[/C][/ROW]
[ROW][C]12[/C][C]-0.077668[/C][C]-0.8544[/C][C]0.1973[/C][/ROW]
[ROW][C]13[/C][C]-0.185979[/C][C]-2.0458[/C][C]0.021473[/C][/ROW]
[ROW][C]14[/C][C]-0.307331[/C][C]-3.3806[/C][C]0.000487[/C][/ROW]
[ROW][C]15[/C][C]0.119298[/C][C]1.3123[/C][C]0.095954[/C][/ROW]
[ROW][C]16[/C][C]-0.046514[/C][C]-0.5117[/C][C]0.304912[/C][/ROW]
[ROW][C]17[/C][C]0.12489[/C][C]1.3738[/C][C]0.086023[/C][/ROW]
[ROW][C]18[/C][C]-0.090165[/C][C]-0.9918[/C][C]0.161634[/C][/ROW]
[ROW][C]19[/C][C]0.000903[/C][C]0.0099[/C][C]0.496043[/C][/ROW]
[ROW][C]20[/C][C]-0.114268[/C][C]-1.257[/C][C]0.105596[/C][/ROW]
[ROW][C]21[/C][C]-0.100118[/C][C]-1.1013[/C][C]0.136476[/C][/ROW]
[ROW][C]22[/C][C]0.010707[/C][C]0.1178[/C][C]0.453221[/C][/ROW]
[ROW][C]23[/C][C]0.12861[/C][C]1.4147[/C][C]0.079861[/C][/ROW]
[ROW][C]24[/C][C]-0.016636[/C][C]-0.183[/C][C]0.427553[/C][/ROW]
[ROW][C]25[/C][C]-0.144795[/C][C]-1.5927[/C][C]0.056913[/C][/ROW]
[ROW][C]26[/C][C]-0.062965[/C][C]-0.6926[/C][C]0.244941[/C][/ROW]
[ROW][C]27[/C][C]-0.074603[/C][C]-0.8206[/C][C]0.206735[/C][/ROW]
[ROW][C]28[/C][C]-0.19359[/C][C]-2.1295[/C][C]0.01762[/C][/ROW]
[ROW][C]29[/C][C]0.139495[/C][C]1.5344[/C][C]0.063765[/C][/ROW]
[ROW][C]30[/C][C]-0.181046[/C][C]-1.9915[/C][C]0.024339[/C][/ROW]
[ROW][C]31[/C][C]-0.027798[/C][C]-0.3058[/C][C]0.380148[/C][/ROW]
[ROW][C]32[/C][C]-0.061568[/C][C]-0.6772[/C][C]0.249771[/C][/ROW]
[ROW][C]33[/C][C]-0.020914[/C][C]-0.23[/C][C]0.409221[/C][/ROW]
[ROW][C]34[/C][C]-0.029397[/C][C]-0.3234[/C][C]0.373486[/C][/ROW]
[ROW][C]35[/C][C]-0.034987[/C][C]-0.3849[/C][C]0.35051[/C][/ROW]
[ROW][C]36[/C][C]0.012686[/C][C]0.1395[/C][C]0.444627[/C][/ROW]
[ROW][C]37[/C][C]-0.11551[/C][C]-1.2706[/C][C]0.103152[/C][/ROW]
[ROW][C]38[/C][C]-0.086091[/C][C]-0.947[/C][C]0.172763[/C][/ROW]
[ROW][C]39[/C][C]-0.023816[/C][C]-0.262[/C][C]0.396891[/C][/ROW]
[ROW][C]40[/C][C]0.00669[/C][C]0.0736[/C][C]0.47073[/C][/ROW]
[ROW][C]41[/C][C]-0.007085[/C][C]-0.0779[/C][C]0.469004[/C][/ROW]
[ROW][C]42[/C][C]0.015077[/C][C]0.1659[/C][C]0.434275[/C][/ROW]
[ROW][C]43[/C][C]0.114043[/C][C]1.2545[/C][C]0.106045[/C][/ROW]
[ROW][C]44[/C][C]0.080175[/C][C]0.8819[/C][C]0.189783[/C][/ROW]
[ROW][C]45[/C][C]-0.09152[/C][C]-1.0067[/C][C]0.15804[/C][/ROW]
[ROW][C]46[/C][C]0.045325[/C][C]0.4986[/C][C]0.309493[/C][/ROW]
[ROW][C]47[/C][C]0.05615[/C][C]0.6177[/C][C]0.268983[/C][/ROW]
[ROW][C]48[/C][C]-0.093745[/C][C]-1.0312[/C][C]0.152253[/C][/ROW]
[ROW][C]49[/C][C]-0.003332[/C][C]-0.0366[/C][C]0.485413[/C][/ROW]
[ROW][C]50[/C][C]0.123053[/C][C]1.3536[/C][C]0.089196[/C][/ROW]
[ROW][C]51[/C][C]-0.030986[/C][C]-0.3408[/C][C]0.366905[/C][/ROW]
[ROW][C]52[/C][C]0.028345[/C][C]0.3118[/C][C]0.377867[/C][/ROW]
[ROW][C]53[/C][C]0.054017[/C][C]0.5942[/C][C]0.27675[/C][/ROW]
[ROW][C]54[/C][C]-0.025436[/C][C]-0.2798[/C][C]0.390055[/C][/ROW]
[ROW][C]55[/C][C]0.051318[/C][C]0.5645[/C][C]0.286732[/C][/ROW]
[ROW][C]56[/C][C]-0.046153[/C][C]-0.5077[/C][C]0.306301[/C][/ROW]
[ROW][C]57[/C][C]-0.027277[/C][C]-0.3001[/C][C]0.382326[/C][/ROW]
[ROW][C]58[/C][C]-0.092544[/C][C]-1.018[/C][C]0.155358[/C][/ROW]
[ROW][C]59[/C][C]0.010748[/C][C]0.1182[/C][C]0.45304[/C][/ROW]
[ROW][C]60[/C][C]-0.054287[/C][C]-0.5972[/C][C]0.275758[/C][/ROW]
[/TABLE]
Source: https://freestatistics.org/blog/index.php?pk=234161&T=2

Globally Unique Identifier (entire table): ba.freestatistics.org/blog/index.php?pk=234161&T=2

As an alternative you can also use a QR Code:  

The GUIDs for individual cells are displayed in the table below:

Partial Autocorrelation Function
Time lag kPACF(k)T-STATP-value
10.4270554.69764e-06
20.266312.92940.00203
30.1694751.86420.032357
40.1150551.26560.104043
50.013170.14490.442525
6-0.003165-0.03480.486142
7-0.340252-3.74280.00014
80.3120123.43210.00041
9-0.088916-0.97810.164994
100.0581450.63960.261824
110.0621010.68310.247921
12-0.077668-0.85440.1973
13-0.185979-2.04580.021473
14-0.307331-3.38060.000487
150.1192981.31230.095954
16-0.046514-0.51170.304912
170.124891.37380.086023
18-0.090165-0.99180.161634
190.0009030.00990.496043
20-0.114268-1.2570.105596
21-0.100118-1.10130.136476
220.0107070.11780.453221
230.128611.41470.079861
24-0.016636-0.1830.427553
25-0.144795-1.59270.056913
26-0.062965-0.69260.244941
27-0.074603-0.82060.206735
28-0.19359-2.12950.01762
290.1394951.53440.063765
30-0.181046-1.99150.024339
31-0.027798-0.30580.380148
32-0.061568-0.67720.249771
33-0.020914-0.230.409221
34-0.029397-0.32340.373486
35-0.034987-0.38490.35051
360.0126860.13950.444627
37-0.11551-1.27060.103152
38-0.086091-0.9470.172763
39-0.023816-0.2620.396891
400.006690.07360.47073
41-0.007085-0.07790.469004
420.0150770.16590.434275
430.1140431.25450.106045
440.0801750.88190.189783
45-0.09152-1.00670.15804
460.0453250.49860.309493
470.056150.61770.268983
48-0.093745-1.03120.152253
49-0.003332-0.03660.485413
500.1230531.35360.089196
51-0.030986-0.34080.366905
520.0283450.31180.377867
530.0540170.59420.27675
54-0.025436-0.27980.390055
550.0513180.56450.286732
56-0.046153-0.50770.306301
57-0.027277-0.30010.382326
58-0.092544-1.0180.155358
590.0107480.11820.45304
60-0.054287-0.59720.275758


Parameters (Session):
par1 = 60 ; par2 = 1 ; par3 = 1 ; par4 = 0 ; par5 = 1 ; par6 = MA ; par7 = 0.95 ;
Parameters (R input):
par1 = 60 ; par2 = 1 ; par3 = 1 ; par4 = 0 ; par5 = 1 ; par6 = MA ; par7 = 0.95 ; par8 = ;
R code (references can be found in the software module):
par8 <- ''
par7 <- '0.95'
par6 <- 'MA'
par5 <- '1'
par4 <- '0'
par3 <- '0'
par2 <- '1'
par1 <- '60'
if (par1 == 'Default') {
par1 = 10*log10(length(x))
} else {
par1 <- as.numeric(par1)
}
par2 <- as.numeric(par2)
par3 <- as.numeric(par3)
par4 <- as.numeric(par4)
par5 <- as.numeric(par5)
if (par6 == 'White Noise') par6 <- 'white' else par6 <- 'ma'
par7 <- as.numeric(par7)
if (par8 != '') par8 <- as.numeric(par8)
ox <- x
if (par8 == '') {
if (par2 == 0) {
x <- log(x)
} else {
x <- (x ^ par2 - 1) / par2
}
} else {
x <- log(x,base=par8)
}
if (par3 > 0) x <- diff(x,lag=1,difference=par3)
if (par4 > 0) x <- diff(x,lag=par5,difference=par4)
bitmap(file='picts.png')
op <- par(mfrow=c(2,1))
plot(ox,type='l',main='Original Time Series',xlab='time',ylab='value')
if (par8=='') {
mytitle <- paste('Working Time Series (lambda=',par2,', d=',par3,', D=',par4,')',sep='')
mysub <- paste('(lambda=',par2,', d=',par3,', D=',par4,', CI=', par7, ', CI type=',par6,')',sep='')
} else {
mytitle <- paste('Working Time Series (base=',par8,', d=',par3,', D=',par4,')',sep='')
mysub <- paste('(base=',par8,', d=',par3,', D=',par4,', CI=', par7, ', CI type=',par6,')',sep='')
}
plot(x,type='l', main=mytitle,xlab='time',ylab='value')
par(op)
dev.off()
bitmap(file='pic1.png')
racf <- acf(x, par1, main='Autocorrelation', xlab='time lag', ylab='ACF', ci.type=par6, ci=par7, sub=mysub)
dev.off()
bitmap(file='pic2.png')
rpacf <- pacf(x,par1,main='Partial Autocorrelation',xlab='lags',ylab='PACF',sub=mysub)
dev.off()
(myacf <- c(racf$acf))
(mypacf <- c(rpacf$acf))
lengthx <- length(x)
sqrtn <- sqrt(lengthx)
load(file='createtable')
a<-table.start()
a<-table.row.start(a)
a<-table.element(a,'Autocorrelation Function',4,TRUE)
a<-table.row.end(a)
a<-table.row.start(a)
a<-table.element(a,'Time lag k',header=TRUE)
a<-table.element(a,hyperlink('basics.htm','ACF(k)','click here for more information about the Autocorrelation Function'),header=TRUE)
a<-table.element(a,'T-STAT',header=TRUE)
a<-table.element(a,'P-value',header=TRUE)
a<-table.row.end(a)
for (i in 2:(par1+1)) {
a<-table.row.start(a)
a<-table.element(a,i-1,header=TRUE)
a<-table.element(a,round(myacf[i],6))
mytstat <- myacf[i]*sqrtn
a<-table.element(a,round(mytstat,4))
a<-table.element(a,round(1-pt(abs(mytstat),lengthx),6))
a<-table.row.end(a)
}
a<-table.end(a)
table.save(a,file='mytable.tab')
a<-table.start()
a<-table.row.start(a)
a<-table.element(a,'Partial Autocorrelation Function',4,TRUE)
a<-table.row.end(a)
a<-table.row.start(a)
a<-table.element(a,'Time lag k',header=TRUE)
a<-table.element(a,hyperlink('basics.htm','PACF(k)','click here for more information about the Partial Autocorrelation Function'),header=TRUE)
a<-table.element(a,'T-STAT',header=TRUE)
a<-table.element(a,'P-value',header=TRUE)
a<-table.row.end(a)
for (i in 1:par1) {
a<-table.row.start(a)
a<-table.element(a,i,header=TRUE)
a<-table.element(a,round(mypacf[i],6))
mytstat <- mypacf[i]*sqrtn
a<-table.element(a,round(mytstat,4))
a<-table.element(a,round(1-pt(abs(mytstat),lengthx),6))
a<-table.row.end(a)
}
a<-table.end(a)
table.save(a,file='mytable1.tab')