Free Statistics

of Irreproducible Research!

Author's title

Author*Unverified author*
R Software Modulerwasp_autocorrelation.wasp
Title produced by software(Partial) Autocorrelation Function
Date of computationMon, 03 Mar 2014 16:09:26 -0500
Cite this page as followsStatistical Computations at FreeStatistics.org, Office for Research Development and Education, URL https://freestatistics.org/blog/index.php?v=date/2014/Mar/03/t1393881034ioslw0ua0gai488.htm/, Retrieved Tue, 14 May 2024 20:38:04 +0000
Statistical Computations at FreeStatistics.org, Office for Research Development and Education, URL https://freestatistics.org/blog/index.php?pk=234159, Retrieved Tue, 14 May 2024 20:38:04 +0000
QR Codes:

Original text written by user:Approx 2 years of data from the mid 90s relating to seasonal temperatures. Data has been smoothed.
IsPrivate?No (this computation is public)
User-defined keywords
Estimated Impact97
Family? (F = Feedback message, R = changed R code, M = changed R Module, P = changed Parameters, D = changed Data)
-       [(Partial) Autocorrelation Function] [Sydney, AU high t...] [2014-03-03 21:09:26] [d41d8cd98f00b204e9800998ecf8427e] [Current]
Feedback Forum

Post a new message
Dataseries X:
177.6
176.5285714
175.7714286
174.9857143
177.3571429
176.3714286
174.1
171.1714286
166.4571429
163.8
161.7857143
156.5142857
152.5428571
149.3142857
146.8142857
144.0571429
141.4142857
134.9571429
128.7428571
124.6571429
119.8714286
117.9857143
118.2857143
115.4142857
115.9714286
116.9714286
121.3571429
131.5714286
137.2428571
136.8714286
139.7857143
146.2
147.0714286
146.9142857
144.5857143
144.3571429
147.3571429
150.0142857
154.8571429
162.0285714
158.6142857
163.6428571
166.6
169.7571429
170.6714286
165.9714286
166.1714286
170.7857143
170.1142857
171.0857143
175.6285714
178.2
176.7285714
177.4428571
179.4142857
175.6714286
174.2571429
169.3
170.0428571
173.9428571
171.2714286
166.7714286
168.7285714
164.7
164.1
156.5142857
150.2
149.4
147.4857143
137.3571429
135.1571429
130.7428571
130.1714286
126.4
122.3428571
120.9571429
124.9857143
124.0428571
127.3
124.9714286
128.7
131.3285714
134.1285714
139.4142857
144
145.6857143
153.4428571
157.9428571
157.9
158.7857143
155.2142857
159.6
158.3714286
161.8714286
165.5857143
168.6142857
170.2428571
176.4142857
171.7285714
174.0571429
170.5714286
168.9285714
171.0857143
173.1571429
172.1857143
177.3
179.0428571
181.5571429
180.5285714
181.5714286
181.8428571
180.9142857
175.6857143
174.1
171.4428571
171.5714286
167.0571429
160.3142857
152.5285714
150.1285714
145.6571429
140.6


Summary of computational transaction
Raw Inputview raw input (R code)
Raw Outputview raw output of R engine
Computing time4 seconds
R Server'Gwilym Jenkins' @ jenkins.wessa.net

\begin{tabular}{lllllllll}
\hline
Summary of computational transaction \tabularnewline
Raw Input & view raw input (R code)  \tabularnewline
Raw Output & view raw output of R engine  \tabularnewline
Computing time & 4 seconds \tabularnewline
R Server & 'Gwilym Jenkins' @ jenkins.wessa.net \tabularnewline
\hline
\end{tabular}
%Source: https://freestatistics.org/blog/index.php?pk=234159&T=0

[TABLE]
[ROW][C]Summary of computational transaction[/C][/ROW]
[ROW][C]Raw Input[/C][C]view raw input (R code) [/C][/ROW]
[ROW][C]Raw Output[/C][C]view raw output of R engine [/C][/ROW]
[ROW][C]Computing time[/C][C]4 seconds[/C][/ROW]
[ROW][C]R Server[/C][C]'Gwilym Jenkins' @ jenkins.wessa.net[/C][/ROW]
[/TABLE]
Source: https://freestatistics.org/blog/index.php?pk=234159&T=0

Globally Unique Identifier (entire table): ba.freestatistics.org/blog/index.php?pk=234159&T=0

As an alternative you can also use a QR Code:  

The GUIDs for individual cells are displayed in the table below:

Summary of computational transaction
Raw Inputview raw input (R code)
Raw Outputview raw output of R engine
Computing time4 seconds
R Server'Gwilym Jenkins' @ jenkins.wessa.net


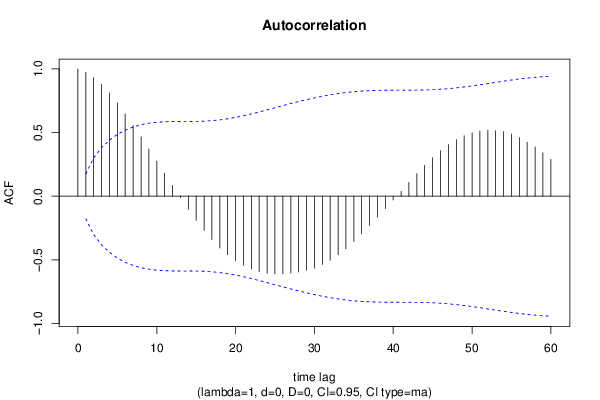
Autocorrelation Function
Time lag kACF(k)T-STATP-value
10.97310610.74830
20.93220310.29650
30.8779829.69760
40.8109848.95760
50.7325238.0910
60.6466867.14290
70.5549036.12910
80.4663445.15091e-06
90.3716824.10543.7e-05
100.2761633.05030.001402
110.1803821.99240.024281
120.0841830.92980.177149
13-0.011698-0.12920.448701
14-0.103275-1.14070.128113
15-0.188824-2.08560.019548
16-0.266912-2.94810.001916
17-0.340405-3.75990.000131
18-0.406731-4.49258e-06
19-0.460366-5.08491e-06
20-0.505235-5.58050
21-0.541862-5.98510
22-0.57082-6.30490
23-0.590828-6.52590
24-0.60495-6.68190
25-0.609867-6.73620
26-0.609542-6.73260
27-0.602553-6.65540
28-0.595133-6.57350
29-0.582191-6.43050
30-0.56472-6.23750
31-0.535245-5.9120
32-0.501849-5.54310
33-0.460173-5.08281e-06
34-0.412214-4.55316e-06
35-0.354687-3.91767.4e-05
36-0.29456-3.25350.000737
37-0.229723-2.53740.006215
38-0.164423-1.81610.035904
39-0.096377-1.06450.144597
40-0.030239-0.3340.369474
410.0393730.43490.332205
420.1083741.1970.116807
430.1777911.96380.025916
440.2425752.67930.004198
450.3018933.33450.000566
460.3573823.94746.6e-05
470.4053114.47689e-06
480.4435344.8991e-06
490.475225.2490
500.498995.51150
510.5123475.65910
520.5181535.72320
530.51515.68950
540.5063455.59280
550.4883535.3940
560.4605275.08671e-06
570.4241924.68544e-06
580.3862524.26632e-05
590.3405163.76110.000131
600.290033.20350.000866

\begin{tabular}{lllllllll}
\hline
Autocorrelation Function \tabularnewline
Time lag k & ACF(k) & T-STAT & P-value \tabularnewline
1 & 0.973106 & 10.7483 & 0 \tabularnewline
2 & 0.932203 & 10.2965 & 0 \tabularnewline
3 & 0.877982 & 9.6976 & 0 \tabularnewline
4 & 0.810984 & 8.9576 & 0 \tabularnewline
5 & 0.732523 & 8.091 & 0 \tabularnewline
6 & 0.646686 & 7.1429 & 0 \tabularnewline
7 & 0.554903 & 6.1291 & 0 \tabularnewline
8 & 0.466344 & 5.1509 & 1e-06 \tabularnewline
9 & 0.371682 & 4.1054 & 3.7e-05 \tabularnewline
10 & 0.276163 & 3.0503 & 0.001402 \tabularnewline
11 & 0.180382 & 1.9924 & 0.024281 \tabularnewline
12 & 0.084183 & 0.9298 & 0.177149 \tabularnewline
13 & -0.011698 & -0.1292 & 0.448701 \tabularnewline
14 & -0.103275 & -1.1407 & 0.128113 \tabularnewline
15 & -0.188824 & -2.0856 & 0.019548 \tabularnewline
16 & -0.266912 & -2.9481 & 0.001916 \tabularnewline
17 & -0.340405 & -3.7599 & 0.000131 \tabularnewline
18 & -0.406731 & -4.4925 & 8e-06 \tabularnewline
19 & -0.460366 & -5.0849 & 1e-06 \tabularnewline
20 & -0.505235 & -5.5805 & 0 \tabularnewline
21 & -0.541862 & -5.9851 & 0 \tabularnewline
22 & -0.57082 & -6.3049 & 0 \tabularnewline
23 & -0.590828 & -6.5259 & 0 \tabularnewline
24 & -0.60495 & -6.6819 & 0 \tabularnewline
25 & -0.609867 & -6.7362 & 0 \tabularnewline
26 & -0.609542 & -6.7326 & 0 \tabularnewline
27 & -0.602553 & -6.6554 & 0 \tabularnewline
28 & -0.595133 & -6.5735 & 0 \tabularnewline
29 & -0.582191 & -6.4305 & 0 \tabularnewline
30 & -0.56472 & -6.2375 & 0 \tabularnewline
31 & -0.535245 & -5.912 & 0 \tabularnewline
32 & -0.501849 & -5.5431 & 0 \tabularnewline
33 & -0.460173 & -5.0828 & 1e-06 \tabularnewline
34 & -0.412214 & -4.5531 & 6e-06 \tabularnewline
35 & -0.354687 & -3.9176 & 7.4e-05 \tabularnewline
36 & -0.29456 & -3.2535 & 0.000737 \tabularnewline
37 & -0.229723 & -2.5374 & 0.006215 \tabularnewline
38 & -0.164423 & -1.8161 & 0.035904 \tabularnewline
39 & -0.096377 & -1.0645 & 0.144597 \tabularnewline
40 & -0.030239 & -0.334 & 0.369474 \tabularnewline
41 & 0.039373 & 0.4349 & 0.332205 \tabularnewline
42 & 0.108374 & 1.197 & 0.116807 \tabularnewline
43 & 0.177791 & 1.9638 & 0.025916 \tabularnewline
44 & 0.242575 & 2.6793 & 0.004198 \tabularnewline
45 & 0.301893 & 3.3345 & 0.000566 \tabularnewline
46 & 0.357382 & 3.9474 & 6.6e-05 \tabularnewline
47 & 0.405311 & 4.4768 & 9e-06 \tabularnewline
48 & 0.443534 & 4.899 & 1e-06 \tabularnewline
49 & 0.47522 & 5.249 & 0 \tabularnewline
50 & 0.49899 & 5.5115 & 0 \tabularnewline
51 & 0.512347 & 5.6591 & 0 \tabularnewline
52 & 0.518153 & 5.7232 & 0 \tabularnewline
53 & 0.5151 & 5.6895 & 0 \tabularnewline
54 & 0.506345 & 5.5928 & 0 \tabularnewline
55 & 0.488353 & 5.394 & 0 \tabularnewline
56 & 0.460527 & 5.0867 & 1e-06 \tabularnewline
57 & 0.424192 & 4.6854 & 4e-06 \tabularnewline
58 & 0.386252 & 4.2663 & 2e-05 \tabularnewline
59 & 0.340516 & 3.7611 & 0.000131 \tabularnewline
60 & 0.29003 & 3.2035 & 0.000866 \tabularnewline
\hline
\end{tabular}
%Source: https://freestatistics.org/blog/index.php?pk=234159&T=1

[TABLE]
[ROW][C]Autocorrelation Function[/C][/ROW]
[ROW][C]Time lag k[/C][C]ACF(k)[/C][C]T-STAT[/C][C]P-value[/C][/ROW]
[ROW][C]1[/C][C]0.973106[/C][C]10.7483[/C][C]0[/C][/ROW]
[ROW][C]2[/C][C]0.932203[/C][C]10.2965[/C][C]0[/C][/ROW]
[ROW][C]3[/C][C]0.877982[/C][C]9.6976[/C][C]0[/C][/ROW]
[ROW][C]4[/C][C]0.810984[/C][C]8.9576[/C][C]0[/C][/ROW]
[ROW][C]5[/C][C]0.732523[/C][C]8.091[/C][C]0[/C][/ROW]
[ROW][C]6[/C][C]0.646686[/C][C]7.1429[/C][C]0[/C][/ROW]
[ROW][C]7[/C][C]0.554903[/C][C]6.1291[/C][C]0[/C][/ROW]
[ROW][C]8[/C][C]0.466344[/C][C]5.1509[/C][C]1e-06[/C][/ROW]
[ROW][C]9[/C][C]0.371682[/C][C]4.1054[/C][C]3.7e-05[/C][/ROW]
[ROW][C]10[/C][C]0.276163[/C][C]3.0503[/C][C]0.001402[/C][/ROW]
[ROW][C]11[/C][C]0.180382[/C][C]1.9924[/C][C]0.024281[/C][/ROW]
[ROW][C]12[/C][C]0.084183[/C][C]0.9298[/C][C]0.177149[/C][/ROW]
[ROW][C]13[/C][C]-0.011698[/C][C]-0.1292[/C][C]0.448701[/C][/ROW]
[ROW][C]14[/C][C]-0.103275[/C][C]-1.1407[/C][C]0.128113[/C][/ROW]
[ROW][C]15[/C][C]-0.188824[/C][C]-2.0856[/C][C]0.019548[/C][/ROW]
[ROW][C]16[/C][C]-0.266912[/C][C]-2.9481[/C][C]0.001916[/C][/ROW]
[ROW][C]17[/C][C]-0.340405[/C][C]-3.7599[/C][C]0.000131[/C][/ROW]
[ROW][C]18[/C][C]-0.406731[/C][C]-4.4925[/C][C]8e-06[/C][/ROW]
[ROW][C]19[/C][C]-0.460366[/C][C]-5.0849[/C][C]1e-06[/C][/ROW]
[ROW][C]20[/C][C]-0.505235[/C][C]-5.5805[/C][C]0[/C][/ROW]
[ROW][C]21[/C][C]-0.541862[/C][C]-5.9851[/C][C]0[/C][/ROW]
[ROW][C]22[/C][C]-0.57082[/C][C]-6.3049[/C][C]0[/C][/ROW]
[ROW][C]23[/C][C]-0.590828[/C][C]-6.5259[/C][C]0[/C][/ROW]
[ROW][C]24[/C][C]-0.60495[/C][C]-6.6819[/C][C]0[/C][/ROW]
[ROW][C]25[/C][C]-0.609867[/C][C]-6.7362[/C][C]0[/C][/ROW]
[ROW][C]26[/C][C]-0.609542[/C][C]-6.7326[/C][C]0[/C][/ROW]
[ROW][C]27[/C][C]-0.602553[/C][C]-6.6554[/C][C]0[/C][/ROW]
[ROW][C]28[/C][C]-0.595133[/C][C]-6.5735[/C][C]0[/C][/ROW]
[ROW][C]29[/C][C]-0.582191[/C][C]-6.4305[/C][C]0[/C][/ROW]
[ROW][C]30[/C][C]-0.56472[/C][C]-6.2375[/C][C]0[/C][/ROW]
[ROW][C]31[/C][C]-0.535245[/C][C]-5.912[/C][C]0[/C][/ROW]
[ROW][C]32[/C][C]-0.501849[/C][C]-5.5431[/C][C]0[/C][/ROW]
[ROW][C]33[/C][C]-0.460173[/C][C]-5.0828[/C][C]1e-06[/C][/ROW]
[ROW][C]34[/C][C]-0.412214[/C][C]-4.5531[/C][C]6e-06[/C][/ROW]
[ROW][C]35[/C][C]-0.354687[/C][C]-3.9176[/C][C]7.4e-05[/C][/ROW]
[ROW][C]36[/C][C]-0.29456[/C][C]-3.2535[/C][C]0.000737[/C][/ROW]
[ROW][C]37[/C][C]-0.229723[/C][C]-2.5374[/C][C]0.006215[/C][/ROW]
[ROW][C]38[/C][C]-0.164423[/C][C]-1.8161[/C][C]0.035904[/C][/ROW]
[ROW][C]39[/C][C]-0.096377[/C][C]-1.0645[/C][C]0.144597[/C][/ROW]
[ROW][C]40[/C][C]-0.030239[/C][C]-0.334[/C][C]0.369474[/C][/ROW]
[ROW][C]41[/C][C]0.039373[/C][C]0.4349[/C][C]0.332205[/C][/ROW]
[ROW][C]42[/C][C]0.108374[/C][C]1.197[/C][C]0.116807[/C][/ROW]
[ROW][C]43[/C][C]0.177791[/C][C]1.9638[/C][C]0.025916[/C][/ROW]
[ROW][C]44[/C][C]0.242575[/C][C]2.6793[/C][C]0.004198[/C][/ROW]
[ROW][C]45[/C][C]0.301893[/C][C]3.3345[/C][C]0.000566[/C][/ROW]
[ROW][C]46[/C][C]0.357382[/C][C]3.9474[/C][C]6.6e-05[/C][/ROW]
[ROW][C]47[/C][C]0.405311[/C][C]4.4768[/C][C]9e-06[/C][/ROW]
[ROW][C]48[/C][C]0.443534[/C][C]4.899[/C][C]1e-06[/C][/ROW]
[ROW][C]49[/C][C]0.47522[/C][C]5.249[/C][C]0[/C][/ROW]
[ROW][C]50[/C][C]0.49899[/C][C]5.5115[/C][C]0[/C][/ROW]
[ROW][C]51[/C][C]0.512347[/C][C]5.6591[/C][C]0[/C][/ROW]
[ROW][C]52[/C][C]0.518153[/C][C]5.7232[/C][C]0[/C][/ROW]
[ROW][C]53[/C][C]0.5151[/C][C]5.6895[/C][C]0[/C][/ROW]
[ROW][C]54[/C][C]0.506345[/C][C]5.5928[/C][C]0[/C][/ROW]
[ROW][C]55[/C][C]0.488353[/C][C]5.394[/C][C]0[/C][/ROW]
[ROW][C]56[/C][C]0.460527[/C][C]5.0867[/C][C]1e-06[/C][/ROW]
[ROW][C]57[/C][C]0.424192[/C][C]4.6854[/C][C]4e-06[/C][/ROW]
[ROW][C]58[/C][C]0.386252[/C][C]4.2663[/C][C]2e-05[/C][/ROW]
[ROW][C]59[/C][C]0.340516[/C][C]3.7611[/C][C]0.000131[/C][/ROW]
[ROW][C]60[/C][C]0.29003[/C][C]3.2035[/C][C]0.000866[/C][/ROW]
[/TABLE]
Source: https://freestatistics.org/blog/index.php?pk=234159&T=1

Globally Unique Identifier (entire table): ba.freestatistics.org/blog/index.php?pk=234159&T=1

As an alternative you can also use a QR Code:  

The GUIDs for individual cells are displayed in the table below:

Autocorrelation Function
Time lag kACF(k)T-STATP-value
10.97310610.74830
20.93220310.29650
30.8779829.69760
40.8109848.95760
50.7325238.0910
60.6466867.14290
70.5549036.12910
80.4663445.15091e-06
90.3716824.10543.7e-05
100.2761633.05030.001402
110.1803821.99240.024281
120.0841830.92980.177149
13-0.011698-0.12920.448701
14-0.103275-1.14070.128113
15-0.188824-2.08560.019548
16-0.266912-2.94810.001916
17-0.340405-3.75990.000131
18-0.406731-4.49258e-06
19-0.460366-5.08491e-06
20-0.505235-5.58050
21-0.541862-5.98510
22-0.57082-6.30490
23-0.590828-6.52590
24-0.60495-6.68190
25-0.609867-6.73620
26-0.609542-6.73260
27-0.602553-6.65540
28-0.595133-6.57350
29-0.582191-6.43050
30-0.56472-6.23750
31-0.535245-5.9120
32-0.501849-5.54310
33-0.460173-5.08281e-06
34-0.412214-4.55316e-06
35-0.354687-3.91767.4e-05
36-0.29456-3.25350.000737
37-0.229723-2.53740.006215
38-0.164423-1.81610.035904
39-0.096377-1.06450.144597
40-0.030239-0.3340.369474
410.0393730.43490.332205
420.1083741.1970.116807
430.1777911.96380.025916
440.2425752.67930.004198
450.3018933.33450.000566
460.3573823.94746.6e-05
470.4053114.47689e-06
480.4435344.8991e-06
490.475225.2490
500.498995.51150
510.5123475.65910
520.5181535.72320
530.51515.68950
540.5063455.59280
550.4883535.3940
560.4605275.08671e-06
570.4241924.68544e-06
580.3862524.26632e-05
590.3405163.76110.000131
600.290033.20350.000866


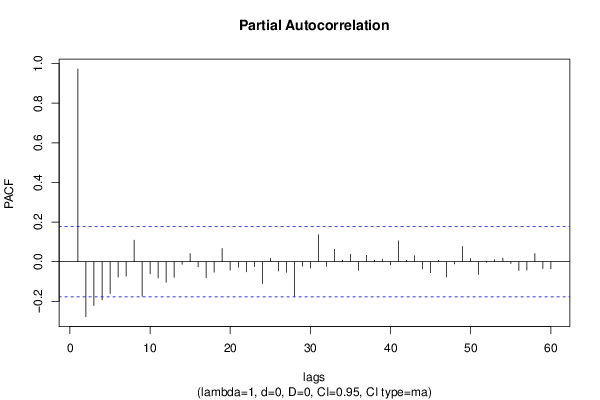
Partial Autocorrelation Function
Time lag kPACF(k)T-STATP-value
10.97310610.74830
2-0.277628-3.06650.001334
3-0.221213-2.44340.007991
4-0.192639-2.12780.017684
5-0.160963-1.77790.038956
6-0.077989-0.86140.195351
7-0.073198-0.80850.210187
80.1086651.20020.116184
9-0.174388-1.92620.028204
10-0.061208-0.67610.25014
11-0.082798-0.91450.181119
12-0.103965-1.14830.126539
13-0.079004-0.87260.19229
14-0.01304-0.1440.442857
150.0408240.45090.326427
16-0.025675-0.28360.388601
17-0.081279-0.89780.185543
18-0.052735-0.58250.280659
190.0663260.73260.232605
20-0.042849-0.47330.31843
21-0.02824-0.31190.377818
22-0.050892-0.56210.287531
23-0.024654-0.27230.392921
24-0.11005-1.21550.113253
250.0167080.18450.426947
26-0.04732-0.52270.301076
27-0.053085-0.58630.279365
28-0.174265-1.92480.02829
29-0.022743-0.25120.401038
30-0.031918-0.35250.362521
310.1362761.50520.067427
32-0.02307-0.25480.399648
330.0621090.6860.247002
340.0079190.08750.46522
350.037830.41780.338397
36-0.043532-0.48080.315749
370.0319360.35270.362445
380.0079520.08780.465076
390.0119250.13170.447711
40-0.016292-0.180.428745
410.1051141.1610.12395
420.0065550.07240.4712
430.0299290.33060.370764
44-0.03638-0.40180.344257
45-0.05525-0.61030.271415
460.0073310.0810.467799
47-0.077066-0.85120.198156
48-0.011277-0.12460.45054
490.0765520.84550.199732
500.0160030.17680.429995
51-0.064328-0.71050.239367
52-0.002852-0.03150.48746
530.0102240.11290.455139
540.0169370.18710.425955
55-0.008999-0.09940.460491
56-0.044344-0.48980.312579
57-0.042464-0.4690.319941
580.040550.44790.327515
59-0.034561-0.38170.351659
60-0.035368-0.39060.34837

\begin{tabular}{lllllllll}
\hline
Partial Autocorrelation Function \tabularnewline
Time lag k & PACF(k) & T-STAT & P-value \tabularnewline
1 & 0.973106 & 10.7483 & 0 \tabularnewline
2 & -0.277628 & -3.0665 & 0.001334 \tabularnewline
3 & -0.221213 & -2.4434 & 0.007991 \tabularnewline
4 & -0.192639 & -2.1278 & 0.017684 \tabularnewline
5 & -0.160963 & -1.7779 & 0.038956 \tabularnewline
6 & -0.077989 & -0.8614 & 0.195351 \tabularnewline
7 & -0.073198 & -0.8085 & 0.210187 \tabularnewline
8 & 0.108665 & 1.2002 & 0.116184 \tabularnewline
9 & -0.174388 & -1.9262 & 0.028204 \tabularnewline
10 & -0.061208 & -0.6761 & 0.25014 \tabularnewline
11 & -0.082798 & -0.9145 & 0.181119 \tabularnewline
12 & -0.103965 & -1.1483 & 0.126539 \tabularnewline
13 & -0.079004 & -0.8726 & 0.19229 \tabularnewline
14 & -0.01304 & -0.144 & 0.442857 \tabularnewline
15 & 0.040824 & 0.4509 & 0.326427 \tabularnewline
16 & -0.025675 & -0.2836 & 0.388601 \tabularnewline
17 & -0.081279 & -0.8978 & 0.185543 \tabularnewline
18 & -0.052735 & -0.5825 & 0.280659 \tabularnewline
19 & 0.066326 & 0.7326 & 0.232605 \tabularnewline
20 & -0.042849 & -0.4733 & 0.31843 \tabularnewline
21 & -0.02824 & -0.3119 & 0.377818 \tabularnewline
22 & -0.050892 & -0.5621 & 0.287531 \tabularnewline
23 & -0.024654 & -0.2723 & 0.392921 \tabularnewline
24 & -0.11005 & -1.2155 & 0.113253 \tabularnewline
25 & 0.016708 & 0.1845 & 0.426947 \tabularnewline
26 & -0.04732 & -0.5227 & 0.301076 \tabularnewline
27 & -0.053085 & -0.5863 & 0.279365 \tabularnewline
28 & -0.174265 & -1.9248 & 0.02829 \tabularnewline
29 & -0.022743 & -0.2512 & 0.401038 \tabularnewline
30 & -0.031918 & -0.3525 & 0.362521 \tabularnewline
31 & 0.136276 & 1.5052 & 0.067427 \tabularnewline
32 & -0.02307 & -0.2548 & 0.399648 \tabularnewline
33 & 0.062109 & 0.686 & 0.247002 \tabularnewline
34 & 0.007919 & 0.0875 & 0.46522 \tabularnewline
35 & 0.03783 & 0.4178 & 0.338397 \tabularnewline
36 & -0.043532 & -0.4808 & 0.315749 \tabularnewline
37 & 0.031936 & 0.3527 & 0.362445 \tabularnewline
38 & 0.007952 & 0.0878 & 0.465076 \tabularnewline
39 & 0.011925 & 0.1317 & 0.447711 \tabularnewline
40 & -0.016292 & -0.18 & 0.428745 \tabularnewline
41 & 0.105114 & 1.161 & 0.12395 \tabularnewline
42 & 0.006555 & 0.0724 & 0.4712 \tabularnewline
43 & 0.029929 & 0.3306 & 0.370764 \tabularnewline
44 & -0.03638 & -0.4018 & 0.344257 \tabularnewline
45 & -0.05525 & -0.6103 & 0.271415 \tabularnewline
46 & 0.007331 & 0.081 & 0.467799 \tabularnewline
47 & -0.077066 & -0.8512 & 0.198156 \tabularnewline
48 & -0.011277 & -0.1246 & 0.45054 \tabularnewline
49 & 0.076552 & 0.8455 & 0.199732 \tabularnewline
50 & 0.016003 & 0.1768 & 0.429995 \tabularnewline
51 & -0.064328 & -0.7105 & 0.239367 \tabularnewline
52 & -0.002852 & -0.0315 & 0.48746 \tabularnewline
53 & 0.010224 & 0.1129 & 0.455139 \tabularnewline
54 & 0.016937 & 0.1871 & 0.425955 \tabularnewline
55 & -0.008999 & -0.0994 & 0.460491 \tabularnewline
56 & -0.044344 & -0.4898 & 0.312579 \tabularnewline
57 & -0.042464 & -0.469 & 0.319941 \tabularnewline
58 & 0.04055 & 0.4479 & 0.327515 \tabularnewline
59 & -0.034561 & -0.3817 & 0.351659 \tabularnewline
60 & -0.035368 & -0.3906 & 0.34837 \tabularnewline
\hline
\end{tabular}
%Source: https://freestatistics.org/blog/index.php?pk=234159&T=2

[TABLE]
[ROW][C]Partial Autocorrelation Function[/C][/ROW]
[ROW][C]Time lag k[/C][C]PACF(k)[/C][C]T-STAT[/C][C]P-value[/C][/ROW]
[ROW][C]1[/C][C]0.973106[/C][C]10.7483[/C][C]0[/C][/ROW]
[ROW][C]2[/C][C]-0.277628[/C][C]-3.0665[/C][C]0.001334[/C][/ROW]
[ROW][C]3[/C][C]-0.221213[/C][C]-2.4434[/C][C]0.007991[/C][/ROW]
[ROW][C]4[/C][C]-0.192639[/C][C]-2.1278[/C][C]0.017684[/C][/ROW]
[ROW][C]5[/C][C]-0.160963[/C][C]-1.7779[/C][C]0.038956[/C][/ROW]
[ROW][C]6[/C][C]-0.077989[/C][C]-0.8614[/C][C]0.195351[/C][/ROW]
[ROW][C]7[/C][C]-0.073198[/C][C]-0.8085[/C][C]0.210187[/C][/ROW]
[ROW][C]8[/C][C]0.108665[/C][C]1.2002[/C][C]0.116184[/C][/ROW]
[ROW][C]9[/C][C]-0.174388[/C][C]-1.9262[/C][C]0.028204[/C][/ROW]
[ROW][C]10[/C][C]-0.061208[/C][C]-0.6761[/C][C]0.25014[/C][/ROW]
[ROW][C]11[/C][C]-0.082798[/C][C]-0.9145[/C][C]0.181119[/C][/ROW]
[ROW][C]12[/C][C]-0.103965[/C][C]-1.1483[/C][C]0.126539[/C][/ROW]
[ROW][C]13[/C][C]-0.079004[/C][C]-0.8726[/C][C]0.19229[/C][/ROW]
[ROW][C]14[/C][C]-0.01304[/C][C]-0.144[/C][C]0.442857[/C][/ROW]
[ROW][C]15[/C][C]0.040824[/C][C]0.4509[/C][C]0.326427[/C][/ROW]
[ROW][C]16[/C][C]-0.025675[/C][C]-0.2836[/C][C]0.388601[/C][/ROW]
[ROW][C]17[/C][C]-0.081279[/C][C]-0.8978[/C][C]0.185543[/C][/ROW]
[ROW][C]18[/C][C]-0.052735[/C][C]-0.5825[/C][C]0.280659[/C][/ROW]
[ROW][C]19[/C][C]0.066326[/C][C]0.7326[/C][C]0.232605[/C][/ROW]
[ROW][C]20[/C][C]-0.042849[/C][C]-0.4733[/C][C]0.31843[/C][/ROW]
[ROW][C]21[/C][C]-0.02824[/C][C]-0.3119[/C][C]0.377818[/C][/ROW]
[ROW][C]22[/C][C]-0.050892[/C][C]-0.5621[/C][C]0.287531[/C][/ROW]
[ROW][C]23[/C][C]-0.024654[/C][C]-0.2723[/C][C]0.392921[/C][/ROW]
[ROW][C]24[/C][C]-0.11005[/C][C]-1.2155[/C][C]0.113253[/C][/ROW]
[ROW][C]25[/C][C]0.016708[/C][C]0.1845[/C][C]0.426947[/C][/ROW]
[ROW][C]26[/C][C]-0.04732[/C][C]-0.5227[/C][C]0.301076[/C][/ROW]
[ROW][C]27[/C][C]-0.053085[/C][C]-0.5863[/C][C]0.279365[/C][/ROW]
[ROW][C]28[/C][C]-0.174265[/C][C]-1.9248[/C][C]0.02829[/C][/ROW]
[ROW][C]29[/C][C]-0.022743[/C][C]-0.2512[/C][C]0.401038[/C][/ROW]
[ROW][C]30[/C][C]-0.031918[/C][C]-0.3525[/C][C]0.362521[/C][/ROW]
[ROW][C]31[/C][C]0.136276[/C][C]1.5052[/C][C]0.067427[/C][/ROW]
[ROW][C]32[/C][C]-0.02307[/C][C]-0.2548[/C][C]0.399648[/C][/ROW]
[ROW][C]33[/C][C]0.062109[/C][C]0.686[/C][C]0.247002[/C][/ROW]
[ROW][C]34[/C][C]0.007919[/C][C]0.0875[/C][C]0.46522[/C][/ROW]
[ROW][C]35[/C][C]0.03783[/C][C]0.4178[/C][C]0.338397[/C][/ROW]
[ROW][C]36[/C][C]-0.043532[/C][C]-0.4808[/C][C]0.315749[/C][/ROW]
[ROW][C]37[/C][C]0.031936[/C][C]0.3527[/C][C]0.362445[/C][/ROW]
[ROW][C]38[/C][C]0.007952[/C][C]0.0878[/C][C]0.465076[/C][/ROW]
[ROW][C]39[/C][C]0.011925[/C][C]0.1317[/C][C]0.447711[/C][/ROW]
[ROW][C]40[/C][C]-0.016292[/C][C]-0.18[/C][C]0.428745[/C][/ROW]
[ROW][C]41[/C][C]0.105114[/C][C]1.161[/C][C]0.12395[/C][/ROW]
[ROW][C]42[/C][C]0.006555[/C][C]0.0724[/C][C]0.4712[/C][/ROW]
[ROW][C]43[/C][C]0.029929[/C][C]0.3306[/C][C]0.370764[/C][/ROW]
[ROW][C]44[/C][C]-0.03638[/C][C]-0.4018[/C][C]0.344257[/C][/ROW]
[ROW][C]45[/C][C]-0.05525[/C][C]-0.6103[/C][C]0.271415[/C][/ROW]
[ROW][C]46[/C][C]0.007331[/C][C]0.081[/C][C]0.467799[/C][/ROW]
[ROW][C]47[/C][C]-0.077066[/C][C]-0.8512[/C][C]0.198156[/C][/ROW]
[ROW][C]48[/C][C]-0.011277[/C][C]-0.1246[/C][C]0.45054[/C][/ROW]
[ROW][C]49[/C][C]0.076552[/C][C]0.8455[/C][C]0.199732[/C][/ROW]
[ROW][C]50[/C][C]0.016003[/C][C]0.1768[/C][C]0.429995[/C][/ROW]
[ROW][C]51[/C][C]-0.064328[/C][C]-0.7105[/C][C]0.239367[/C][/ROW]
[ROW][C]52[/C][C]-0.002852[/C][C]-0.0315[/C][C]0.48746[/C][/ROW]
[ROW][C]53[/C][C]0.010224[/C][C]0.1129[/C][C]0.455139[/C][/ROW]
[ROW][C]54[/C][C]0.016937[/C][C]0.1871[/C][C]0.425955[/C][/ROW]
[ROW][C]55[/C][C]-0.008999[/C][C]-0.0994[/C][C]0.460491[/C][/ROW]
[ROW][C]56[/C][C]-0.044344[/C][C]-0.4898[/C][C]0.312579[/C][/ROW]
[ROW][C]57[/C][C]-0.042464[/C][C]-0.469[/C][C]0.319941[/C][/ROW]
[ROW][C]58[/C][C]0.04055[/C][C]0.4479[/C][C]0.327515[/C][/ROW]
[ROW][C]59[/C][C]-0.034561[/C][C]-0.3817[/C][C]0.351659[/C][/ROW]
[ROW][C]60[/C][C]-0.035368[/C][C]-0.3906[/C][C]0.34837[/C][/ROW]
[/TABLE]
Source: https://freestatistics.org/blog/index.php?pk=234159&T=2

Globally Unique Identifier (entire table): ba.freestatistics.org/blog/index.php?pk=234159&T=2

As an alternative you can also use a QR Code:  

The GUIDs for individual cells are displayed in the table below:

Partial Autocorrelation Function
Time lag kPACF(k)T-STATP-value
10.97310610.74830
2-0.277628-3.06650.001334
3-0.221213-2.44340.007991
4-0.192639-2.12780.017684
5-0.160963-1.77790.038956
6-0.077989-0.86140.195351
7-0.073198-0.80850.210187
80.1086651.20020.116184
9-0.174388-1.92620.028204
10-0.061208-0.67610.25014
11-0.082798-0.91450.181119
12-0.103965-1.14830.126539
13-0.079004-0.87260.19229
14-0.01304-0.1440.442857
150.0408240.45090.326427
16-0.025675-0.28360.388601
17-0.081279-0.89780.185543
18-0.052735-0.58250.280659
190.0663260.73260.232605
20-0.042849-0.47330.31843
21-0.02824-0.31190.377818
22-0.050892-0.56210.287531
23-0.024654-0.27230.392921
24-0.11005-1.21550.113253
250.0167080.18450.426947
26-0.04732-0.52270.301076
27-0.053085-0.58630.279365
28-0.174265-1.92480.02829
29-0.022743-0.25120.401038
30-0.031918-0.35250.362521
310.1362761.50520.067427
32-0.02307-0.25480.399648
330.0621090.6860.247002
340.0079190.08750.46522
350.037830.41780.338397
36-0.043532-0.48080.315749
370.0319360.35270.362445
380.0079520.08780.465076
390.0119250.13170.447711
40-0.016292-0.180.428745
410.1051141.1610.12395
420.0065550.07240.4712
430.0299290.33060.370764
44-0.03638-0.40180.344257
45-0.05525-0.61030.271415
460.0073310.0810.467799
47-0.077066-0.85120.198156
48-0.011277-0.12460.45054
490.0765520.84550.199732
500.0160030.17680.429995
51-0.064328-0.71050.239367
52-0.002852-0.03150.48746
530.0102240.11290.455139
540.0169370.18710.425955
55-0.008999-0.09940.460491
56-0.044344-0.48980.312579
57-0.042464-0.4690.319941
580.040550.44790.327515
59-0.034561-0.38170.351659
60-0.035368-0.39060.34837


Parameters (Session):
par1 = 60 ; par2 = 1 ; par3 = 0 ; par4 = 0 ; par5 = 1 ; par6 = MA ; par7 = 0.95 ;
Parameters (R input):
par1 = 60 ; par2 = 1 ; par3 = 0 ; par4 = 0 ; par5 = 1 ; par6 = MA ; par7 = 0.95 ; par8 = ;
R code (references can be found in the software module):
par8 <- ''
par7 <- '0.95'
par6 <- 'MA'
par5 <- '1'
par4 <- '0'
par3 <- '0'
par2 <- '1'
par1 <- '60'
if (par1 == 'Default') {
par1 = 10*log10(length(x))
} else {
par1 <- as.numeric(par1)
}
par2 <- as.numeric(par2)
par3 <- as.numeric(par3)
par4 <- as.numeric(par4)
par5 <- as.numeric(par5)
if (par6 == 'White Noise') par6 <- 'white' else par6 <- 'ma'
par7 <- as.numeric(par7)
if (par8 != '') par8 <- as.numeric(par8)
ox <- x
if (par8 == '') {
if (par2 == 0) {
x <- log(x)
} else {
x <- (x ^ par2 - 1) / par2
}
} else {
x <- log(x,base=par8)
}
if (par3 > 0) x <- diff(x,lag=1,difference=par3)
if (par4 > 0) x <- diff(x,lag=par5,difference=par4)
bitmap(file='picts.png')
op <- par(mfrow=c(2,1))
plot(ox,type='l',main='Original Time Series',xlab='time',ylab='value')
if (par8=='') {
mytitle <- paste('Working Time Series (lambda=',par2,', d=',par3,', D=',par4,')',sep='')
mysub <- paste('(lambda=',par2,', d=',par3,', D=',par4,', CI=', par7, ', CI type=',par6,')',sep='')
} else {
mytitle <- paste('Working Time Series (base=',par8,', d=',par3,', D=',par4,')',sep='')
mysub <- paste('(base=',par8,', d=',par3,', D=',par4,', CI=', par7, ', CI type=',par6,')',sep='')
}
plot(x,type='l', main=mytitle,xlab='time',ylab='value')
par(op)
dev.off()
bitmap(file='pic1.png')
racf <- acf(x, par1, main='Autocorrelation', xlab='time lag', ylab='ACF', ci.type=par6, ci=par7, sub=mysub)
dev.off()
bitmap(file='pic2.png')
rpacf <- pacf(x,par1,main='Partial Autocorrelation',xlab='lags',ylab='PACF',sub=mysub)
dev.off()
(myacf <- c(racf$acf))
(mypacf <- c(rpacf$acf))
lengthx <- length(x)
sqrtn <- sqrt(lengthx)
load(file='createtable')
a<-table.start()
a<-table.row.start(a)
a<-table.element(a,'Autocorrelation Function',4,TRUE)
a<-table.row.end(a)
a<-table.row.start(a)
a<-table.element(a,'Time lag k',header=TRUE)
a<-table.element(a,hyperlink('basics.htm','ACF(k)','click here for more information about the Autocorrelation Function'),header=TRUE)
a<-table.element(a,'T-STAT',header=TRUE)
a<-table.element(a,'P-value',header=TRUE)
a<-table.row.end(a)
for (i in 2:(par1+1)) {
a<-table.row.start(a)
a<-table.element(a,i-1,header=TRUE)
a<-table.element(a,round(myacf[i],6))
mytstat <- myacf[i]*sqrtn
a<-table.element(a,round(mytstat,4))
a<-table.element(a,round(1-pt(abs(mytstat),lengthx),6))
a<-table.row.end(a)
}
a<-table.end(a)
table.save(a,file='mytable.tab')
a<-table.start()
a<-table.row.start(a)
a<-table.element(a,'Partial Autocorrelation Function',4,TRUE)
a<-table.row.end(a)
a<-table.row.start(a)
a<-table.element(a,'Time lag k',header=TRUE)
a<-table.element(a,hyperlink('basics.htm','PACF(k)','click here for more information about the Partial Autocorrelation Function'),header=TRUE)
a<-table.element(a,'T-STAT',header=TRUE)
a<-table.element(a,'P-value',header=TRUE)
a<-table.row.end(a)
for (i in 1:par1) {
a<-table.row.start(a)
a<-table.element(a,i,header=TRUE)
a<-table.element(a,round(mypacf[i],6))
mytstat <- mypacf[i]*sqrtn
a<-table.element(a,round(mytstat,4))
a<-table.element(a,round(1-pt(abs(mytstat),lengthx),6))
a<-table.row.end(a)
}
a<-table.end(a)
table.save(a,file='mytable1.tab')