Free Statistics

of Irreproducible Research!

Author's title

Author*Unverified author*
R Software Modulerwasp_autocorrelation.wasp
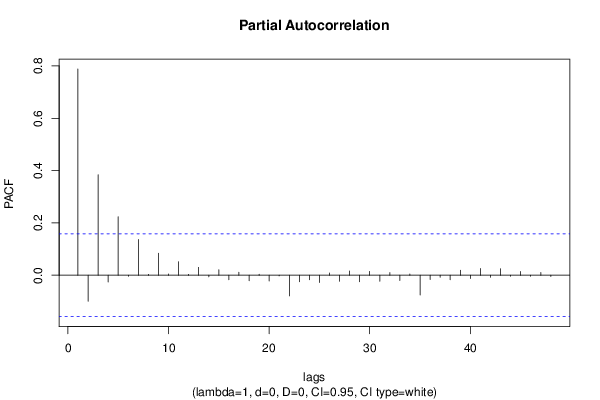
Title produced by software(Partial) Autocorrelation Function
Date of computationSun, 12 Jan 2014 20:03:57 -0500
Cite this page as followsStatistical Computations at FreeStatistics.org, Office for Research Development and Education, URL https://freestatistics.org/blog/index.php?v=date/2014/Jan/12/t1389575165ozc48qmzo1j9mda.htm/, Retrieved Sun, 19 May 2024 09:22:39 +0000
Statistical Computations at FreeStatistics.org, Office for Research Development and Education, URL https://freestatistics.org/blog/index.php?pk=233097, Retrieved Sun, 19 May 2024 09:22:39 +0000
QR Codes:

Original text written by user:
IsPrivate?No (this computation is public)
User-defined keywordsKarel De Grote-Hogeschool Valérie Weyts
Estimated Impact89
Family? (F = Feedback message, R = changed R code, M = changed R Module, P = changed Parameters, D = changed Data)
-       [(Partial) Autocorrelation Function] [Autocorrelation] [2014-01-13 01:03:57] [feb2df3f24188fb89c42f3077ec68a56] [Current]
Feedback Forum

Post a new message
Dataseries X:
80
80
80
80
80
80
80
80
80
80
80
80
80
80
85
85
85
85
85
85
85
85
85
85
85
85
85
85
85
85
85
85
85
85
85
85
90
90
90
90
90
90
90
90
90
90
90
90
90
90
90
90
90
90
90
90
90
90
90
90
90
90
90
90
90
90
90
90
90
90
90
90
90
90
90
90
90
90
90
90
90
90
90
90
90
90
90
90
90
90
90
90
90
90
90
90
90
90
90
90
90
90
100
100
100
100
100
100
100
100
100
100
100
100
100
100
100
110
110
110
110
110
110
110
110
110
110
110
110
110
120
120
120
120
120
120
120
120
120
120
120
120
120
120
120
120
120
120
120
120
120
200
210


Summary of computational transaction
Raw Inputview raw input (R code)
Raw Outputview raw output of R engine
Computing time3 seconds
R Server'Herman Ole Andreas Wold' @ wold.wessa.net

\begin{tabular}{lllllllll}
\hline
Summary of computational transaction \tabularnewline
Raw Input & view raw input (R code)  \tabularnewline
Raw Output & view raw output of R engine  \tabularnewline
Computing time & 3 seconds \tabularnewline
R Server & 'Herman Ole Andreas Wold' @ wold.wessa.net \tabularnewline
\hline
\end{tabular}
%Source: https://freestatistics.org/blog/index.php?pk=233097&T=0

[TABLE]
[ROW][C]Summary of computational transaction[/C][/ROW]
[ROW][C]Raw Input[/C][C]view raw input (R code) [/C][/ROW]
[ROW][C]Raw Output[/C][C]view raw output of R engine [/C][/ROW]
[ROW][C]Computing time[/C][C]3 seconds[/C][/ROW]
[ROW][C]R Server[/C][C]'Herman Ole Andreas Wold' @ wold.wessa.net[/C][/ROW]
[/TABLE]
Source: https://freestatistics.org/blog/index.php?pk=233097&T=0

Globally Unique Identifier (entire table): ba.freestatistics.org/blog/index.php?pk=233097&T=0

As an alternative you can also use a QR Code:  

The GUIDs for individual cells are displayed in the table below:

Summary of computational transaction
Raw Inputview raw input (R code)
Raw Outputview raw output of R engine
Computing time3 seconds
R Server'Herman Ole Andreas Wold' @ wold.wessa.net


Autocorrelation Function
Time lag kACF(k)T-STATP-value
10.7886549.75510
20.5843627.22820
30.5719587.07470
40.5595536.92130
50.5471496.76790
60.5347446.61440
70.522346.4610
80.5099356.30760
90.4975316.15410
100.4851266.00070
110.4727225.84720
120.4603175.69380
130.4479135.54040
140.4333925.36080
150.4206355.2030
160.4057615.0191e-06
170.3908884.8352e-06
180.3760144.6514e-06
190.3611414.46718e-06
200.3462674.28311.6e-05
210.3313934.09913.4e-05
220.2995883.70570.000147
230.2651383.27960.000644
240.2546743.15010.000982
250.2442093.02070.001478
260.2337452.89130.002198
270.223282.76180.003226
280.2128162.63240.004674
290.2002352.47680.007173
300.1876542.32120.010799
310.1750732.16550.015948
320.1624932.00990.023098
330.1499121.85430.03281
340.1373311.69870.045705
350.1078191.33360.092151
360.076190.94240.173731
370.0703120.86970.192912
380.0644330.7970.213346
390.0585540.72430.235003
400.0526750.65160.257834
410.0467960.57880.281776
420.0409170.50610.306752
430.0350380.43340.332668
440.0291590.36070.359418
450.023280.2880.386882
460.0174020.21520.414931
470.0115230.14250.443426
480.0056440.06980.472218

\begin{tabular}{lllllllll}
\hline
Autocorrelation Function \tabularnewline
Time lag k & ACF(k) & T-STAT & P-value \tabularnewline
1 & 0.788654 & 9.7551 & 0 \tabularnewline
2 & 0.584362 & 7.2282 & 0 \tabularnewline
3 & 0.571958 & 7.0747 & 0 \tabularnewline
4 & 0.559553 & 6.9213 & 0 \tabularnewline
5 & 0.547149 & 6.7679 & 0 \tabularnewline
6 & 0.534744 & 6.6144 & 0 \tabularnewline
7 & 0.52234 & 6.461 & 0 \tabularnewline
8 & 0.509935 & 6.3076 & 0 \tabularnewline
9 & 0.497531 & 6.1541 & 0 \tabularnewline
10 & 0.485126 & 6.0007 & 0 \tabularnewline
11 & 0.472722 & 5.8472 & 0 \tabularnewline
12 & 0.460317 & 5.6938 & 0 \tabularnewline
13 & 0.447913 & 5.5404 & 0 \tabularnewline
14 & 0.433392 & 5.3608 & 0 \tabularnewline
15 & 0.420635 & 5.203 & 0 \tabularnewline
16 & 0.405761 & 5.019 & 1e-06 \tabularnewline
17 & 0.390888 & 4.835 & 2e-06 \tabularnewline
18 & 0.376014 & 4.651 & 4e-06 \tabularnewline
19 & 0.361141 & 4.4671 & 8e-06 \tabularnewline
20 & 0.346267 & 4.2831 & 1.6e-05 \tabularnewline
21 & 0.331393 & 4.0991 & 3.4e-05 \tabularnewline
22 & 0.299588 & 3.7057 & 0.000147 \tabularnewline
23 & 0.265138 & 3.2796 & 0.000644 \tabularnewline
24 & 0.254674 & 3.1501 & 0.000982 \tabularnewline
25 & 0.244209 & 3.0207 & 0.001478 \tabularnewline
26 & 0.233745 & 2.8913 & 0.002198 \tabularnewline
27 & 0.22328 & 2.7618 & 0.003226 \tabularnewline
28 & 0.212816 & 2.6324 & 0.004674 \tabularnewline
29 & 0.200235 & 2.4768 & 0.007173 \tabularnewline
30 & 0.187654 & 2.3212 & 0.010799 \tabularnewline
31 & 0.175073 & 2.1655 & 0.015948 \tabularnewline
32 & 0.162493 & 2.0099 & 0.023098 \tabularnewline
33 & 0.149912 & 1.8543 & 0.03281 \tabularnewline
34 & 0.137331 & 1.6987 & 0.045705 \tabularnewline
35 & 0.107819 & 1.3336 & 0.092151 \tabularnewline
36 & 0.07619 & 0.9424 & 0.173731 \tabularnewline
37 & 0.070312 & 0.8697 & 0.192912 \tabularnewline
38 & 0.064433 & 0.797 & 0.213346 \tabularnewline
39 & 0.058554 & 0.7243 & 0.235003 \tabularnewline
40 & 0.052675 & 0.6516 & 0.257834 \tabularnewline
41 & 0.046796 & 0.5788 & 0.281776 \tabularnewline
42 & 0.040917 & 0.5061 & 0.306752 \tabularnewline
43 & 0.035038 & 0.4334 & 0.332668 \tabularnewline
44 & 0.029159 & 0.3607 & 0.359418 \tabularnewline
45 & 0.02328 & 0.288 & 0.386882 \tabularnewline
46 & 0.017402 & 0.2152 & 0.414931 \tabularnewline
47 & 0.011523 & 0.1425 & 0.443426 \tabularnewline
48 & 0.005644 & 0.0698 & 0.472218 \tabularnewline
\hline
\end{tabular}
%Source: https://freestatistics.org/blog/index.php?pk=233097&T=1

[TABLE]
[ROW][C]Autocorrelation Function[/C][/ROW]
[ROW][C]Time lag k[/C][C]ACF(k)[/C][C]T-STAT[/C][C]P-value[/C][/ROW]
[ROW][C]1[/C][C]0.788654[/C][C]9.7551[/C][C]0[/C][/ROW]
[ROW][C]2[/C][C]0.584362[/C][C]7.2282[/C][C]0[/C][/ROW]
[ROW][C]3[/C][C]0.571958[/C][C]7.0747[/C][C]0[/C][/ROW]
[ROW][C]4[/C][C]0.559553[/C][C]6.9213[/C][C]0[/C][/ROW]
[ROW][C]5[/C][C]0.547149[/C][C]6.7679[/C][C]0[/C][/ROW]
[ROW][C]6[/C][C]0.534744[/C][C]6.6144[/C][C]0[/C][/ROW]
[ROW][C]7[/C][C]0.52234[/C][C]6.461[/C][C]0[/C][/ROW]
[ROW][C]8[/C][C]0.509935[/C][C]6.3076[/C][C]0[/C][/ROW]
[ROW][C]9[/C][C]0.497531[/C][C]6.1541[/C][C]0[/C][/ROW]
[ROW][C]10[/C][C]0.485126[/C][C]6.0007[/C][C]0[/C][/ROW]
[ROW][C]11[/C][C]0.472722[/C][C]5.8472[/C][C]0[/C][/ROW]
[ROW][C]12[/C][C]0.460317[/C][C]5.6938[/C][C]0[/C][/ROW]
[ROW][C]13[/C][C]0.447913[/C][C]5.5404[/C][C]0[/C][/ROW]
[ROW][C]14[/C][C]0.433392[/C][C]5.3608[/C][C]0[/C][/ROW]
[ROW][C]15[/C][C]0.420635[/C][C]5.203[/C][C]0[/C][/ROW]
[ROW][C]16[/C][C]0.405761[/C][C]5.019[/C][C]1e-06[/C][/ROW]
[ROW][C]17[/C][C]0.390888[/C][C]4.835[/C][C]2e-06[/C][/ROW]
[ROW][C]18[/C][C]0.376014[/C][C]4.651[/C][C]4e-06[/C][/ROW]
[ROW][C]19[/C][C]0.361141[/C][C]4.4671[/C][C]8e-06[/C][/ROW]
[ROW][C]20[/C][C]0.346267[/C][C]4.2831[/C][C]1.6e-05[/C][/ROW]
[ROW][C]21[/C][C]0.331393[/C][C]4.0991[/C][C]3.4e-05[/C][/ROW]
[ROW][C]22[/C][C]0.299588[/C][C]3.7057[/C][C]0.000147[/C][/ROW]
[ROW][C]23[/C][C]0.265138[/C][C]3.2796[/C][C]0.000644[/C][/ROW]
[ROW][C]24[/C][C]0.254674[/C][C]3.1501[/C][C]0.000982[/C][/ROW]
[ROW][C]25[/C][C]0.244209[/C][C]3.0207[/C][C]0.001478[/C][/ROW]
[ROW][C]26[/C][C]0.233745[/C][C]2.8913[/C][C]0.002198[/C][/ROW]
[ROW][C]27[/C][C]0.22328[/C][C]2.7618[/C][C]0.003226[/C][/ROW]
[ROW][C]28[/C][C]0.212816[/C][C]2.6324[/C][C]0.004674[/C][/ROW]
[ROW][C]29[/C][C]0.200235[/C][C]2.4768[/C][C]0.007173[/C][/ROW]
[ROW][C]30[/C][C]0.187654[/C][C]2.3212[/C][C]0.010799[/C][/ROW]
[ROW][C]31[/C][C]0.175073[/C][C]2.1655[/C][C]0.015948[/C][/ROW]
[ROW][C]32[/C][C]0.162493[/C][C]2.0099[/C][C]0.023098[/C][/ROW]
[ROW][C]33[/C][C]0.149912[/C][C]1.8543[/C][C]0.03281[/C][/ROW]
[ROW][C]34[/C][C]0.137331[/C][C]1.6987[/C][C]0.045705[/C][/ROW]
[ROW][C]35[/C][C]0.107819[/C][C]1.3336[/C][C]0.092151[/C][/ROW]
[ROW][C]36[/C][C]0.07619[/C][C]0.9424[/C][C]0.173731[/C][/ROW]
[ROW][C]37[/C][C]0.070312[/C][C]0.8697[/C][C]0.192912[/C][/ROW]
[ROW][C]38[/C][C]0.064433[/C][C]0.797[/C][C]0.213346[/C][/ROW]
[ROW][C]39[/C][C]0.058554[/C][C]0.7243[/C][C]0.235003[/C][/ROW]
[ROW][C]40[/C][C]0.052675[/C][C]0.6516[/C][C]0.257834[/C][/ROW]
[ROW][C]41[/C][C]0.046796[/C][C]0.5788[/C][C]0.281776[/C][/ROW]
[ROW][C]42[/C][C]0.040917[/C][C]0.5061[/C][C]0.306752[/C][/ROW]
[ROW][C]43[/C][C]0.035038[/C][C]0.4334[/C][C]0.332668[/C][/ROW]
[ROW][C]44[/C][C]0.029159[/C][C]0.3607[/C][C]0.359418[/C][/ROW]
[ROW][C]45[/C][C]0.02328[/C][C]0.288[/C][C]0.386882[/C][/ROW]
[ROW][C]46[/C][C]0.017402[/C][C]0.2152[/C][C]0.414931[/C][/ROW]
[ROW][C]47[/C][C]0.011523[/C][C]0.1425[/C][C]0.443426[/C][/ROW]
[ROW][C]48[/C][C]0.005644[/C][C]0.0698[/C][C]0.472218[/C][/ROW]
[/TABLE]
Source: https://freestatistics.org/blog/index.php?pk=233097&T=1

Globally Unique Identifier (entire table): ba.freestatistics.org/blog/index.php?pk=233097&T=1

As an alternative you can also use a QR Code:  

The GUIDs for individual cells are displayed in the table below:

Autocorrelation Function
Time lag kACF(k)T-STATP-value
10.7886549.75510
20.5843627.22820
30.5719587.07470
40.5595536.92130
50.5471496.76790
60.5347446.61440
70.522346.4610
80.5099356.30760
90.4975316.15410
100.4851266.00070
110.4727225.84720
120.4603175.69380
130.4479135.54040
140.4333925.36080
150.4206355.2030
160.4057615.0191e-06
170.3908884.8352e-06
180.3760144.6514e-06
190.3611414.46718e-06
200.3462674.28311.6e-05
210.3313934.09913.4e-05
220.2995883.70570.000147
230.2651383.27960.000644
240.2546743.15010.000982
250.2442093.02070.001478
260.2337452.89130.002198
270.223282.76180.003226
280.2128162.63240.004674
290.2002352.47680.007173
300.1876542.32120.010799
310.1750732.16550.015948
320.1624932.00990.023098
330.1499121.85430.03281
340.1373311.69870.045705
350.1078191.33360.092151
360.076190.94240.173731
370.0703120.86970.192912
380.0644330.7970.213346
390.0585540.72430.235003
400.0526750.65160.257834
410.0467960.57880.281776
420.0409170.50610.306752
430.0350380.43340.332668
440.0291590.36070.359418
450.023280.2880.386882
460.0174020.21520.414931
470.0115230.14250.443426
480.0056440.06980.472218


Partial Autocorrelation Function
Time lag kPACF(k)T-STATP-value
10.7886549.75510
2-0.099497-1.23070.110159
30.3839694.74942e-06
4-0.026227-0.32440.373037
50.2232642.76160.003228
6-0.00412-0.0510.479709
70.1364071.68730.046795
80.0033010.04080.483744
90.0841581.0410.149763
100.0046120.0570.47729
110.0512660.63410.263472
120.0032590.04030.483947
130.0300730.3720.355212
14-0.006279-0.07770.469099
150.0210730.26070.397354
16-0.017428-0.21560.414804
170.0116020.14350.443039
18-0.021306-0.26350.396245
190.0036010.04450.482265
20-0.021952-0.27150.393174
21-0.002514-0.03110.487617
22-0.07901-0.97730.164983
23-0.025053-0.30990.378534
24-0.017267-0.21360.415579
25-0.027665-0.34220.366336
260.0082210.10170.459568
27-0.023348-0.28880.386565
280.0159940.19780.42172
29-0.025062-0.310.378493
300.0145650.18020.428635
31-0.022985-0.28430.388278
320.0099250.12280.451226
33-0.020098-0.24860.402
340.0047240.05840.476739
35-0.075813-0.93780.174925
36-0.01642-0.20310.419663
37-0.007935-0.09810.460971
38-0.017567-0.21730.414134
390.0188290.23290.408075
40-0.012834-0.15880.437038
410.0259940.32150.374125
42-0.0078-0.09650.461635
430.0245030.30310.38112
44-0.004132-0.05110.479652
450.014520.17960.428849
46-0.004259-0.05270.47903
470.0100830.12470.450456
48-0.005017-0.06210.475301

\begin{tabular}{lllllllll}
\hline
Partial Autocorrelation Function \tabularnewline
Time lag k & PACF(k) & T-STAT & P-value \tabularnewline
1 & 0.788654 & 9.7551 & 0 \tabularnewline
2 & -0.099497 & -1.2307 & 0.110159 \tabularnewline
3 & 0.383969 & 4.7494 & 2e-06 \tabularnewline
4 & -0.026227 & -0.3244 & 0.373037 \tabularnewline
5 & 0.223264 & 2.7616 & 0.003228 \tabularnewline
6 & -0.00412 & -0.051 & 0.479709 \tabularnewline
7 & 0.136407 & 1.6873 & 0.046795 \tabularnewline
8 & 0.003301 & 0.0408 & 0.483744 \tabularnewline
9 & 0.084158 & 1.041 & 0.149763 \tabularnewline
10 & 0.004612 & 0.057 & 0.47729 \tabularnewline
11 & 0.051266 & 0.6341 & 0.263472 \tabularnewline
12 & 0.003259 & 0.0403 & 0.483947 \tabularnewline
13 & 0.030073 & 0.372 & 0.355212 \tabularnewline
14 & -0.006279 & -0.0777 & 0.469099 \tabularnewline
15 & 0.021073 & 0.2607 & 0.397354 \tabularnewline
16 & -0.017428 & -0.2156 & 0.414804 \tabularnewline
17 & 0.011602 & 0.1435 & 0.443039 \tabularnewline
18 & -0.021306 & -0.2635 & 0.396245 \tabularnewline
19 & 0.003601 & 0.0445 & 0.482265 \tabularnewline
20 & -0.021952 & -0.2715 & 0.393174 \tabularnewline
21 & -0.002514 & -0.0311 & 0.487617 \tabularnewline
22 & -0.07901 & -0.9773 & 0.164983 \tabularnewline
23 & -0.025053 & -0.3099 & 0.378534 \tabularnewline
24 & -0.017267 & -0.2136 & 0.415579 \tabularnewline
25 & -0.027665 & -0.3422 & 0.366336 \tabularnewline
26 & 0.008221 & 0.1017 & 0.459568 \tabularnewline
27 & -0.023348 & -0.2888 & 0.386565 \tabularnewline
28 & 0.015994 & 0.1978 & 0.42172 \tabularnewline
29 & -0.025062 & -0.31 & 0.378493 \tabularnewline
30 & 0.014565 & 0.1802 & 0.428635 \tabularnewline
31 & -0.022985 & -0.2843 & 0.388278 \tabularnewline
32 & 0.009925 & 0.1228 & 0.451226 \tabularnewline
33 & -0.020098 & -0.2486 & 0.402 \tabularnewline
34 & 0.004724 & 0.0584 & 0.476739 \tabularnewline
35 & -0.075813 & -0.9378 & 0.174925 \tabularnewline
36 & -0.01642 & -0.2031 & 0.419663 \tabularnewline
37 & -0.007935 & -0.0981 & 0.460971 \tabularnewline
38 & -0.017567 & -0.2173 & 0.414134 \tabularnewline
39 & 0.018829 & 0.2329 & 0.408075 \tabularnewline
40 & -0.012834 & -0.1588 & 0.437038 \tabularnewline
41 & 0.025994 & 0.3215 & 0.374125 \tabularnewline
42 & -0.0078 & -0.0965 & 0.461635 \tabularnewline
43 & 0.024503 & 0.3031 & 0.38112 \tabularnewline
44 & -0.004132 & -0.0511 & 0.479652 \tabularnewline
45 & 0.01452 & 0.1796 & 0.428849 \tabularnewline
46 & -0.004259 & -0.0527 & 0.47903 \tabularnewline
47 & 0.010083 & 0.1247 & 0.450456 \tabularnewline
48 & -0.005017 & -0.0621 & 0.475301 \tabularnewline
\hline
\end{tabular}
%Source: https://freestatistics.org/blog/index.php?pk=233097&T=2

[TABLE]
[ROW][C]Partial Autocorrelation Function[/C][/ROW]
[ROW][C]Time lag k[/C][C]PACF(k)[/C][C]T-STAT[/C][C]P-value[/C][/ROW]
[ROW][C]1[/C][C]0.788654[/C][C]9.7551[/C][C]0[/C][/ROW]
[ROW][C]2[/C][C]-0.099497[/C][C]-1.2307[/C][C]0.110159[/C][/ROW]
[ROW][C]3[/C][C]0.383969[/C][C]4.7494[/C][C]2e-06[/C][/ROW]
[ROW][C]4[/C][C]-0.026227[/C][C]-0.3244[/C][C]0.373037[/C][/ROW]
[ROW][C]5[/C][C]0.223264[/C][C]2.7616[/C][C]0.003228[/C][/ROW]
[ROW][C]6[/C][C]-0.00412[/C][C]-0.051[/C][C]0.479709[/C][/ROW]
[ROW][C]7[/C][C]0.136407[/C][C]1.6873[/C][C]0.046795[/C][/ROW]
[ROW][C]8[/C][C]0.003301[/C][C]0.0408[/C][C]0.483744[/C][/ROW]
[ROW][C]9[/C][C]0.084158[/C][C]1.041[/C][C]0.149763[/C][/ROW]
[ROW][C]10[/C][C]0.004612[/C][C]0.057[/C][C]0.47729[/C][/ROW]
[ROW][C]11[/C][C]0.051266[/C][C]0.6341[/C][C]0.263472[/C][/ROW]
[ROW][C]12[/C][C]0.003259[/C][C]0.0403[/C][C]0.483947[/C][/ROW]
[ROW][C]13[/C][C]0.030073[/C][C]0.372[/C][C]0.355212[/C][/ROW]
[ROW][C]14[/C][C]-0.006279[/C][C]-0.0777[/C][C]0.469099[/C][/ROW]
[ROW][C]15[/C][C]0.021073[/C][C]0.2607[/C][C]0.397354[/C][/ROW]
[ROW][C]16[/C][C]-0.017428[/C][C]-0.2156[/C][C]0.414804[/C][/ROW]
[ROW][C]17[/C][C]0.011602[/C][C]0.1435[/C][C]0.443039[/C][/ROW]
[ROW][C]18[/C][C]-0.021306[/C][C]-0.2635[/C][C]0.396245[/C][/ROW]
[ROW][C]19[/C][C]0.003601[/C][C]0.0445[/C][C]0.482265[/C][/ROW]
[ROW][C]20[/C][C]-0.021952[/C][C]-0.2715[/C][C]0.393174[/C][/ROW]
[ROW][C]21[/C][C]-0.002514[/C][C]-0.0311[/C][C]0.487617[/C][/ROW]
[ROW][C]22[/C][C]-0.07901[/C][C]-0.9773[/C][C]0.164983[/C][/ROW]
[ROW][C]23[/C][C]-0.025053[/C][C]-0.3099[/C][C]0.378534[/C][/ROW]
[ROW][C]24[/C][C]-0.017267[/C][C]-0.2136[/C][C]0.415579[/C][/ROW]
[ROW][C]25[/C][C]-0.027665[/C][C]-0.3422[/C][C]0.366336[/C][/ROW]
[ROW][C]26[/C][C]0.008221[/C][C]0.1017[/C][C]0.459568[/C][/ROW]
[ROW][C]27[/C][C]-0.023348[/C][C]-0.2888[/C][C]0.386565[/C][/ROW]
[ROW][C]28[/C][C]0.015994[/C][C]0.1978[/C][C]0.42172[/C][/ROW]
[ROW][C]29[/C][C]-0.025062[/C][C]-0.31[/C][C]0.378493[/C][/ROW]
[ROW][C]30[/C][C]0.014565[/C][C]0.1802[/C][C]0.428635[/C][/ROW]
[ROW][C]31[/C][C]-0.022985[/C][C]-0.2843[/C][C]0.388278[/C][/ROW]
[ROW][C]32[/C][C]0.009925[/C][C]0.1228[/C][C]0.451226[/C][/ROW]
[ROW][C]33[/C][C]-0.020098[/C][C]-0.2486[/C][C]0.402[/C][/ROW]
[ROW][C]34[/C][C]0.004724[/C][C]0.0584[/C][C]0.476739[/C][/ROW]
[ROW][C]35[/C][C]-0.075813[/C][C]-0.9378[/C][C]0.174925[/C][/ROW]
[ROW][C]36[/C][C]-0.01642[/C][C]-0.2031[/C][C]0.419663[/C][/ROW]
[ROW][C]37[/C][C]-0.007935[/C][C]-0.0981[/C][C]0.460971[/C][/ROW]
[ROW][C]38[/C][C]-0.017567[/C][C]-0.2173[/C][C]0.414134[/C][/ROW]
[ROW][C]39[/C][C]0.018829[/C][C]0.2329[/C][C]0.408075[/C][/ROW]
[ROW][C]40[/C][C]-0.012834[/C][C]-0.1588[/C][C]0.437038[/C][/ROW]
[ROW][C]41[/C][C]0.025994[/C][C]0.3215[/C][C]0.374125[/C][/ROW]
[ROW][C]42[/C][C]-0.0078[/C][C]-0.0965[/C][C]0.461635[/C][/ROW]
[ROW][C]43[/C][C]0.024503[/C][C]0.3031[/C][C]0.38112[/C][/ROW]
[ROW][C]44[/C][C]-0.004132[/C][C]-0.0511[/C][C]0.479652[/C][/ROW]
[ROW][C]45[/C][C]0.01452[/C][C]0.1796[/C][C]0.428849[/C][/ROW]
[ROW][C]46[/C][C]-0.004259[/C][C]-0.0527[/C][C]0.47903[/C][/ROW]
[ROW][C]47[/C][C]0.010083[/C][C]0.1247[/C][C]0.450456[/C][/ROW]
[ROW][C]48[/C][C]-0.005017[/C][C]-0.0621[/C][C]0.475301[/C][/ROW]
[/TABLE]
Source: https://freestatistics.org/blog/index.php?pk=233097&T=2

Globally Unique Identifier (entire table): ba.freestatistics.org/blog/index.php?pk=233097&T=2

As an alternative you can also use a QR Code:  

The GUIDs for individual cells are displayed in the table below:

Partial Autocorrelation Function
Time lag kPACF(k)T-STATP-value
10.7886549.75510
2-0.099497-1.23070.110159
30.3839694.74942e-06
4-0.026227-0.32440.373037
50.2232642.76160.003228
6-0.00412-0.0510.479709
70.1364071.68730.046795
80.0033010.04080.483744
90.0841581.0410.149763
100.0046120.0570.47729
110.0512660.63410.263472
120.0032590.04030.483947
130.0300730.3720.355212
14-0.006279-0.07770.469099
150.0210730.26070.397354
16-0.017428-0.21560.414804
170.0116020.14350.443039
18-0.021306-0.26350.396245
190.0036010.04450.482265
20-0.021952-0.27150.393174
21-0.002514-0.03110.487617
22-0.07901-0.97730.164983
23-0.025053-0.30990.378534
24-0.017267-0.21360.415579
25-0.027665-0.34220.366336
260.0082210.10170.459568
27-0.023348-0.28880.386565
280.0159940.19780.42172
29-0.025062-0.310.378493
300.0145650.18020.428635
31-0.022985-0.28430.388278
320.0099250.12280.451226
33-0.020098-0.24860.402
340.0047240.05840.476739
35-0.075813-0.93780.174925
36-0.01642-0.20310.419663
37-0.007935-0.09810.460971
38-0.017567-0.21730.414134
390.0188290.23290.408075
40-0.012834-0.15880.437038
410.0259940.32150.374125
42-0.0078-0.09650.461635
430.0245030.30310.38112
44-0.004132-0.05110.479652
450.014520.17960.428849
46-0.004259-0.05270.47903
470.0100830.12470.450456
48-0.005017-0.06210.475301


Parameters (Session):
par1 = 48 ; par2 = 1 ; par3 = 0 ; par4 = 0 ; par5 = 12 ; par6 = White Noise ; par7 = 0.95 ;
Parameters (R input):
par1 = 48 ; par2 = 1 ; par3 = 0 ; par4 = 0 ; par5 = 12 ; par6 = White Noise ; par7 = 0.95 ; par8 = ;
R code (references can be found in the software module):
if (par1 == 'Default') {
par1 = 10*log10(length(x))
} else {
par1 <- as.numeric(par1)
}
par2 <- as.numeric(par2)
par3 <- as.numeric(par3)
par4 <- as.numeric(par4)
par5 <- as.numeric(par5)
if (par6 == 'White Noise') par6 <- 'white' else par6 <- 'ma'
par7 <- as.numeric(par7)
if (par8 != '') par8 <- as.numeric(par8)
ox <- x
if (par8 == '') {
if (par2 == 0) {
x <- log(x)
} else {
x <- (x ^ par2 - 1) / par2
}
} else {
x <- log(x,base=par8)
}
if (par3 > 0) x <- diff(x,lag=1,difference=par3)
if (par4 > 0) x <- diff(x,lag=par5,difference=par4)
bitmap(file='picts.png')
op <- par(mfrow=c(2,1))
plot(ox,type='l',main='Original Time Series',xlab='time',ylab='value')
if (par8=='') {
mytitle <- paste('Working Time Series (lambda=',par2,', d=',par3,', D=',par4,')',sep='')
mysub <- paste('(lambda=',par2,', d=',par3,', D=',par4,', CI=', par7, ', CI type=',par6,')',sep='')
} else {
mytitle <- paste('Working Time Series (base=',par8,', d=',par3,', D=',par4,')',sep='')
mysub <- paste('(base=',par8,', d=',par3,', D=',par4,', CI=', par7, ', CI type=',par6,')',sep='')
}
plot(x,type='l', main=mytitle,xlab='time',ylab='value')
par(op)
dev.off()
bitmap(file='pic1.png')
racf <- acf(x, par1, main='Autocorrelation', xlab='time lag', ylab='ACF', ci.type=par6, ci=par7, sub=mysub)
dev.off()
bitmap(file='pic2.png')
rpacf <- pacf(x,par1,main='Partial Autocorrelation',xlab='lags',ylab='PACF',sub=mysub)
dev.off()
(myacf <- c(racf$acf))
(mypacf <- c(rpacf$acf))
lengthx <- length(x)
sqrtn <- sqrt(lengthx)
load(file='createtable')
a<-table.start()
a<-table.row.start(a)
a<-table.element(a,'Autocorrelation Function',4,TRUE)
a<-table.row.end(a)
a<-table.row.start(a)
a<-table.element(a,'Time lag k',header=TRUE)
a<-table.element(a,hyperlink('basics.htm','ACF(k)','click here for more information about the Autocorrelation Function'),header=TRUE)
a<-table.element(a,'T-STAT',header=TRUE)
a<-table.element(a,'P-value',header=TRUE)
a<-table.row.end(a)
for (i in 2:(par1+1)) {
a<-table.row.start(a)
a<-table.element(a,i-1,header=TRUE)
a<-table.element(a,round(myacf[i],6))
mytstat <- myacf[i]*sqrtn
a<-table.element(a,round(mytstat,4))
a<-table.element(a,round(1-pt(abs(mytstat),lengthx),6))
a<-table.row.end(a)
}
a<-table.end(a)
table.save(a,file='mytable.tab')
a<-table.start()
a<-table.row.start(a)
a<-table.element(a,'Partial Autocorrelation Function',4,TRUE)
a<-table.row.end(a)
a<-table.row.start(a)
a<-table.element(a,'Time lag k',header=TRUE)
a<-table.element(a,hyperlink('basics.htm','PACF(k)','click here for more information about the Partial Autocorrelation Function'),header=TRUE)
a<-table.element(a,'T-STAT',header=TRUE)
a<-table.element(a,'P-value',header=TRUE)
a<-table.row.end(a)
for (i in 1:par1) {
a<-table.row.start(a)
a<-table.element(a,i,header=TRUE)
a<-table.element(a,round(mypacf[i],6))
mytstat <- mypacf[i]*sqrtn
a<-table.element(a,round(mytstat,4))
a<-table.element(a,round(1-pt(abs(mytstat),lengthx),6))
a<-table.row.end(a)
}
a<-table.end(a)
table.save(a,file='mytable1.tab')