Free Statistics

of Irreproducible Research!

Author's title

Author*The author of this computation has been verified*
R Software Modulerwasp_hierarchicalclusteringdm.wasp
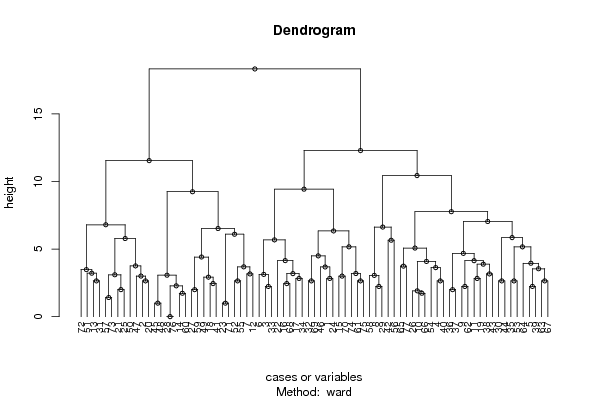
Title produced by softwareHierarchical Clustering
Date of computationTue, 01 May 2012 06:36:24 -0400
Cite this page as followsStatistical Computations at FreeStatistics.org, Office for Research Development and Education, URL https://freestatistics.org/blog/index.php?v=date/2012/May/01/t1335868677k7kfspzfyoeoj6b.htm/, Retrieved Wed, 15 May 2024 01:48:37 +0000
Statistical Computations at FreeStatistics.org, Office for Research Development and Education, URL https://freestatistics.org/blog/index.php?pk=165413, Retrieved Wed, 15 May 2024 01:48:37 +0000
QR Codes:

Original text written by user:
IsPrivate?No (this computation is public)
User-defined keywords
Estimated Impact66
Family? (F = Feedback message, R = changed R code, M = changed R Module, P = changed Parameters, D = changed Data)
-       [Hierarchical Clustering] [hierarchical clus...] [2012-05-01 10:36:24] [242bbde8f74d68805b56d9ecebfdbe63] [Current]
Feedback Forum

Post a new message


Summary of computational transaction
Raw Inputview raw input (R code)
Raw Outputview raw output of R engine
Computing time2 seconds
R Server'Gertrude Mary Cox' @ cox.wessa.net

\begin{tabular}{lllllllll}
\hline
Summary of computational transaction \tabularnewline
Raw Input & view raw input (R code)  \tabularnewline
Raw Output & view raw output of R engine  \tabularnewline
Computing time & 2 seconds \tabularnewline
R Server & 'Gertrude Mary Cox' @ cox.wessa.net \tabularnewline
\hline
\end{tabular}
%Source: https://freestatistics.org/blog/index.php?pk=165413&T=0

[TABLE]
[ROW][C]Summary of computational transaction[/C][/ROW]
[ROW][C]Raw Input[/C][C]view raw input (R code) [/C][/ROW]
[ROW][C]Raw Output[/C][C]view raw output of R engine [/C][/ROW]
[ROW][C]Computing time[/C][C]2 seconds[/C][/ROW]
[ROW][C]R Server[/C][C]'Gertrude Mary Cox' @ cox.wessa.net[/C][/ROW]
[/TABLE]
Source: https://freestatistics.org/blog/index.php?pk=165413&T=0

Globally Unique Identifier (entire table): ba.freestatistics.org/blog/index.php?pk=165413&T=0

As an alternative you can also use a QR Code:  

The GUIDs for individual cells are displayed in the table below:

Summary of computational transaction
Raw Inputview raw input (R code)
Raw Outputview raw output of R engine
Computing time2 seconds
R Server'Gertrude Mary Cox' @ cox.wessa.net


Summary of Dendrogram
LabelHeight
0
1
1
1.4142135623731
1.73205080756888
1.73205080756888
1.91068360252296
2
2
2
2.23606797749979
2.23606797749979
2.23606797749979
2.23606797749979
2.28023896615753
2.44948974278318
2.44948974278318
2.64575131106459
2.64575131106459
2.64575131106459
2.64575131106459
2.64575131106459
2.64575131106459
2.64575131106459
2.64575131106459
2.64575131106459
2.82842712474619
2.82842712474619
2.82842712474619
2.92468168770665
3
3.00370097947593
3.05475706925843
3.06728822131343
3.09982826688008
3.12666332165538
3.16227766016838
3.16227766016838
3.18482108343879
3.1913181804467
3.2147841730462
3.48390613664627
3.54424367141848
3.62996885340005
3.67599311193494
3.68614197512221
3.74165738677394
3.75617940803746
3.88296278505356
3.95220468140548
4.08503126811179
4.14120816277556
4.14810850872199
4.4150830676907
4.49860297067235
4.68185522243554
5.07552947363975
5.16573917441866
5.16828414780411
5.65685424949238
5.68231242264078
5.78095469870229
5.85035236929347
6.09917545891294
6.34278009578727
6.5207934942115
6.63107451407786
6.80056861592192
7.04111579269327
7.76980715387552
9.2448796919071
9.43355711946155
10.4416198820881
11.5485570829486
12.2934936175836
18.3324550034059

\begin{tabular}{lllllllll}
\hline
Summary of Dendrogram \tabularnewline
Label & Height \tabularnewline
 & 0 \tabularnewline
 & 1 \tabularnewline
 & 1 \tabularnewline
 & 1.4142135623731 \tabularnewline
 & 1.73205080756888 \tabularnewline
 & 1.73205080756888 \tabularnewline
 & 1.91068360252296 \tabularnewline
 & 2 \tabularnewline
 & 2 \tabularnewline
 & 2 \tabularnewline
 & 2.23606797749979 \tabularnewline
 & 2.23606797749979 \tabularnewline
 & 2.23606797749979 \tabularnewline
 & 2.23606797749979 \tabularnewline
 & 2.28023896615753 \tabularnewline
 & 2.44948974278318 \tabularnewline
 & 2.44948974278318 \tabularnewline
 & 2.64575131106459 \tabularnewline
 & 2.64575131106459 \tabularnewline
 & 2.64575131106459 \tabularnewline
 & 2.64575131106459 \tabularnewline
 & 2.64575131106459 \tabularnewline
 & 2.64575131106459 \tabularnewline
 & 2.64575131106459 \tabularnewline
 & 2.64575131106459 \tabularnewline
 & 2.64575131106459 \tabularnewline
 & 2.82842712474619 \tabularnewline
 & 2.82842712474619 \tabularnewline
 & 2.82842712474619 \tabularnewline
 & 2.92468168770665 \tabularnewline
 & 3 \tabularnewline
 & 3.00370097947593 \tabularnewline
 & 3.05475706925843 \tabularnewline
 & 3.06728822131343 \tabularnewline
 & 3.09982826688008 \tabularnewline
 & 3.12666332165538 \tabularnewline
 & 3.16227766016838 \tabularnewline
 & 3.16227766016838 \tabularnewline
 & 3.18482108343879 \tabularnewline
 & 3.1913181804467 \tabularnewline
 & 3.2147841730462 \tabularnewline
 & 3.48390613664627 \tabularnewline
 & 3.54424367141848 \tabularnewline
 & 3.62996885340005 \tabularnewline
 & 3.67599311193494 \tabularnewline
 & 3.68614197512221 \tabularnewline
 & 3.74165738677394 \tabularnewline
 & 3.75617940803746 \tabularnewline
 & 3.88296278505356 \tabularnewline
 & 3.95220468140548 \tabularnewline
 & 4.08503126811179 \tabularnewline
 & 4.14120816277556 \tabularnewline
 & 4.14810850872199 \tabularnewline
 & 4.4150830676907 \tabularnewline
 & 4.49860297067235 \tabularnewline
 & 4.68185522243554 \tabularnewline
 & 5.07552947363975 \tabularnewline
 & 5.16573917441866 \tabularnewline
 & 5.16828414780411 \tabularnewline
 & 5.65685424949238 \tabularnewline
 & 5.68231242264078 \tabularnewline
 & 5.78095469870229 \tabularnewline
 & 5.85035236929347 \tabularnewline
 & 6.09917545891294 \tabularnewline
 & 6.34278009578727 \tabularnewline
 & 6.5207934942115 \tabularnewline
 & 6.63107451407786 \tabularnewline
 & 6.80056861592192 \tabularnewline
 & 7.04111579269327 \tabularnewline
 & 7.76980715387552 \tabularnewline
 & 9.2448796919071 \tabularnewline
 & 9.43355711946155 \tabularnewline
 & 10.4416198820881 \tabularnewline
 & 11.5485570829486 \tabularnewline
 & 12.2934936175836 \tabularnewline
 & 18.3324550034059 \tabularnewline
\hline
\end{tabular}
%Source: https://freestatistics.org/blog/index.php?pk=165413&T=1

[TABLE]
[ROW][C]Summary of Dendrogram[/C][/ROW]
[ROW][C]Label[/C][C]Height[/C][/ROW]
[ROW][C][/C][C]0[/C][/ROW]
[ROW][C][/C][C]1[/C][/ROW]
[ROW][C][/C][C]1[/C][/ROW]
[ROW][C][/C][C]1.4142135623731[/C][/ROW]
[ROW][C][/C][C]1.73205080756888[/C][/ROW]
[ROW][C][/C][C]1.73205080756888[/C][/ROW]
[ROW][C][/C][C]1.91068360252296[/C][/ROW]
[ROW][C][/C][C]2[/C][/ROW]
[ROW][C][/C][C]2[/C][/ROW]
[ROW][C][/C][C]2[/C][/ROW]
[ROW][C][/C][C]2.23606797749979[/C][/ROW]
[ROW][C][/C][C]2.23606797749979[/C][/ROW]
[ROW][C][/C][C]2.23606797749979[/C][/ROW]
[ROW][C][/C][C]2.23606797749979[/C][/ROW]
[ROW][C][/C][C]2.28023896615753[/C][/ROW]
[ROW][C][/C][C]2.44948974278318[/C][/ROW]
[ROW][C][/C][C]2.44948974278318[/C][/ROW]
[ROW][C][/C][C]2.64575131106459[/C][/ROW]
[ROW][C][/C][C]2.64575131106459[/C][/ROW]
[ROW][C][/C][C]2.64575131106459[/C][/ROW]
[ROW][C][/C][C]2.64575131106459[/C][/ROW]
[ROW][C][/C][C]2.64575131106459[/C][/ROW]
[ROW][C][/C][C]2.64575131106459[/C][/ROW]
[ROW][C][/C][C]2.64575131106459[/C][/ROW]
[ROW][C][/C][C]2.64575131106459[/C][/ROW]
[ROW][C][/C][C]2.64575131106459[/C][/ROW]
[ROW][C][/C][C]2.82842712474619[/C][/ROW]
[ROW][C][/C][C]2.82842712474619[/C][/ROW]
[ROW][C][/C][C]2.82842712474619[/C][/ROW]
[ROW][C][/C][C]2.92468168770665[/C][/ROW]
[ROW][C][/C][C]3[/C][/ROW]
[ROW][C][/C][C]3.00370097947593[/C][/ROW]
[ROW][C][/C][C]3.05475706925843[/C][/ROW]
[ROW][C][/C][C]3.06728822131343[/C][/ROW]
[ROW][C][/C][C]3.09982826688008[/C][/ROW]
[ROW][C][/C][C]3.12666332165538[/C][/ROW]
[ROW][C][/C][C]3.16227766016838[/C][/ROW]
[ROW][C][/C][C]3.16227766016838[/C][/ROW]
[ROW][C][/C][C]3.18482108343879[/C][/ROW]
[ROW][C][/C][C]3.1913181804467[/C][/ROW]
[ROW][C][/C][C]3.2147841730462[/C][/ROW]
[ROW][C][/C][C]3.48390613664627[/C][/ROW]
[ROW][C][/C][C]3.54424367141848[/C][/ROW]
[ROW][C][/C][C]3.62996885340005[/C][/ROW]
[ROW][C][/C][C]3.67599311193494[/C][/ROW]
[ROW][C][/C][C]3.68614197512221[/C][/ROW]
[ROW][C][/C][C]3.74165738677394[/C][/ROW]
[ROW][C][/C][C]3.75617940803746[/C][/ROW]
[ROW][C][/C][C]3.88296278505356[/C][/ROW]
[ROW][C][/C][C]3.95220468140548[/C][/ROW]
[ROW][C][/C][C]4.08503126811179[/C][/ROW]
[ROW][C][/C][C]4.14120816277556[/C][/ROW]
[ROW][C][/C][C]4.14810850872199[/C][/ROW]
[ROW][C][/C][C]4.4150830676907[/C][/ROW]
[ROW][C][/C][C]4.49860297067235[/C][/ROW]
[ROW][C][/C][C]4.68185522243554[/C][/ROW]
[ROW][C][/C][C]5.07552947363975[/C][/ROW]
[ROW][C][/C][C]5.16573917441866[/C][/ROW]
[ROW][C][/C][C]5.16828414780411[/C][/ROW]
[ROW][C][/C][C]5.65685424949238[/C][/ROW]
[ROW][C][/C][C]5.68231242264078[/C][/ROW]
[ROW][C][/C][C]5.78095469870229[/C][/ROW]
[ROW][C][/C][C]5.85035236929347[/C][/ROW]
[ROW][C][/C][C]6.09917545891294[/C][/ROW]
[ROW][C][/C][C]6.34278009578727[/C][/ROW]
[ROW][C][/C][C]6.5207934942115[/C][/ROW]
[ROW][C][/C][C]6.63107451407786[/C][/ROW]
[ROW][C][/C][C]6.80056861592192[/C][/ROW]
[ROW][C][/C][C]7.04111579269327[/C][/ROW]
[ROW][C][/C][C]7.76980715387552[/C][/ROW]
[ROW][C][/C][C]9.2448796919071[/C][/ROW]
[ROW][C][/C][C]9.43355711946155[/C][/ROW]
[ROW][C][/C][C]10.4416198820881[/C][/ROW]
[ROW][C][/C][C]11.5485570829486[/C][/ROW]
[ROW][C][/C][C]12.2934936175836[/C][/ROW]
[ROW][C][/C][C]18.3324550034059[/C][/ROW]
[/TABLE]
Source: https://freestatistics.org/blog/index.php?pk=165413&T=1

Globally Unique Identifier (entire table): ba.freestatistics.org/blog/index.php?pk=165413&T=1

As an alternative you can also use a QR Code:  

The GUIDs for individual cells are displayed in the table below:

Summary of Dendrogram
LabelHeight
0
1
1
1.4142135623731
1.73205080756888
1.73205080756888
1.91068360252296
2
2
2
2.23606797749979
2.23606797749979
2.23606797749979
2.23606797749979
2.28023896615753
2.44948974278318
2.44948974278318
2.64575131106459
2.64575131106459
2.64575131106459
2.64575131106459
2.64575131106459
2.64575131106459
2.64575131106459
2.64575131106459
2.64575131106459
2.82842712474619
2.82842712474619
2.82842712474619
2.92468168770665
3
3.00370097947593
3.05475706925843
3.06728822131343
3.09982826688008
3.12666332165538
3.16227766016838
3.16227766016838
3.18482108343879
3.1913181804467
3.2147841730462
3.48390613664627
3.54424367141848
3.62996885340005
3.67599311193494
3.68614197512221
3.74165738677394
3.75617940803746
3.88296278505356
3.95220468140548
4.08503126811179
4.14120816277556
4.14810850872199
4.4150830676907
4.49860297067235
4.68185522243554
5.07552947363975
5.16573917441866
5.16828414780411
5.65685424949238
5.68231242264078
5.78095469870229
5.85035236929347
6.09917545891294
6.34278009578727
6.5207934942115
6.63107451407786
6.80056861592192
7.04111579269327
7.76980715387552
9.2448796919071
9.43355711946155
10.4416198820881
11.5485570829486
12.2934936175836
18.3324550034059


Parameters (Session):
par1 = correlation matrix ; par2 = ATTLES separate ; par3 = Exam Items ; par4 = all ; par5 = bachelor ; par6 = 0 ;
Parameters (R input):
par1 = ward ; par2 = ALL ; par3 = FALSE ; par4 = FALSE ; par5 = male ; par6 = bachelor ; par7 = 3 ; par8 = Exam Items ; par9 = cases ;
R code (references can be found in the software module):
x <- as.data.frame(read.table(file='https://automated.biganalytics.eu/download/utaut.csv',sep=',',header=T))
x$U25 <- 6-x$U25
if(par5 == 'female') x <- x[x$Gender==0,]
if(par5 == 'male') x <- x[x$Gender==1,]
if(par6 == 'prep') x <- x[x$Pop==1,]
if(par6 == 'bachelor') x <- x[x$Pop==0,]
if(par7 != 'all') {
x <- x[x$Year==as.numeric(par7),]
}
cAc <- with(x,cbind( A1, A2, A3, A4, A5, A6, A7, A8, A9,A10))
cAs <- with(x,cbind(A11,A12,A13,A14,A15,A16,A17,A18,A19,A20))
cA <- cbind(cAc,cAs)
cCa <- with(x,cbind(C1,C3,C5,C7, C9,C11,C13,C15,C17,C19,C21,C23,C25,C27,C29,C31,C33,C35,C37,C39,C41,C43,C45,C47))
cCp <- with(x,cbind(C2,C4,C6,C8,C10,C12,C14,C16,C18,C20,C22,C24,C26,C28,C30,C32,C34,C36,C38,C40,C42,C44,C46,C48))
cC <- cbind(cCa,cCp)
cU <- with(x,cbind(U1,U2,U3,U4,U5,U6,U7,U8,U9,U10,U11,U12,U13,U14,U15,U16,U17,U18,U19,U20,U21,U22,U23,U24,U25,U26,U27,U28,U29,U30,U31,U32,U33))
cE <- with(x,cbind(BC,NNZFG,MRT,AFL,LPM,LPC,W,WPA))
cX <- with(x,cbind(X1,X2,X3,X4,X5,X6,X7,X8,X9,X10,X11,X12,X13,X14,X15,X16,X17,X18))
if (par8=='ATTLES connected') x <- cAc
if (par8=='ATTLES separate') x <- cAs
if (par8=='ATTLES all') x <- cA
if (par8=='COLLES actuals') x <- cCa
if (par8=='COLLES preferred') x <- cCp
if (par8=='COLLES all') x <- cC
if (par8=='CSUQ') x <- cU
if (par8=='Learning Activities') x <- cE
if (par8=='Exam Items') x <- cX
ncol <- length(x[1,])
for (jjj in 1:ncol) {
x <- x[!is.na(x[,jjj]),]
}
par3 <- as.logical(par3)
par4 <- as.logical(par4)
if (par3 == TRUE){
dum = xlab
xlab = ylab
ylab = dum
}
if (par9=='variables') {
x <- t(x)
} else {
ncol <- length(x[1,])
colnames(x) <- 1:ncol
}
hc <- hclust(dist(x),method=par1)
d <- as.dendrogram(hc)
str(d)
mysub <- paste('Method: ',par1)
bitmap(file='test1.png')
if (par4 == TRUE){
plot(d,main=main,ylab=ylab,xlab=xlab,horiz=par3, nodePar=list(pch = c(1,NA), cex=0.8, lab.cex = 0.8),type='t',center=T, sub=mysub)
} else {
plot(d,main=main,ylab=ylab,xlab=xlab,horiz=par3, nodePar=list(pch = c(1,NA), cex=0.8, lab.cex = 0.8), sub=mysub)
}
dev.off()
if (par2 != 'ALL'){
if (par3 == TRUE){
ylab = 'cluster'
} else {
xlab = 'cluster'
}
par2 <- as.numeric(par2)
memb <- cutree(hc, k = par2)
cent <- NULL
for(k in 1:par2){
cent <- rbind(cent, colMeans(x[memb == k, , drop = FALSE]))
}
hc1 <- hclust(dist(cent),method=par1, members = table(memb))
de <- as.dendrogram(hc1)
bitmap(file='test2.png')
if (par4 == TRUE){
plot(de,main=main,ylab=ylab,xlab=xlab,horiz=par3, nodePar=list(pch = c(1,NA), cex=0.8, lab.cex = 0.8),type='t',center=T, sub=mysub)
} else {
plot(de,main=main,ylab=ylab,xlab=xlab,horiz=par3, nodePar=list(pch = c(1,NA), cex=0.8, lab.cex = 0.8), sub=mysub)
}
dev.off()
str(de)
}
load(file='createtable')
a<-table.start()
a<-table.row.start(a)
a<-table.element(a,'Summary of Dendrogram',2,TRUE)
a<-table.row.end(a)
a<-table.row.start(a)
a<-table.element(a,'Label',header=TRUE)
a<-table.element(a,'Height',header=TRUE)
a<-table.row.end(a)
num <- length(x[,1])-1
for (i in 1:num)
{
a<-table.row.start(a)
a<-table.element(a,hc$labels[i])
a<-table.element(a,hc$height[i])
a<-table.row.end(a)
}
a<-table.end(a)
table.save(a,file='mytable1.tab')
if (par2 != 'ALL'){
a<-table.start()
a<-table.row.start(a)
a<-table.element(a,'Summary of Cut Dendrogram',2,TRUE)
a<-table.row.end(a)
a<-table.row.start(a)
a<-table.element(a,'Label',header=TRUE)
a<-table.element(a,'Height',header=TRUE)
a<-table.row.end(a)
num <- par2-1
for (i in 1:num)
{
a<-table.row.start(a)
a<-table.element(a,i)
a<-table.element(a,hc1$height[i])
a<-table.row.end(a)
}
a<-table.end(a)
table.save(a,file='mytable2.tab')
}