\begin{tabular}{lllllllll}
\hline
Summary of computational transaction \tabularnewline
Raw Input & view raw input (R code)  \tabularnewline
Raw Output & view raw output of R engine  \tabularnewline
Computing time & 2 seconds \tabularnewline
R Server & 'George Udny Yule' @ yule.wessa.net \tabularnewline
\hline
\end{tabular}
%Source: https://freestatistics.org/blog/index.php?pk=196974&T=0
[TABLE]
[ROW][C]Summary of computational transaction[/C][/ROW]
[ROW][C]Raw Input[/C][C]view raw input (R code) [/C][/ROW]
[ROW][C]Raw Output[/C][C]view raw output of R engine [/C][/ROW]
[ROW][C]Computing time[/C][C]2 seconds[/C][/ROW]
[ROW][C]R Server[/C][C]'George Udny Yule' @ yule.wessa.net[/C][/ROW]
[/TABLE]
Source: https://freestatistics.org/blog/index.php?pk=196974&T=0
If you paste this QR Code into your document, anyone with a smartphone or tablet will be able to scan it and view this table in a browser.
If you paste this QR Code into your document, anyone with a smartphone or tablet will be able to scan it and view this table in a browser.
If you paste this QR Code into your document, anyone with a smartphone or tablet will be able to scan it and view this table in a browser.
If you paste this QR Code into your document, anyone with a smartphone or tablet will be able to scan it and view this table in a browser.
If you paste this QR Code into your document, anyone with a smartphone or tablet will be able to scan it and view this table in a browser.
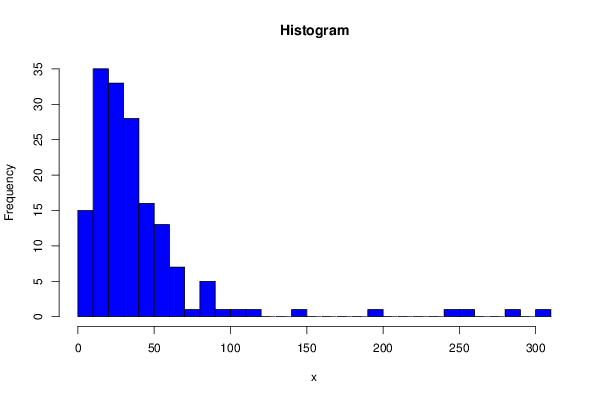
| Frequency Table (Histogram) | | Bins | Midpoint | Abs. Frequency | Rel. Frequency | Cumul. Rel. Freq. | Density | | [0,10[ | 5 | 15 | 0.092593 | 0.092593 | 0.009259 | | [10,20[ | 15 | 35 | 0.216049 | 0.308642 | 0.021605 | | [20,30[ | 25 | 33 | 0.203704 | 0.512346 | 0.02037 | | [30,40[ | 35 | 28 | 0.17284 | 0.685185 | 0.017284 | | [40,50[ | 45 | 16 | 0.098765 | 0.783951 | 0.009877 | | [50,60[ | 55 | 13 | 0.080247 | 0.864198 | 0.008025 | | [60,70[ | 65 | 7 | 0.04321 | 0.907407 | 0.004321 | | [70,80[ | 75 | 1 | 0.006173 | 0.91358 | 0.000617 | | [80,90[ | 85 | 5 | 0.030864 | 0.944444 | 0.003086 | | [90,100[ | 95 | 1 | 0.006173 | 0.950617 | 0.000617 | | [100,110[ | 105 | 1 | 0.006173 | 0.95679 | 0.000617 | | [110,120[ | 115 | 1 | 0.006173 | 0.962963 | 0.000617 | | [120,130[ | 125 | 0 | 0 | 0.962963 | 0 | | [130,140[ | 135 | 0 | 0 | 0.962963 | 0 | | [140,150[ | 145 | 1 | 0.006173 | 0.969136 | 0.000617 | | [150,160[ | 155 | 0 | 0 | 0.969136 | 0 | | [160,170[ | 165 | 0 | 0 | 0.969136 | 0 | | [170,180[ | 175 | 0 | 0 | 0.969136 | 0 | | [180,190[ | 185 | 0 | 0 | 0.969136 | 0 | | [190,200[ | 195 | 1 | 0.006173 | 0.975309 | 0.000617 | | [200,210[ | 205 | 0 | 0 | 0.975309 | 0 | | [210,220[ | 215 | 0 | 0 | 0.975309 | 0 | | [220,230[ | 225 | 0 | 0 | 0.975309 | 0 | | [230,240[ | 235 | 0 | 0 | 0.975309 | 0 | | [240,250[ | 245 | 1 | 0.006173 | 0.981481 | 0.000617 | | [250,260[ | 255 | 1 | 0.006173 | 0.987654 | 0.000617 | | [260,270[ | 265 | 0 | 0 | 0.987654 | 0 | | [270,280[ | 275 | 0 | 0 | 0.987654 | 0 | | [280,290[ | 285 | 1 | 0.006173 | 0.993827 | 0.000617 | | [290,300[ | 295 | 0 | 0 | 0.993827 | 0 | | [300,310] | 305 | 1 | 0.006173 | 1 | 0.000617 |
\begin{tabular}{lllllllll}
\hline
Frequency Table (Histogram) \tabularnewline
Bins & Midpoint & Abs. Frequency & Rel. Frequency & Cumul. Rel. Freq. & Density \tabularnewline
[0,10[ & 5 & 15 & 0.092593 & 0.092593 & 0.009259 \tabularnewline
[10,20[ & 15 & 35 & 0.216049 & 0.308642 & 0.021605 \tabularnewline
[20,30[ & 25 & 33 & 0.203704 & 0.512346 & 0.02037 \tabularnewline
[30,40[ & 35 & 28 & 0.17284 & 0.685185 & 0.017284 \tabularnewline
[40,50[ & 45 & 16 & 0.098765 & 0.783951 & 0.009877 \tabularnewline
[50,60[ & 55 & 13 & 0.080247 & 0.864198 & 0.008025 \tabularnewline
[60,70[ & 65 & 7 & 0.04321 & 0.907407 & 0.004321 \tabularnewline
[70,80[ & 75 & 1 & 0.006173 & 0.91358 & 0.000617 \tabularnewline
[80,90[ & 85 & 5 & 0.030864 & 0.944444 & 0.003086 \tabularnewline
[90,100[ & 95 & 1 & 0.006173 & 0.950617 & 0.000617 \tabularnewline
[100,110[ & 105 & 1 & 0.006173 & 0.95679 & 0.000617 \tabularnewline
[110,120[ & 115 & 1 & 0.006173 & 0.962963 & 0.000617 \tabularnewline
[120,130[ & 125 & 0 & 0 & 0.962963 & 0 \tabularnewline
[130,140[ & 135 & 0 & 0 & 0.962963 & 0 \tabularnewline
[140,150[ & 145 & 1 & 0.006173 & 0.969136 & 0.000617 \tabularnewline
[150,160[ & 155 & 0 & 0 & 0.969136 & 0 \tabularnewline
[160,170[ & 165 & 0 & 0 & 0.969136 & 0 \tabularnewline
[170,180[ & 175 & 0 & 0 & 0.969136 & 0 \tabularnewline
[180,190[ & 185 & 0 & 0 & 0.969136 & 0 \tabularnewline
[190,200[ & 195 & 1 & 0.006173 & 0.975309 & 0.000617 \tabularnewline
[200,210[ & 205 & 0 & 0 & 0.975309 & 0 \tabularnewline
[210,220[ & 215 & 0 & 0 & 0.975309 & 0 \tabularnewline
[220,230[ & 225 & 0 & 0 & 0.975309 & 0 \tabularnewline
[230,240[ & 235 & 0 & 0 & 0.975309 & 0 \tabularnewline
[240,250[ & 245 & 1 & 0.006173 & 0.981481 & 0.000617 \tabularnewline
[250,260[ & 255 & 1 & 0.006173 & 0.987654 & 0.000617 \tabularnewline
[260,270[ & 265 & 0 & 0 & 0.987654 & 0 \tabularnewline
[270,280[ & 275 & 0 & 0 & 0.987654 & 0 \tabularnewline
[280,290[ & 285 & 1 & 0.006173 & 0.993827 & 0.000617 \tabularnewline
[290,300[ & 295 & 0 & 0 & 0.993827 & 0 \tabularnewline
[300,310] & 305 & 1 & 0.006173 & 1 & 0.000617 \tabularnewline
\hline
\end{tabular}
%Source: https://freestatistics.org/blog/index.php?pk=196974&T=1
[TABLE]
[ROW][C]Frequency Table (Histogram)[/C][/ROW]
[ROW][C]Bins[/C][C]Midpoint[/C][C]Abs. Frequency[/C][C]Rel. Frequency[/C][C]Cumul. Rel. Freq.[/C][C]Density[/C][/ROW]
[ROW][C][0,10[[/C][C]5[/C][C]15[/C][C]0.092593[/C][C]0.092593[/C][C]0.009259[/C][/ROW]
[ROW][C][10,20[[/C][C]15[/C][C]35[/C][C]0.216049[/C][C]0.308642[/C][C]0.021605[/C][/ROW]
[ROW][C][20,30[[/C][C]25[/C][C]33[/C][C]0.203704[/C][C]0.512346[/C][C]0.02037[/C][/ROW]
[ROW][C][30,40[[/C][C]35[/C][C]28[/C][C]0.17284[/C][C]0.685185[/C][C]0.017284[/C][/ROW]
[ROW][C][40,50[[/C][C]45[/C][C]16[/C][C]0.098765[/C][C]0.783951[/C][C]0.009877[/C][/ROW]
[ROW][C][50,60[[/C][C]55[/C][C]13[/C][C]0.080247[/C][C]0.864198[/C][C]0.008025[/C][/ROW]
[ROW][C][60,70[[/C][C]65[/C][C]7[/C][C]0.04321[/C][C]0.907407[/C][C]0.004321[/C][/ROW]
[ROW][C][70,80[[/C][C]75[/C][C]1[/C][C]0.006173[/C][C]0.91358[/C][C]0.000617[/C][/ROW]
[ROW][C][80,90[[/C][C]85[/C][C]5[/C][C]0.030864[/C][C]0.944444[/C][C]0.003086[/C][/ROW]
[ROW][C][90,100[[/C][C]95[/C][C]1[/C][C]0.006173[/C][C]0.950617[/C][C]0.000617[/C][/ROW]
[ROW][C][100,110[[/C][C]105[/C][C]1[/C][C]0.006173[/C][C]0.95679[/C][C]0.000617[/C][/ROW]
[ROW][C][110,120[[/C][C]115[/C][C]1[/C][C]0.006173[/C][C]0.962963[/C][C]0.000617[/C][/ROW]
[ROW][C][120,130[[/C][C]125[/C][C]0[/C][C]0[/C][C]0.962963[/C][C]0[/C][/ROW]
[ROW][C][130,140[[/C][C]135[/C][C]0[/C][C]0[/C][C]0.962963[/C][C]0[/C][/ROW]
[ROW][C][140,150[[/C][C]145[/C][C]1[/C][C]0.006173[/C][C]0.969136[/C][C]0.000617[/C][/ROW]
[ROW][C][150,160[[/C][C]155[/C][C]0[/C][C]0[/C][C]0.969136[/C][C]0[/C][/ROW]
[ROW][C][160,170[[/C][C]165[/C][C]0[/C][C]0[/C][C]0.969136[/C][C]0[/C][/ROW]
[ROW][C][170,180[[/C][C]175[/C][C]0[/C][C]0[/C][C]0.969136[/C][C]0[/C][/ROW]
[ROW][C][180,190[[/C][C]185[/C][C]0[/C][C]0[/C][C]0.969136[/C][C]0[/C][/ROW]
[ROW][C][190,200[[/C][C]195[/C][C]1[/C][C]0.006173[/C][C]0.975309[/C][C]0.000617[/C][/ROW]
[ROW][C][200,210[[/C][C]205[/C][C]0[/C][C]0[/C][C]0.975309[/C][C]0[/C][/ROW]
[ROW][C][210,220[[/C][C]215[/C][C]0[/C][C]0[/C][C]0.975309[/C][C]0[/C][/ROW]
[ROW][C][220,230[[/C][C]225[/C][C]0[/C][C]0[/C][C]0.975309[/C][C]0[/C][/ROW]
[ROW][C][230,240[[/C][C]235[/C][C]0[/C][C]0[/C][C]0.975309[/C][C]0[/C][/ROW]
[ROW][C][240,250[[/C][C]245[/C][C]1[/C][C]0.006173[/C][C]0.981481[/C][C]0.000617[/C][/ROW]
[ROW][C][250,260[[/C][C]255[/C][C]1[/C][C]0.006173[/C][C]0.987654[/C][C]0.000617[/C][/ROW]
[ROW][C][260,270[[/C][C]265[/C][C]0[/C][C]0[/C][C]0.987654[/C][C]0[/C][/ROW]
[ROW][C][270,280[[/C][C]275[/C][C]0[/C][C]0[/C][C]0.987654[/C][C]0[/C][/ROW]
[ROW][C][280,290[[/C][C]285[/C][C]1[/C][C]0.006173[/C][C]0.993827[/C][C]0.000617[/C][/ROW]
[ROW][C][290,300[[/C][C]295[/C][C]0[/C][C]0[/C][C]0.993827[/C][C]0[/C][/ROW]
[ROW][C][300,310][/C][C]305[/C][C]1[/C][C]0.006173[/C][C]1[/C][C]0.000617[/C][/ROW]
[/TABLE]
Source: https://freestatistics.org/blog/index.php?pk=196974&T=1
Globally Unique Identifier (entire table): ba.freestatistics.org/blog/index.php?pk=196974&T=1
As an alternative you can also use a QR Code:
The GUIDs for individual cells are displayed in the table below:
| Frequency Table (Histogram) | | Bins | Midpoint | Abs. Frequency | Rel. Frequency | Cumul. Rel. Freq. | Density | | [0,10[ | 5 | 15 | 0.092593 | 0.092593 | 0.009259 | | [10,20[ | 15 | 35 | 0.216049 | 0.308642 | 0.021605 | | [20,30[ | 25 | 33 | 0.203704 | 0.512346 | 0.02037 | | [30,40[ | 35 | 28 | 0.17284 | 0.685185 | 0.017284 | | [40,50[ | 45 | 16 | 0.098765 | 0.783951 | 0.009877 | | [50,60[ | 55 | 13 | 0.080247 | 0.864198 | 0.008025 | | [60,70[ | 65 | 7 | 0.04321 | 0.907407 | 0.004321 | | [70,80[ | 75 | 1 | 0.006173 | 0.91358 | 0.000617 | | [80,90[ | 85 | 5 | 0.030864 | 0.944444 | 0.003086 | | [90,100[ | 95 | 1 | 0.006173 | 0.950617 | 0.000617 | | [100,110[ | 105 | 1 | 0.006173 | 0.95679 | 0.000617 | | [110,120[ | 115 | 1 | 0.006173 | 0.962963 | 0.000617 | | [120,130[ | 125 | 0 | 0 | 0.962963 | 0 | | [130,140[ | 135 | 0 | 0 | 0.962963 | 0 | | [140,150[ | 145 | 1 | 0.006173 | 0.969136 | 0.000617 | | [150,160[ | 155 | 0 | 0 | 0.969136 | 0 | | [160,170[ | 165 | 0 | 0 | 0.969136 | 0 | | [170,180[ | 175 | 0 | 0 | 0.969136 | 0 | | [180,190[ | 185 | 0 | 0 | 0.969136 | 0 | | [190,200[ | 195 | 1 | 0.006173 | 0.975309 | 0.000617 | | [200,210[ | 205 | 0 | 0 | 0.975309 | 0 | | [210,220[ | 215 | 0 | 0 | 0.975309 | 0 | | [220,230[ | 225 | 0 | 0 | 0.975309 | 0 | | [230,240[ | 235 | 0 | 0 | 0.975309 | 0 | | [240,250[ | 245 | 1 | 0.006173 | 0.981481 | 0.000617 | | [250,260[ | 255 | 1 | 0.006173 | 0.987654 | 0.000617 | | [260,270[ | 265 | 0 | 0 | 0.987654 | 0 | | [270,280[ | 275 | 0 | 0 | 0.987654 | 0 | | [280,290[ | 285 | 1 | 0.006173 | 0.993827 | 0.000617 | | [290,300[ | 295 | 0 | 0 | 0.993827 | 0 | | [300,310] | 305 | 1 | 0.006173 | 1 | 0.000617 |
If you paste this QR Code into your document, anyone with a smartphone or tablet will be able to scan it and view this table in a browser.
If you paste this QR Code into your document, anyone with a smartphone or tablet will be able to scan it and view this table in a browser.
If you paste this QR Code into your document, anyone with a smartphone or tablet will be able to scan it and view this table in a browser.
If you paste this QR Code into your document, anyone with a smartphone or tablet will be able to scan it and view this table in a browser.
If you paste this QR Code into your document, anyone with a smartphone or tablet will be able to scan it and view this table in a browser.
|