Free Statistics
of Irreproducible Research!
Description of Statistical Computation | |||||||||||||||||||||||||||||||||
|---|---|---|---|---|---|---|---|---|---|---|---|---|---|---|---|---|---|---|---|---|---|---|---|---|---|---|---|---|---|---|---|---|---|
| Author's title | |||||||||||||||||||||||||||||||||
| Author | *The author of this computation has been verified* | ||||||||||||||||||||||||||||||||
| R Software Module | rwasp_density.wasp | ||||||||||||||||||||||||||||||||
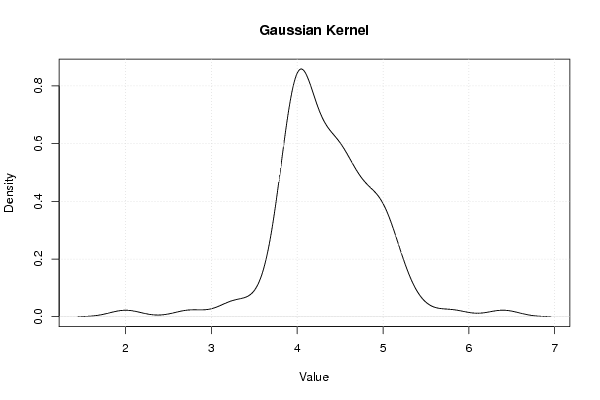
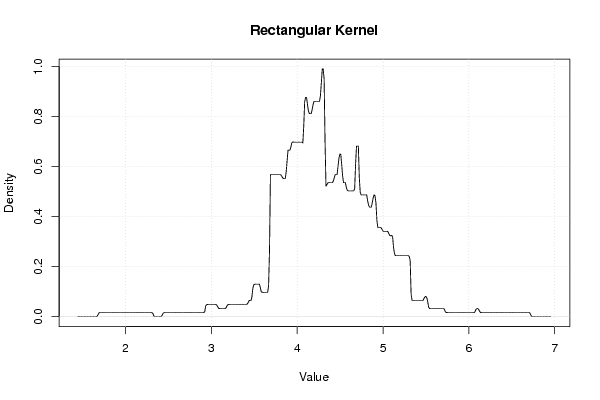
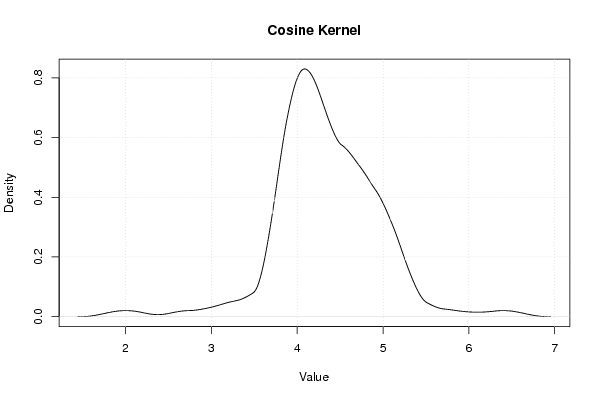
| Title produced by software | Kernel Density Estimation | ||||||||||||||||||||||||||||||||
| Date of computation | Sat, 05 Nov 2011 12:07:00 -0400 | ||||||||||||||||||||||||||||||||
| Cite this page as follows | Statistical Computations at FreeStatistics.org, Office for Research Development and Education, URL https://freestatistics.org/blog/index.php?v=date/2011/Nov/05/t1320509240ipc0ylegffvn080.htm/, Retrieved Tue, 21 May 2024 16:11:58 +0000 | ||||||||||||||||||||||||||||||||
| Statistical Computations at FreeStatistics.org, Office for Research Development and Education, URL https://freestatistics.org/blog/index.php?pk=139858, Retrieved Tue, 21 May 2024 16:11:58 +0000 | |||||||||||||||||||||||||||||||||
| QR Codes: | |||||||||||||||||||||||||||||||||
|
| |||||||||||||||||||||||||||||||||
| Original text written by user: | |||||||||||||||||||||||||||||||||
| IsPrivate? | No (this computation is public) | ||||||||||||||||||||||||||||||||
| User-defined keywords | |||||||||||||||||||||||||||||||||
| Estimated Impact | 110 | ||||||||||||||||||||||||||||||||
Tree of Dependent Computations | |||||||||||||||||||||||||||||||||
| Family? (F = Feedback message, R = changed R code, M = changed R Module, P = changed Parameters, D = changed Data) | |||||||||||||||||||||||||||||||||
| - [Histogram and QQplot] [PY2224 Aston Work...] [2009-10-06 09:57:09] [98fd0e87c3eb04e0cc2efde01dbafab6] - P [Histogram and QQplot] [olivia friday] [2009-10-09 12:41:21] [3fdd735c61ad38cbc9b3393dc997cdb7] - RMPD [Histogram and QQplot] [Reddy Moores Hist...] [2009-10-09 13:23:16] [98fd0e87c3eb04e0cc2efde01dbafab6] - RM [Histogram and QQPlot (Reddy-Moores Data)] [Histogram and QQP...] [2011-10-10 10:35:06] [98fd0e87c3eb04e0cc2efde01dbafab6] - R D [Histogram and QQPlot (Reddy-Moores Data)] [Testing variables] [2011-10-27 12:26:20] [e3bca26b0e60ee0c7c12e4668b30341a] - RMP [Kernel Density Estimation] [Density] [2011-11-05 16:07:00] [ba39d87c5b07fdeb99ead4bedf199d9b] [Current] | |||||||||||||||||||||||||||||||||
| Feedback Forum | |||||||||||||||||||||||||||||||||
Post a new message | |||||||||||||||||||||||||||||||||
Dataset | |||||||||||||||||||||||||||||||||
| Dataseries X: | |||||||||||||||||||||||||||||||||
4.6 4 4.8 4 5 5 4 4 4.4 4 4 5 3.8 4.6 4 4.6 4.666666667 4 4 4.4 4.8 5.8 4.6 4.75 5 2.75 4 3.8 4.4 4.8 4.25 4.4 4 4.5 5 3.5 2 4.4 4.4 4.25 3.25 4.2 4.75 4.4 4 4.2 5 4.6 4.4 4 4.4 4.5 5.2 4.4 3.25 4.6 3.75 5 3.8 4 5.4 5 5 4.2 4.4 4 4.6 4.2 5.2 6.4 4 4 5 4 4.2 4 4 4 4 4 4.2 4 4 4 5.2 4.2 4.8 4 4.8 5 4.6 4 4.4 4 3.8 4.5 | |||||||||||||||||||||||||||||||||
Tables (Output of Computation) | |||||||||||||||||||||||||||||||||
| |||||||||||||||||||||||||||||||||
Figures (Output of Computation) | |||||||||||||||||||||||||||||||||
Input Parameters & R Code | |||||||||||||||||||||||||||||||||
| Parameters (Session): | |||||||||||||||||||||||||||||||||
| par1 = 0 ; | |||||||||||||||||||||||||||||||||
| Parameters (R input): | |||||||||||||||||||||||||||||||||
| par1 = 0 ; | |||||||||||||||||||||||||||||||||
| R code (references can be found in the software module): | |||||||||||||||||||||||||||||||||
if (par1 == '0') bw <- 'nrd0' | |||||||||||||||||||||||||||||||||