Free Statistics
of Irreproducible Research!
Description of Statistical Computation | |||||||||||||||||||||||||||||||||||||||||
|---|---|---|---|---|---|---|---|---|---|---|---|---|---|---|---|---|---|---|---|---|---|---|---|---|---|---|---|---|---|---|---|---|---|---|---|---|---|---|---|---|---|
| Author's title | |||||||||||||||||||||||||||||||||||||||||
| Author | *Unverified author* | ||||||||||||||||||||||||||||||||||||||||
| R Software Module | rwasp_univariatedataseries.wasp | ||||||||||||||||||||||||||||||||||||||||
| Title produced by software | Univariate Data Series | ||||||||||||||||||||||||||||||||||||||||
| Date of computation | Mon, 14 Feb 2011 13:34:44 +0000 | ||||||||||||||||||||||||||||||||||||||||
| Cite this page as follows | Statistical Computations at FreeStatistics.org, Office for Research Development and Education, URL https://freestatistics.org/blog/index.php?v=date/2011/Feb/14/t1297690316herk7uwyv2tvv8h.htm/, Retrieved Tue, 30 Apr 2024 00:30:53 +0000 | ||||||||||||||||||||||||||||||||||||||||
| Statistical Computations at FreeStatistics.org, Office for Research Development and Education, URL https://freestatistics.org/blog/index.php?pk=118227, Retrieved Tue, 30 Apr 2024 00:30:53 +0000 | |||||||||||||||||||||||||||||||||||||||||
| QR Codes: | |||||||||||||||||||||||||||||||||||||||||
|
| |||||||||||||||||||||||||||||||||||||||||
| Original text written by user: | |||||||||||||||||||||||||||||||||||||||||
| IsPrivate? | No (this computation is public) | ||||||||||||||||||||||||||||||||||||||||
| User-defined keywords | KDGP1W1 | ||||||||||||||||||||||||||||||||||||||||
| Estimated Impact | 234 | ||||||||||||||||||||||||||||||||||||||||
Tree of Dependent Computations | |||||||||||||||||||||||||||||||||||||||||
| Family? (F = Feedback message, R = changed R code, M = changed R Module, P = changed Parameters, D = changed Data) | |||||||||||||||||||||||||||||||||||||||||
| - [Univariate Data Series] [Jonas Cloots MAR ...] [2011-02-14 13:22:26] [398bf779a533b42ff38e7070e29dfa5f] - R P [Univariate Data Series] [] [2011-02-14 13:34:44] [e414a1f4d0a08e5011052e6ef0a3e93e] [Current] | |||||||||||||||||||||||||||||||||||||||||
| Feedback Forum | |||||||||||||||||||||||||||||||||||||||||
Post a new message | |||||||||||||||||||||||||||||||||||||||||
Dataset | |||||||||||||||||||||||||||||||||||||||||
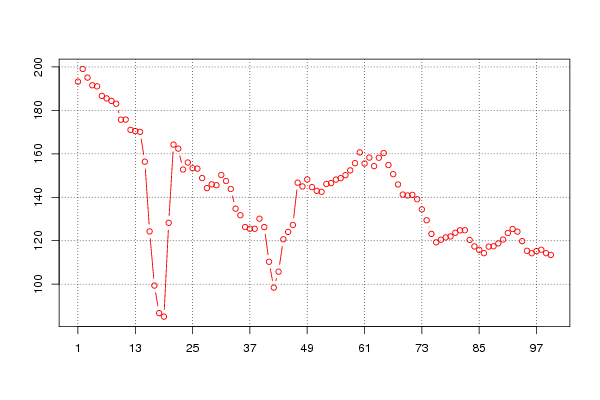
| Dataseries X: | |||||||||||||||||||||||||||||||||||||||||
193.230 199.068 195.076 191.563 191.067 186.665 185.508 184.371 183.046 175.714 175.768 171.029 170.465 170.102 156.389 124.291 99.360 86.675 85.056 128.236 164.257 162.401 152.779 156.005 153.387 153.190 148.840 144.211 145.953 145.542 150.271 147.489 143.824 134.754 131.736 126.304 125.511 125.495 130.133 126.257 110.323 98.417 105.749 120.665 124.075 127.245 146.731 144.979 148.210 144.670 142.970 142.524 146.142 146.522 148.128 148.798 150.181 152.388 155.694 160.662 155.520 158.262 154.338 158.196 160.371 154.856 150.636 145.899 141.242 140.834 141.119 139.104 134.437 129.425 123.155 119.273 120.472 121.523 121.983 123.658 124.794 124.827 120.382 117.395 115.790 114.283 117.271 117.448 118.764 120.550 123.554 125.412 124.182 119.828 115.361 114.226 115.214 115.864 114.276 113.469 | |||||||||||||||||||||||||||||||||||||||||
Tables (Output of Computation) | |||||||||||||||||||||||||||||||||||||||||
| |||||||||||||||||||||||||||||||||||||||||
Figures (Output of Computation) | |||||||||||||||||||||||||||||||||||||||||
Input Parameters & R Code | |||||||||||||||||||||||||||||||||||||||||
| Parameters (Session): | |||||||||||||||||||||||||||||||||||||||||
| par1 = Evolutie van het aantal geboorten in België sinds 1900 - 1999 ; par2 = http://statbel.fgov.be/nl/modules/publications/statistiques/bevolking/downloads/evolutie_van_het_aantal_geboorten_belgie.jsp ; par3 = Grafiek: evolutie van het aantal geboorten in België ; par4 = 12 ; | |||||||||||||||||||||||||||||||||||||||||
| Parameters (R input): | |||||||||||||||||||||||||||||||||||||||||
| par1 = Evolutie van het aantal geboorten in België sinds 1900 - 1999 ; par2 = http://statbel.fgov.be/nl/modules/publications/statistiques/bevolking/downloads/evolutie_van_het_aantal_geboorten_belgie.jsp ; par3 = Grafiek: evolutie van het aantal geboorten in België ; par4 = 12 ; par5 = ; par6 = ; par7 = ; par8 = ; par9 = ; par10 = ; par11 = ; par12 = ; par13 = ; par14 = ; par15 = ; par16 = ; par17 = ; par18 = ; par19 = ; par20 = ; | |||||||||||||||||||||||||||||||||||||||||
| R code (references can be found in the software module): | |||||||||||||||||||||||||||||||||||||||||
if (par4 != 'No season') { | |||||||||||||||||||||||||||||||||||||||||