Free Statistics
of Irreproducible Research!
Description of Statistical Computation | |||||||||||||||||||||||||||||||||||||||||||||
|---|---|---|---|---|---|---|---|---|---|---|---|---|---|---|---|---|---|---|---|---|---|---|---|---|---|---|---|---|---|---|---|---|---|---|---|---|---|---|---|---|---|---|---|---|---|
| Author's title | |||||||||||||||||||||||||||||||||||||||||||||
| Author | *Unverified author* | ||||||||||||||||||||||||||||||||||||||||||||
| R Software Module | rwasp_univariatedataseries.wasp | ||||||||||||||||||||||||||||||||||||||||||||
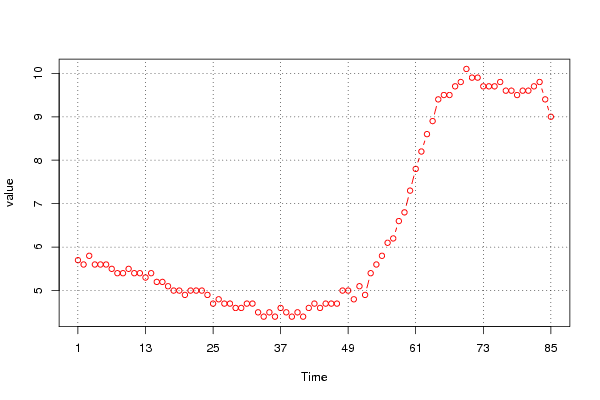
| Title produced by software | Univariate Data Series | ||||||||||||||||||||||||||||||||||||||||||||
| Date of computation | Sun, 13 Feb 2011 19:45:36 +0000 | ||||||||||||||||||||||||||||||||||||||||||||
| Cite this page as follows | Statistical Computations at FreeStatistics.org, Office for Research Development and Education, URL https://freestatistics.org/blog/index.php?v=date/2011/Feb/13/t1297626724pm1me90tbvtsbeu.htm/, Retrieved Sun, 19 May 2024 22:06:12 +0000 | ||||||||||||||||||||||||||||||||||||||||||||
| Statistical Computations at FreeStatistics.org, Office for Research Development and Education, URL https://freestatistics.org/blog/index.php?pk=118210, Retrieved Sun, 19 May 2024 22:06:12 +0000 | |||||||||||||||||||||||||||||||||||||||||||||
| QR Codes: | |||||||||||||||||||||||||||||||||||||||||||||
|
| |||||||||||||||||||||||||||||||||||||||||||||
| Original text written by user: | |||||||||||||||||||||||||||||||||||||||||||||
| IsPrivate? | No (this computation is public) | ||||||||||||||||||||||||||||||||||||||||||||
| User-defined keywords | |||||||||||||||||||||||||||||||||||||||||||||
| Estimated Impact | 215 | ||||||||||||||||||||||||||||||||||||||||||||
Tree of Dependent Computations | |||||||||||||||||||||||||||||||||||||||||||||
| Family? (F = Feedback message, R = changed R code, M = changed R Module, P = changed Parameters, D = changed Data) | |||||||||||||||||||||||||||||||||||||||||||||
| - [Univariate Data Series] [Werkloosheid VS] [2011-02-13 19:45:36] [d41d8cd98f00b204e9800998ecf8427e] [Current] - RMP [Histogram] [frequentietabel: ...] [2011-02-20 17:56:48] [74be16979710d4c4e7c6647856088456] - RMP [Histogram] [Histogram: Werklo...] [2011-02-20 17:56:48] [74be16979710d4c4e7c6647856088456] - RMP [Kernel Density Estimation] [dichtheidsgrafiek...] [2011-02-20 18:29:53] [74be16979710d4c4e7c6647856088456] - PD [Univariate Data Series] [Maximumprijzen sh...] [2011-02-20 18:46:53] [74be16979710d4c4e7c6647856088456] - PD [Univariate Data Series] [Maximumprijzen sh...] [2011-02-20 18:48:23] [74be16979710d4c4e7c6647856088456] | |||||||||||||||||||||||||||||||||||||||||||||
| Feedback Forum | |||||||||||||||||||||||||||||||||||||||||||||
Post a new message | |||||||||||||||||||||||||||||||||||||||||||||
Dataset | |||||||||||||||||||||||||||||||||||||||||||||
| Dataseries X: | |||||||||||||||||||||||||||||||||||||||||||||
5.7 5.6 5.8 5.6 5.6 5.6 5.5 5.4 5.4 5.5 5.4 5.4 5.3 5.4 5.2 5.2 5.1 5 5 4.9 5 5 5 4.9 4.7 4.8 4.7 4.7 4.6 4.6 4.7 4.7 4.5 4.4 4.5 4.4 4.6 4.5 4.4 4.5 4.4 4.6 4.7 4.6 4.7 4.7 4.7 5 5 4.8 5.1 4.9 5.4 5.6 5.8 6.1 6.2 6.6 6.8 7.3 7.8 8.2 8.6 8.9 9.4 9.5 9.5 9.7 9.8 10.1 9.9 9.9 9.7 9.7 9.7 9.8 9.6 9.6 9.5 9.6 9.6 9.7 9.8 9.4 9 | |||||||||||||||||||||||||||||||||||||||||||||
Tables (Output of Computation) | |||||||||||||||||||||||||||||||||||||||||||||
| |||||||||||||||||||||||||||||||||||||||||||||
Figures (Output of Computation) | |||||||||||||||||||||||||||||||||||||||||||||
Input Parameters & R Code | |||||||||||||||||||||||||||||||||||||||||||||
| Parameters (Session): | |||||||||||||||||||||||||||||||||||||||||||||
| par1 = Werkloosheidscijfers VS ; par2 = http://www.economagic.com/em-cgi/data.exe/fedstl/unrate ; par3 = De werkloosheidscijfers van de VS tussen 2001-2010 ; par4 = No season ; | |||||||||||||||||||||||||||||||||||||||||||||
| Parameters (R input): | |||||||||||||||||||||||||||||||||||||||||||||
| par1 = Werkloosheidscijfers VS ; par2 = http://www.economagic.com/em-cgi/data.exe/fedstl/unrate ; par3 = De werkloosheidscijfers van de VS tussen 2001-2010 ; par4 = 12 ; | |||||||||||||||||||||||||||||||||||||||||||||
| R code (references can be found in the software module): | |||||||||||||||||||||||||||||||||||||||||||||
if (par4 != 'No season') { | |||||||||||||||||||||||||||||||||||||||||||||