Free Statistics

of Irreproducible Research!

Author's title

Author*The author of this computation has been verified*
R Software Modulerwasp_multipleregression.wasp
Title produced by softwareMultiple Regression
Date of computationWed, 18 Nov 2009 11:07:50 -0700
Cite this page as followsStatistical Computations at FreeStatistics.org, Office for Research Development and Education, URL https://freestatistics.org/blog/index.php?v=date/2009/Nov/18/t1258567734hudaqb0wp67ekp1.htm/, Retrieved Sat, 18 May 2024 22:21:42 +0000
Statistical Computations at FreeStatistics.org, Office for Research Development and Education, URL https://freestatistics.org/blog/index.php?pk=57572, Retrieved Sat, 18 May 2024 22:21:42 +0000
QR Codes:

Original text written by user:
IsPrivate?No (this computation is public)
User-defined keywords
Estimated Impact131
Family? (F = Feedback message, R = changed R code, M = changed R Module, P = changed Parameters, D = changed Data)
-     [Multiple Regression] [Q1 The Seatbeltlaw] [2007-11-14 19:27:43] [8cd6641b921d30ebe00b648d1481bba0]
- RMPD  [Multiple Regression] [Seatbelt] [2009-11-12 13:54:52] [b98453cac15ba1066b407e146608df68]
- R PD      [Multiple Regression] [] [2009-11-18 18:07:50] [d5837f25ec8937f9733a894c487f865c] [Current]
-    D        [Multiple Regression] [] [2009-11-18 18:29:56] [c0117c881d5fcd069841276db0c34efe]
Feedback Forum

Post a new message
Dataseries X:
3030.29	101.2
2803.47	101.1
2767.63	100.7
2882.6	100.1
2863.36	99.9
2897.06	99.7
3012.61	99.5
3142.95	99.2
3032.93	99
3045.78	99
3110.52	99.3
3013.24	99.5
2987.1	99.7
2995.55	100
2833.18	100.4
2848.96	100.6
2794.83	100.7
2845.26	100.7
2915.02	100.6
2892.63	100.5
2604.42	100.6
2641.65	100.5
2659.81	100.4
2638.53	100.3
2720.25	100.4
2745.88	100.4
2735.7	100.4
2811.7	100.4
2799.43	100.4
2555.28	100.5
2304.98	100.6
2214.95	100.6
2065.81	100.5
1940.49	100.5
2042.00	100.7
1995.37	101.1
1946.81	101.5
1765.9	101.9
1635.25	102.1
1833.42	102.1
1910.43	102.1
1959.67	102.4
1969.6	102.8
2061.41	103.1
2093.48	103.1
2120.88	102.9
2174.56	102.4
2196.72	101.9
2350.44	101.3
2440.25	100.7
2408.64	100.6
2472.81	101
2407.6	101.5
2454.62	101.9
2448.05	102.1
2497.84	102.3
2645.64	102.5
2756.76	102.9
2849.27	103.6
2921.44	104.3


Summary of computational transaction
Raw Inputview raw input (R code)
Raw Outputview raw output of R engine
Computing time4 seconds
R Server'Gwilym Jenkins' @ 72.249.127.135

\begin{tabular}{lllllllll}
\hline
Summary of computational transaction \tabularnewline
Raw Input & view raw input (R code)  \tabularnewline
Raw Output & view raw output of R engine  \tabularnewline
Computing time & 4 seconds \tabularnewline
R Server & 'Gwilym Jenkins' @ 72.249.127.135 \tabularnewline
\hline
\end{tabular}
%Source: https://freestatistics.org/blog/index.php?pk=57572&T=0

[TABLE]
[ROW][C]Summary of computational transaction[/C][/ROW]
[ROW][C]Raw Input[/C][C]view raw input (R code) [/C][/ROW]
[ROW][C]Raw Output[/C][C]view raw output of R engine [/C][/ROW]
[ROW][C]Computing time[/C][C]4 seconds[/C][/ROW]
[ROW][C]R Server[/C][C]'Gwilym Jenkins' @ 72.249.127.135[/C][/ROW]
[/TABLE]
Source: https://freestatistics.org/blog/index.php?pk=57572&T=0

Globally Unique Identifier (entire table): ba.freestatistics.org/blog/index.php?pk=57572&T=0

As an alternative you can also use a QR Code:  

The GUIDs for individual cells are displayed in the table below:

Summary of computational transaction
Raw Inputview raw input (R code)
Raw Outputview raw output of R engine
Computing time4 seconds
R Server'Gwilym Jenkins' @ 72.249.127.135


Multiple Linear Regression - Estimated Regression Equation
G.indx[t] = + 105.02459764215 -0.00156561284976838Bel20[t] + e[t]

\begin{tabular}{lllllllll}
\hline
Multiple Linear Regression - Estimated Regression Equation \tabularnewline
G.indx[t] =  +  105.02459764215 -0.00156561284976838Bel20[t]  + e[t] \tabularnewline
\hline
\end{tabular}
%Source: https://freestatistics.org/blog/index.php?pk=57572&T=1

[TABLE]
[ROW][C]Multiple Linear Regression - Estimated Regression Equation[/C][/ROW]
[ROW][C]G.indx[t] =  +  105.02459764215 -0.00156561284976838Bel20[t]  + e[t][/C][/ROW]
[/TABLE]
Source: https://freestatistics.org/blog/index.php?pk=57572&T=1

Globally Unique Identifier (entire table): ba.freestatistics.org/blog/index.php?pk=57572&T=1

As an alternative you can also use a QR Code:  

The GUIDs for individual cells are displayed in the table below:

Multiple Linear Regression - Estimated Regression Equation
G.indx[t] = + 105.02459764215 -0.00156561284976838Bel20[t] + e[t]


Multiple Linear Regression - Ordinary Least Squares
VariableParameterS.D.T-STATH0: parameter = 02-tail p-value1-tail p-value
(Intercept)105.024597642150.847463123.928200
Bel20-0.001565612849768380.000329-4.75321.4e-057e-06

\begin{tabular}{lllllllll}
\hline
Multiple Linear Regression - Ordinary Least Squares \tabularnewline
Variable & Parameter & S.D. & T-STATH0: parameter = 0 & 2-tail p-value & 1-tail p-value \tabularnewline
(Intercept) & 105.02459764215 & 0.847463 & 123.9282 & 0 & 0 \tabularnewline
Bel20 & -0.00156561284976838 & 0.000329 & -4.7532 & 1.4e-05 & 7e-06 \tabularnewline
\hline
\end{tabular}
%Source: https://freestatistics.org/blog/index.php?pk=57572&T=2

[TABLE]
[ROW][C]Multiple Linear Regression - Ordinary Least Squares[/C][/ROW]
[ROW][C]Variable[/C][C]Parameter[/C][C]S.D.[/C][C]T-STATH0: parameter = 0[/C][C]2-tail p-value[/C][C]1-tail p-value[/C][/ROW]
[ROW][C](Intercept)[/C][C]105.02459764215[/C][C]0.847463[/C][C]123.9282[/C][C]0[/C][C]0[/C][/ROW]
[ROW][C]Bel20[/C][C]-0.00156561284976838[/C][C]0.000329[/C][C]-4.7532[/C][C]1.4e-05[/C][C]7e-06[/C][/ROW]
[/TABLE]
Source: https://freestatistics.org/blog/index.php?pk=57572&T=2

Globally Unique Identifier (entire table): ba.freestatistics.org/blog/index.php?pk=57572&T=2

As an alternative you can also use a QR Code:  

The GUIDs for individual cells are displayed in the table below:

Multiple Linear Regression - Ordinary Least Squares
VariableParameterS.D.T-STATH0: parameter = 02-tail p-value1-tail p-value
(Intercept)105.024597642150.847463123.928200
Bel20-0.001565612849768380.000329-4.75321.4e-057e-06


Multiple Linear Regression - Regression Statistics
Multiple R0.52946860542578
R-squared0.28033700413152
Adjusted R-squared0.267929021444133
F-TEST (value)22.5932781495961
F-TEST (DF numerator)1
F-TEST (DF denominator)58
p-value1.36235912630012e-05
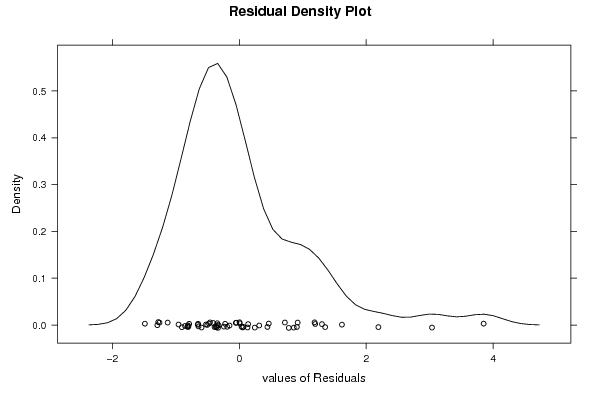
Multiple Linear Regression - Residual Statistics
Residual Standard Deviation1.01658362472473
Sum Squared Residuals59.9396514313913

\begin{tabular}{lllllllll}
\hline
Multiple Linear Regression - Regression Statistics \tabularnewline
Multiple R & 0.52946860542578 \tabularnewline
R-squared & 0.28033700413152 \tabularnewline
Adjusted R-squared & 0.267929021444133 \tabularnewline
F-TEST (value) & 22.5932781495961 \tabularnewline
F-TEST (DF numerator) & 1 \tabularnewline
F-TEST (DF denominator) & 58 \tabularnewline
p-value & 1.36235912630012e-05 \tabularnewline
Multiple Linear Regression - Residual Statistics \tabularnewline
Residual Standard Deviation & 1.01658362472473 \tabularnewline
Sum Squared Residuals & 59.9396514313913 \tabularnewline
\hline
\end{tabular}
%Source: https://freestatistics.org/blog/index.php?pk=57572&T=3

[TABLE]
[ROW][C]Multiple Linear Regression - Regression Statistics[/C][/ROW]
[ROW][C]Multiple R[/C][C]0.52946860542578[/C][/ROW]
[ROW][C]R-squared[/C][C]0.28033700413152[/C][/ROW]
[ROW][C]Adjusted R-squared[/C][C]0.267929021444133[/C][/ROW]
[ROW][C]F-TEST (value)[/C][C]22.5932781495961[/C][/ROW]
[ROW][C]F-TEST (DF numerator)[/C][C]1[/C][/ROW]
[ROW][C]F-TEST (DF denominator)[/C][C]58[/C][/ROW]
[ROW][C]p-value[/C][C]1.36235912630012e-05[/C][/ROW]
[ROW][C]Multiple Linear Regression - Residual Statistics[/C][/ROW]
[ROW][C]Residual Standard Deviation[/C][C]1.01658362472473[/C][/ROW]
[ROW][C]Sum Squared Residuals[/C][C]59.9396514313913[/C][/ROW]
[/TABLE]
Source: https://freestatistics.org/blog/index.php?pk=57572&T=3

Globally Unique Identifier (entire table): ba.freestatistics.org/blog/index.php?pk=57572&T=3

As an alternative you can also use a QR Code:  

The GUIDs for individual cells are displayed in the table below:

Multiple Linear Regression - Regression Statistics
Multiple R0.52946860542578
R-squared0.28033700413152
Adjusted R-squared0.267929021444133
F-TEST (value)22.5932781495961
F-TEST (DF numerator)1
F-TEST (DF denominator)58
p-value1.36235912630012e-05
Multiple Linear Regression - Residual Statistics
Residual Standard Deviation1.01658362472473
Sum Squared Residuals59.9396514313913


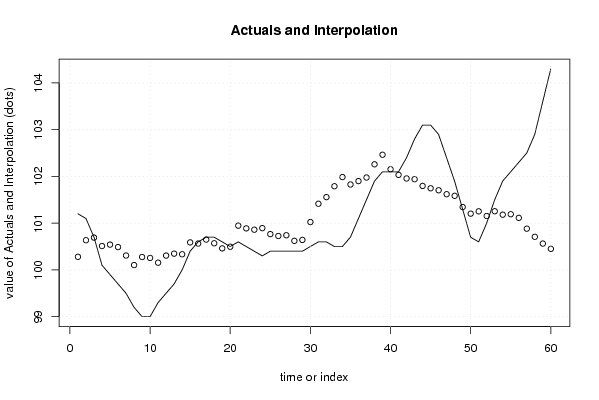
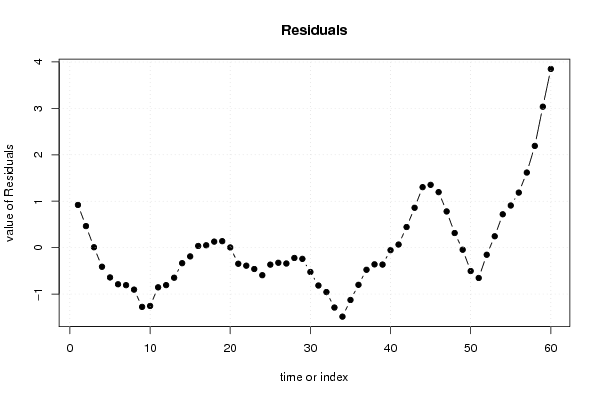
Multiple Linear Regression - Actuals, Interpolation, and Residuals
Time or IndexActualsInterpolationForecastResidualsPrediction Error
1101.2100.2803366796260.919663320374281
2101.1100.6354489862100.464551013790185
3100.7100.6915605507460.00843944925449507
4100.1100.511562041408-0.411562041407643
599.9100.541684432637-0.641684432637175
699.7100.4889232796-0.788923279599984
799.5100.308016714809-0.80801671480925
899.2100.103954735970-0.903954735970438
999100.276203461702-1.27620346170196
1099100.256085336582-1.25608533658243
1199.3100.154727560688-0.854727560688432
1299.5100.307030378714-0.807030378713897
1399.7100.347955498607-0.64795549860684
14100100.334726070026-0.334726070026299
15100.4100.588934628443-0.188934628443185
16100.6100.5642292576740.0357707423261485
17100.7100.6489758812320.0510241187681947
18100.7100.5700220252180.129977974782014
19100.6100.4608048728180.139195127181847
20100.5100.4958589445240.00414105547553943
21100.6100.947084223956-0.347084223956210
22100.5100.888796457559-0.388796457559328
23100.4100.860364928208-0.460364928207529
24100.3100.893681169651-0.593681169650608
25100.4100.765739287568-0.365739287567528
26100.4100.725612630228-0.325612630227964
27100.4100.741550569039-0.341550569038607
28100.4100.622563992456-0.222563992456210
29100.4100.641774062123-0.241774062122868
30100.5101.024018439394-0.524018439393823
31100.6101.415891335691-0.815891335690853
32100.6101.556843460555-0.9568434605555
33100.5101.79033896097-1.29033896096995
34100.5101.986541563303-1.48654156330292
35100.7101.827616202923-1.12761620292293
36101.1101.900620730108-0.800620730107641
37101.5101.976646890092-0.476646890092388
38101.9102.259881910744-0.359881910743979
39102.1102.464429229566-0.364429229566229
40102.1102.154171731128-0.0541717311276294
41102.1102.0336038855670.0663961144330334
42102.4101.9565131088440.44348689115564
43102.8101.9409665732460.859033426753831
44103.1101.7972276575091.30277234249106
45103.1101.7470184534171.35298154658313
46102.9101.7041206613331.1958793386668
47102.4101.6200785635580.779921436442366
48101.9101.5853845828070.314615417193233
49101.3101.344718575540-0.0447185755403801
50100.7101.204110885503-0.504110885502676
51100.6101.253599907684-0.653599907683864
52101101.153134531114-0.153134531114221
53101.5101.2552281450480.244771854952383
54101.9101.1816130288520.718386971148498
55102.1101.1918991052740.908100894725509
56102.3101.1139472414851.18605275851548
57102.5100.8825496622891.61745033771125
58102.9100.7085787624222.19142123757752
59103.6100.5637439176903.03625608230958
60104.3100.4507536383233.84924636167736

\begin{tabular}{lllllllll}
\hline
Multiple Linear Regression - Actuals, Interpolation, and Residuals \tabularnewline
Time or Index & Actuals & InterpolationForecast & ResidualsPrediction Error \tabularnewline
1 & 101.2 & 100.280336679626 & 0.919663320374281 \tabularnewline
2 & 101.1 & 100.635448986210 & 0.464551013790185 \tabularnewline
3 & 100.7 & 100.691560550746 & 0.00843944925449507 \tabularnewline
4 & 100.1 & 100.511562041408 & -0.411562041407643 \tabularnewline
5 & 99.9 & 100.541684432637 & -0.641684432637175 \tabularnewline
6 & 99.7 & 100.4889232796 & -0.788923279599984 \tabularnewline
7 & 99.5 & 100.308016714809 & -0.80801671480925 \tabularnewline
8 & 99.2 & 100.103954735970 & -0.903954735970438 \tabularnewline
9 & 99 & 100.276203461702 & -1.27620346170196 \tabularnewline
10 & 99 & 100.256085336582 & -1.25608533658243 \tabularnewline
11 & 99.3 & 100.154727560688 & -0.854727560688432 \tabularnewline
12 & 99.5 & 100.307030378714 & -0.807030378713897 \tabularnewline
13 & 99.7 & 100.347955498607 & -0.64795549860684 \tabularnewline
14 & 100 & 100.334726070026 & -0.334726070026299 \tabularnewline
15 & 100.4 & 100.588934628443 & -0.188934628443185 \tabularnewline
16 & 100.6 & 100.564229257674 & 0.0357707423261485 \tabularnewline
17 & 100.7 & 100.648975881232 & 0.0510241187681947 \tabularnewline
18 & 100.7 & 100.570022025218 & 0.129977974782014 \tabularnewline
19 & 100.6 & 100.460804872818 & 0.139195127181847 \tabularnewline
20 & 100.5 & 100.495858944524 & 0.00414105547553943 \tabularnewline
21 & 100.6 & 100.947084223956 & -0.347084223956210 \tabularnewline
22 & 100.5 & 100.888796457559 & -0.388796457559328 \tabularnewline
23 & 100.4 & 100.860364928208 & -0.460364928207529 \tabularnewline
24 & 100.3 & 100.893681169651 & -0.593681169650608 \tabularnewline
25 & 100.4 & 100.765739287568 & -0.365739287567528 \tabularnewline
26 & 100.4 & 100.725612630228 & -0.325612630227964 \tabularnewline
27 & 100.4 & 100.741550569039 & -0.341550569038607 \tabularnewline
28 & 100.4 & 100.622563992456 & -0.222563992456210 \tabularnewline
29 & 100.4 & 100.641774062123 & -0.241774062122868 \tabularnewline
30 & 100.5 & 101.024018439394 & -0.524018439393823 \tabularnewline
31 & 100.6 & 101.415891335691 & -0.815891335690853 \tabularnewline
32 & 100.6 & 101.556843460555 & -0.9568434605555 \tabularnewline
33 & 100.5 & 101.79033896097 & -1.29033896096995 \tabularnewline
34 & 100.5 & 101.986541563303 & -1.48654156330292 \tabularnewline
35 & 100.7 & 101.827616202923 & -1.12761620292293 \tabularnewline
36 & 101.1 & 101.900620730108 & -0.800620730107641 \tabularnewline
37 & 101.5 & 101.976646890092 & -0.476646890092388 \tabularnewline
38 & 101.9 & 102.259881910744 & -0.359881910743979 \tabularnewline
39 & 102.1 & 102.464429229566 & -0.364429229566229 \tabularnewline
40 & 102.1 & 102.154171731128 & -0.0541717311276294 \tabularnewline
41 & 102.1 & 102.033603885567 & 0.0663961144330334 \tabularnewline
42 & 102.4 & 101.956513108844 & 0.44348689115564 \tabularnewline
43 & 102.8 & 101.940966573246 & 0.859033426753831 \tabularnewline
44 & 103.1 & 101.797227657509 & 1.30277234249106 \tabularnewline
45 & 103.1 & 101.747018453417 & 1.35298154658313 \tabularnewline
46 & 102.9 & 101.704120661333 & 1.1958793386668 \tabularnewline
47 & 102.4 & 101.620078563558 & 0.779921436442366 \tabularnewline
48 & 101.9 & 101.585384582807 & 0.314615417193233 \tabularnewline
49 & 101.3 & 101.344718575540 & -0.0447185755403801 \tabularnewline
50 & 100.7 & 101.204110885503 & -0.504110885502676 \tabularnewline
51 & 100.6 & 101.253599907684 & -0.653599907683864 \tabularnewline
52 & 101 & 101.153134531114 & -0.153134531114221 \tabularnewline
53 & 101.5 & 101.255228145048 & 0.244771854952383 \tabularnewline
54 & 101.9 & 101.181613028852 & 0.718386971148498 \tabularnewline
55 & 102.1 & 101.191899105274 & 0.908100894725509 \tabularnewline
56 & 102.3 & 101.113947241485 & 1.18605275851548 \tabularnewline
57 & 102.5 & 100.882549662289 & 1.61745033771125 \tabularnewline
58 & 102.9 & 100.708578762422 & 2.19142123757752 \tabularnewline
59 & 103.6 & 100.563743917690 & 3.03625608230958 \tabularnewline
60 & 104.3 & 100.450753638323 & 3.84924636167736 \tabularnewline
\hline
\end{tabular}
%Source: https://freestatistics.org/blog/index.php?pk=57572&T=4

[TABLE]
[ROW][C]Multiple Linear Regression - Actuals, Interpolation, and Residuals[/C][/ROW]
[ROW][C]Time or Index[/C][C]Actuals[/C][C]InterpolationForecast[/C][C]ResidualsPrediction Error[/C][/ROW]
[ROW][C]1[/C][C]101.2[/C][C]100.280336679626[/C][C]0.919663320374281[/C][/ROW]
[ROW][C]2[/C][C]101.1[/C][C]100.635448986210[/C][C]0.464551013790185[/C][/ROW]
[ROW][C]3[/C][C]100.7[/C][C]100.691560550746[/C][C]0.00843944925449507[/C][/ROW]
[ROW][C]4[/C][C]100.1[/C][C]100.511562041408[/C][C]-0.411562041407643[/C][/ROW]
[ROW][C]5[/C][C]99.9[/C][C]100.541684432637[/C][C]-0.641684432637175[/C][/ROW]
[ROW][C]6[/C][C]99.7[/C][C]100.4889232796[/C][C]-0.788923279599984[/C][/ROW]
[ROW][C]7[/C][C]99.5[/C][C]100.308016714809[/C][C]-0.80801671480925[/C][/ROW]
[ROW][C]8[/C][C]99.2[/C][C]100.103954735970[/C][C]-0.903954735970438[/C][/ROW]
[ROW][C]9[/C][C]99[/C][C]100.276203461702[/C][C]-1.27620346170196[/C][/ROW]
[ROW][C]10[/C][C]99[/C][C]100.256085336582[/C][C]-1.25608533658243[/C][/ROW]
[ROW][C]11[/C][C]99.3[/C][C]100.154727560688[/C][C]-0.854727560688432[/C][/ROW]
[ROW][C]12[/C][C]99.5[/C][C]100.307030378714[/C][C]-0.807030378713897[/C][/ROW]
[ROW][C]13[/C][C]99.7[/C][C]100.347955498607[/C][C]-0.64795549860684[/C][/ROW]
[ROW][C]14[/C][C]100[/C][C]100.334726070026[/C][C]-0.334726070026299[/C][/ROW]
[ROW][C]15[/C][C]100.4[/C][C]100.588934628443[/C][C]-0.188934628443185[/C][/ROW]
[ROW][C]16[/C][C]100.6[/C][C]100.564229257674[/C][C]0.0357707423261485[/C][/ROW]
[ROW][C]17[/C][C]100.7[/C][C]100.648975881232[/C][C]0.0510241187681947[/C][/ROW]
[ROW][C]18[/C][C]100.7[/C][C]100.570022025218[/C][C]0.129977974782014[/C][/ROW]
[ROW][C]19[/C][C]100.6[/C][C]100.460804872818[/C][C]0.139195127181847[/C][/ROW]
[ROW][C]20[/C][C]100.5[/C][C]100.495858944524[/C][C]0.00414105547553943[/C][/ROW]
[ROW][C]21[/C][C]100.6[/C][C]100.947084223956[/C][C]-0.347084223956210[/C][/ROW]
[ROW][C]22[/C][C]100.5[/C][C]100.888796457559[/C][C]-0.388796457559328[/C][/ROW]
[ROW][C]23[/C][C]100.4[/C][C]100.860364928208[/C][C]-0.460364928207529[/C][/ROW]
[ROW][C]24[/C][C]100.3[/C][C]100.893681169651[/C][C]-0.593681169650608[/C][/ROW]
[ROW][C]25[/C][C]100.4[/C][C]100.765739287568[/C][C]-0.365739287567528[/C][/ROW]
[ROW][C]26[/C][C]100.4[/C][C]100.725612630228[/C][C]-0.325612630227964[/C][/ROW]
[ROW][C]27[/C][C]100.4[/C][C]100.741550569039[/C][C]-0.341550569038607[/C][/ROW]
[ROW][C]28[/C][C]100.4[/C][C]100.622563992456[/C][C]-0.222563992456210[/C][/ROW]
[ROW][C]29[/C][C]100.4[/C][C]100.641774062123[/C][C]-0.241774062122868[/C][/ROW]
[ROW][C]30[/C][C]100.5[/C][C]101.024018439394[/C][C]-0.524018439393823[/C][/ROW]
[ROW][C]31[/C][C]100.6[/C][C]101.415891335691[/C][C]-0.815891335690853[/C][/ROW]
[ROW][C]32[/C][C]100.6[/C][C]101.556843460555[/C][C]-0.9568434605555[/C][/ROW]
[ROW][C]33[/C][C]100.5[/C][C]101.79033896097[/C][C]-1.29033896096995[/C][/ROW]
[ROW][C]34[/C][C]100.5[/C][C]101.986541563303[/C][C]-1.48654156330292[/C][/ROW]
[ROW][C]35[/C][C]100.7[/C][C]101.827616202923[/C][C]-1.12761620292293[/C][/ROW]
[ROW][C]36[/C][C]101.1[/C][C]101.900620730108[/C][C]-0.800620730107641[/C][/ROW]
[ROW][C]37[/C][C]101.5[/C][C]101.976646890092[/C][C]-0.476646890092388[/C][/ROW]
[ROW][C]38[/C][C]101.9[/C][C]102.259881910744[/C][C]-0.359881910743979[/C][/ROW]
[ROW][C]39[/C][C]102.1[/C][C]102.464429229566[/C][C]-0.364429229566229[/C][/ROW]
[ROW][C]40[/C][C]102.1[/C][C]102.154171731128[/C][C]-0.0541717311276294[/C][/ROW]
[ROW][C]41[/C][C]102.1[/C][C]102.033603885567[/C][C]0.0663961144330334[/C][/ROW]
[ROW][C]42[/C][C]102.4[/C][C]101.956513108844[/C][C]0.44348689115564[/C][/ROW]
[ROW][C]43[/C][C]102.8[/C][C]101.940966573246[/C][C]0.859033426753831[/C][/ROW]
[ROW][C]44[/C][C]103.1[/C][C]101.797227657509[/C][C]1.30277234249106[/C][/ROW]
[ROW][C]45[/C][C]103.1[/C][C]101.747018453417[/C][C]1.35298154658313[/C][/ROW]
[ROW][C]46[/C][C]102.9[/C][C]101.704120661333[/C][C]1.1958793386668[/C][/ROW]
[ROW][C]47[/C][C]102.4[/C][C]101.620078563558[/C][C]0.779921436442366[/C][/ROW]
[ROW][C]48[/C][C]101.9[/C][C]101.585384582807[/C][C]0.314615417193233[/C][/ROW]
[ROW][C]49[/C][C]101.3[/C][C]101.344718575540[/C][C]-0.0447185755403801[/C][/ROW]
[ROW][C]50[/C][C]100.7[/C][C]101.204110885503[/C][C]-0.504110885502676[/C][/ROW]
[ROW][C]51[/C][C]100.6[/C][C]101.253599907684[/C][C]-0.653599907683864[/C][/ROW]
[ROW][C]52[/C][C]101[/C][C]101.153134531114[/C][C]-0.153134531114221[/C][/ROW]
[ROW][C]53[/C][C]101.5[/C][C]101.255228145048[/C][C]0.244771854952383[/C][/ROW]
[ROW][C]54[/C][C]101.9[/C][C]101.181613028852[/C][C]0.718386971148498[/C][/ROW]
[ROW][C]55[/C][C]102.1[/C][C]101.191899105274[/C][C]0.908100894725509[/C][/ROW]
[ROW][C]56[/C][C]102.3[/C][C]101.113947241485[/C][C]1.18605275851548[/C][/ROW]
[ROW][C]57[/C][C]102.5[/C][C]100.882549662289[/C][C]1.61745033771125[/C][/ROW]
[ROW][C]58[/C][C]102.9[/C][C]100.708578762422[/C][C]2.19142123757752[/C][/ROW]
[ROW][C]59[/C][C]103.6[/C][C]100.563743917690[/C][C]3.03625608230958[/C][/ROW]
[ROW][C]60[/C][C]104.3[/C][C]100.450753638323[/C][C]3.84924636167736[/C][/ROW]
[/TABLE]
Source: https://freestatistics.org/blog/index.php?pk=57572&T=4

Globally Unique Identifier (entire table): ba.freestatistics.org/blog/index.php?pk=57572&T=4

As an alternative you can also use a QR Code:  

The GUIDs for individual cells are displayed in the table below:

Multiple Linear Regression - Actuals, Interpolation, and Residuals
Time or IndexActualsInterpolationForecastResidualsPrediction Error
1101.2100.2803366796260.919663320374281
2101.1100.6354489862100.464551013790185
3100.7100.6915605507460.00843944925449507
4100.1100.511562041408-0.411562041407643
599.9100.541684432637-0.641684432637175
699.7100.4889232796-0.788923279599984
799.5100.308016714809-0.80801671480925
899.2100.103954735970-0.903954735970438
999100.276203461702-1.27620346170196
1099100.256085336582-1.25608533658243
1199.3100.154727560688-0.854727560688432
1299.5100.307030378714-0.807030378713897
1399.7100.347955498607-0.64795549860684
14100100.334726070026-0.334726070026299
15100.4100.588934628443-0.188934628443185
16100.6100.5642292576740.0357707423261485
17100.7100.6489758812320.0510241187681947
18100.7100.5700220252180.129977974782014
19100.6100.4608048728180.139195127181847
20100.5100.4958589445240.00414105547553943
21100.6100.947084223956-0.347084223956210
22100.5100.888796457559-0.388796457559328
23100.4100.860364928208-0.460364928207529
24100.3100.893681169651-0.593681169650608
25100.4100.765739287568-0.365739287567528
26100.4100.725612630228-0.325612630227964
27100.4100.741550569039-0.341550569038607
28100.4100.622563992456-0.222563992456210
29100.4100.641774062123-0.241774062122868
30100.5101.024018439394-0.524018439393823
31100.6101.415891335691-0.815891335690853
32100.6101.556843460555-0.9568434605555
33100.5101.79033896097-1.29033896096995
34100.5101.986541563303-1.48654156330292
35100.7101.827616202923-1.12761620292293
36101.1101.900620730108-0.800620730107641
37101.5101.976646890092-0.476646890092388
38101.9102.259881910744-0.359881910743979
39102.1102.464429229566-0.364429229566229
40102.1102.154171731128-0.0541717311276294
41102.1102.0336038855670.0663961144330334
42102.4101.9565131088440.44348689115564
43102.8101.9409665732460.859033426753831
44103.1101.7972276575091.30277234249106
45103.1101.7470184534171.35298154658313
46102.9101.7041206613331.1958793386668
47102.4101.6200785635580.779921436442366
48101.9101.5853845828070.314615417193233
49101.3101.344718575540-0.0447185755403801
50100.7101.204110885503-0.504110885502676
51100.6101.253599907684-0.653599907683864
52101101.153134531114-0.153134531114221
53101.5101.2552281450480.244771854952383
54101.9101.1816130288520.718386971148498
55102.1101.1918991052740.908100894725509
56102.3101.1139472414851.18605275851548
57102.5100.8825496622891.61745033771125
58102.9100.7085787624222.19142123757752
59103.6100.5637439176903.03625608230958
60104.3100.4507536383233.84924636167736


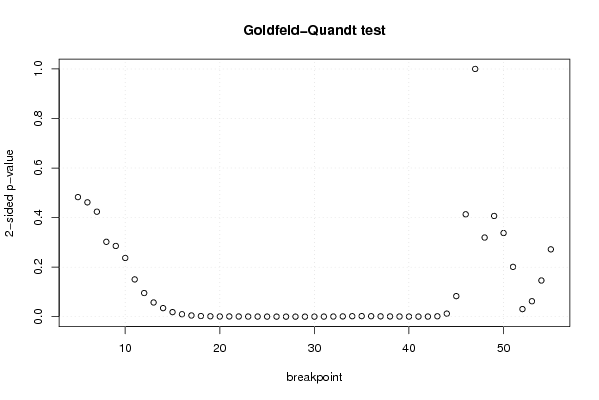
Goldfeld-Quandt test for Heteroskedasticity
p-valuesAlternative Hypothesis
breakpoint indexgreater2-sidedless
50.2413719383136200.4827438766272390.75862806168638
60.2307821352708070.4615642705416140.769217864729193
70.2118592250930720.4237184501861430.788140774906928
80.1511110974772940.3022221949545880.848888902522706
90.1427345485999290.2854690971998580.857265451400071
100.1185016503202010.2370033006404030.881498349679799
110.07521967969233270.1504393593846650.924780320307667
120.04772313061732930.09544626123465850.95227686938267
130.02866740663417940.05733481326835880.97133259336582
140.01729998266184280.03459996532368550.982700017338157
150.009190606430750370.01838121286150070.99080939356925
160.004960689928447070.009921379856894130.995039310071553
170.00243079281848670.00486158563697340.997569207181513
180.001276557513688730.002553115027377460.998723442486311
190.000811270430815260.001622540861630520.999188729569185
200.0004196280498026660.0008392560996053320.999580371950197
210.000485490530067130.000970981060134260.999514509469933
220.0003630096634223590.0007260193268447190.999636990336578
230.0002642640926863050.0005285281853726090.999735735907314
240.0002322384228728290.0004644768457456570.999767761577127
250.0001432091287019270.0002864182574038540.999856790871298
269.13773895548201e-050.0001827547791096400.999908622610445
276.44892410824026e-050.0001289784821648050.999935510758918
285.3757833202351e-050.0001075156664047020.999946242166798
295.82856594215919e-050.0001165713188431840.999941714340578
308.40921699437727e-050.0001681843398875450.999915907830056
310.000168744746408590.000337489492817180.999831255253591
320.0002819205056977420.0005638410113954830.999718079494302
330.000560397765390840.001120795530781680.99943960223461
340.0009571421740982450.001914284348196490.999042857825902
350.001121535323629340.002243070647258690.99887846467637
360.0009160825255582930.001832165051116590.999083917474442
370.0006887914842749260.001377582968549850.999311208515725
380.0004919068528379080.0009838137056758170.999508093147162
390.0003237132924069750.000647426584813950.999676286707593
400.0002477640430120290.0004955280860240570.999752235956988
410.0001906795050718370.0003813590101436750.999809320494928
420.0002482571655687810.0004965143311375620.999751742834431
430.0007992004969231610.001598400993846320.999200799503077
440.006159137486162460.01231827497232490.993840862513838
450.04147750332439090.08295500664878180.95852249667561
460.2066387769713250.4132775539426510.793361223028675
470.5000163554607880.9999672890784240.499983644539212
480.8402882486413350.319423502717330.159711751358665
490.7967192056372040.4065615887255910.203280794362796
500.8311795056449610.3376409887100790.168820494355039
510.8994668234466790.2010663531066420.100533176553321
520.9846802841119430.03063943177611350.0153197158880568
530.9688264114840340.06234717703193110.0311735885159656
540.9269580615172070.1460838769655860.073041938482793
550.864103771805520.2717924563889610.135896228194481

\begin{tabular}{lllllllll}
\hline
Goldfeld-Quandt test for Heteroskedasticity \tabularnewline
p-values & Alternative Hypothesis \tabularnewline
breakpoint index & greater & 2-sided & less \tabularnewline
5 & 0.241371938313620 & 0.482743876627239 & 0.75862806168638 \tabularnewline
6 & 0.230782135270807 & 0.461564270541614 & 0.769217864729193 \tabularnewline
7 & 0.211859225093072 & 0.423718450186143 & 0.788140774906928 \tabularnewline
8 & 0.151111097477294 & 0.302222194954588 & 0.848888902522706 \tabularnewline
9 & 0.142734548599929 & 0.285469097199858 & 0.857265451400071 \tabularnewline
10 & 0.118501650320201 & 0.237003300640403 & 0.881498349679799 \tabularnewline
11 & 0.0752196796923327 & 0.150439359384665 & 0.924780320307667 \tabularnewline
12 & 0.0477231306173293 & 0.0954462612346585 & 0.95227686938267 \tabularnewline
13 & 0.0286674066341794 & 0.0573348132683588 & 0.97133259336582 \tabularnewline
14 & 0.0172999826618428 & 0.0345999653236855 & 0.982700017338157 \tabularnewline
15 & 0.00919060643075037 & 0.0183812128615007 & 0.99080939356925 \tabularnewline
16 & 0.00496068992844707 & 0.00992137985689413 & 0.995039310071553 \tabularnewline
17 & 0.0024307928184867 & 0.0048615856369734 & 0.997569207181513 \tabularnewline
18 & 0.00127655751368873 & 0.00255311502737746 & 0.998723442486311 \tabularnewline
19 & 0.00081127043081526 & 0.00162254086163052 & 0.999188729569185 \tabularnewline
20 & 0.000419628049802666 & 0.000839256099605332 & 0.999580371950197 \tabularnewline
21 & 0.00048549053006713 & 0.00097098106013426 & 0.999514509469933 \tabularnewline
22 & 0.000363009663422359 & 0.000726019326844719 & 0.999636990336578 \tabularnewline
23 & 0.000264264092686305 & 0.000528528185372609 & 0.999735735907314 \tabularnewline
24 & 0.000232238422872829 & 0.000464476845745657 & 0.999767761577127 \tabularnewline
25 & 0.000143209128701927 & 0.000286418257403854 & 0.999856790871298 \tabularnewline
26 & 9.13773895548201e-05 & 0.000182754779109640 & 0.999908622610445 \tabularnewline
27 & 6.44892410824026e-05 & 0.000128978482164805 & 0.999935510758918 \tabularnewline
28 & 5.3757833202351e-05 & 0.000107515666404702 & 0.999946242166798 \tabularnewline
29 & 5.82856594215919e-05 & 0.000116571318843184 & 0.999941714340578 \tabularnewline
30 & 8.40921699437727e-05 & 0.000168184339887545 & 0.999915907830056 \tabularnewline
31 & 0.00016874474640859 & 0.00033748949281718 & 0.999831255253591 \tabularnewline
32 & 0.000281920505697742 & 0.000563841011395483 & 0.999718079494302 \tabularnewline
33 & 0.00056039776539084 & 0.00112079553078168 & 0.99943960223461 \tabularnewline
34 & 0.000957142174098245 & 0.00191428434819649 & 0.999042857825902 \tabularnewline
35 & 0.00112153532362934 & 0.00224307064725869 & 0.99887846467637 \tabularnewline
36 & 0.000916082525558293 & 0.00183216505111659 & 0.999083917474442 \tabularnewline
37 & 0.000688791484274926 & 0.00137758296854985 & 0.999311208515725 \tabularnewline
38 & 0.000491906852837908 & 0.000983813705675817 & 0.999508093147162 \tabularnewline
39 & 0.000323713292406975 & 0.00064742658481395 & 0.999676286707593 \tabularnewline
40 & 0.000247764043012029 & 0.000495528086024057 & 0.999752235956988 \tabularnewline
41 & 0.000190679505071837 & 0.000381359010143675 & 0.999809320494928 \tabularnewline
42 & 0.000248257165568781 & 0.000496514331137562 & 0.999751742834431 \tabularnewline
43 & 0.000799200496923161 & 0.00159840099384632 & 0.999200799503077 \tabularnewline
44 & 0.00615913748616246 & 0.0123182749723249 & 0.993840862513838 \tabularnewline
45 & 0.0414775033243909 & 0.0829550066487818 & 0.95852249667561 \tabularnewline
46 & 0.206638776971325 & 0.413277553942651 & 0.793361223028675 \tabularnewline
47 & 0.500016355460788 & 0.999967289078424 & 0.499983644539212 \tabularnewline
48 & 0.840288248641335 & 0.31942350271733 & 0.159711751358665 \tabularnewline
49 & 0.796719205637204 & 0.406561588725591 & 0.203280794362796 \tabularnewline
50 & 0.831179505644961 & 0.337640988710079 & 0.168820494355039 \tabularnewline
51 & 0.899466823446679 & 0.201066353106642 & 0.100533176553321 \tabularnewline
52 & 0.984680284111943 & 0.0306394317761135 & 0.0153197158880568 \tabularnewline
53 & 0.968826411484034 & 0.0623471770319311 & 0.0311735885159656 \tabularnewline
54 & 0.926958061517207 & 0.146083876965586 & 0.073041938482793 \tabularnewline
55 & 0.86410377180552 & 0.271792456388961 & 0.135896228194481 \tabularnewline
\hline
\end{tabular}
%Source: https://freestatistics.org/blog/index.php?pk=57572&T=5

[TABLE]
[ROW][C]Goldfeld-Quandt test for Heteroskedasticity[/C][/ROW]
[ROW][C]p-values[/C][C]Alternative Hypothesis[/C][/ROW]
[ROW][C]breakpoint index[/C][C]greater[/C][C]2-sided[/C][C]less[/C][/ROW]
[ROW][C]5[/C][C]0.241371938313620[/C][C]0.482743876627239[/C][C]0.75862806168638[/C][/ROW]
[ROW][C]6[/C][C]0.230782135270807[/C][C]0.461564270541614[/C][C]0.769217864729193[/C][/ROW]
[ROW][C]7[/C][C]0.211859225093072[/C][C]0.423718450186143[/C][C]0.788140774906928[/C][/ROW]
[ROW][C]8[/C][C]0.151111097477294[/C][C]0.302222194954588[/C][C]0.848888902522706[/C][/ROW]
[ROW][C]9[/C][C]0.142734548599929[/C][C]0.285469097199858[/C][C]0.857265451400071[/C][/ROW]
[ROW][C]10[/C][C]0.118501650320201[/C][C]0.237003300640403[/C][C]0.881498349679799[/C][/ROW]
[ROW][C]11[/C][C]0.0752196796923327[/C][C]0.150439359384665[/C][C]0.924780320307667[/C][/ROW]
[ROW][C]12[/C][C]0.0477231306173293[/C][C]0.0954462612346585[/C][C]0.95227686938267[/C][/ROW]
[ROW][C]13[/C][C]0.0286674066341794[/C][C]0.0573348132683588[/C][C]0.97133259336582[/C][/ROW]
[ROW][C]14[/C][C]0.0172999826618428[/C][C]0.0345999653236855[/C][C]0.982700017338157[/C][/ROW]
[ROW][C]15[/C][C]0.00919060643075037[/C][C]0.0183812128615007[/C][C]0.99080939356925[/C][/ROW]
[ROW][C]16[/C][C]0.00496068992844707[/C][C]0.00992137985689413[/C][C]0.995039310071553[/C][/ROW]
[ROW][C]17[/C][C]0.0024307928184867[/C][C]0.0048615856369734[/C][C]0.997569207181513[/C][/ROW]
[ROW][C]18[/C][C]0.00127655751368873[/C][C]0.00255311502737746[/C][C]0.998723442486311[/C][/ROW]
[ROW][C]19[/C][C]0.00081127043081526[/C][C]0.00162254086163052[/C][C]0.999188729569185[/C][/ROW]
[ROW][C]20[/C][C]0.000419628049802666[/C][C]0.000839256099605332[/C][C]0.999580371950197[/C][/ROW]
[ROW][C]21[/C][C]0.00048549053006713[/C][C]0.00097098106013426[/C][C]0.999514509469933[/C][/ROW]
[ROW][C]22[/C][C]0.000363009663422359[/C][C]0.000726019326844719[/C][C]0.999636990336578[/C][/ROW]
[ROW][C]23[/C][C]0.000264264092686305[/C][C]0.000528528185372609[/C][C]0.999735735907314[/C][/ROW]
[ROW][C]24[/C][C]0.000232238422872829[/C][C]0.000464476845745657[/C][C]0.999767761577127[/C][/ROW]
[ROW][C]25[/C][C]0.000143209128701927[/C][C]0.000286418257403854[/C][C]0.999856790871298[/C][/ROW]
[ROW][C]26[/C][C]9.13773895548201e-05[/C][C]0.000182754779109640[/C][C]0.999908622610445[/C][/ROW]
[ROW][C]27[/C][C]6.44892410824026e-05[/C][C]0.000128978482164805[/C][C]0.999935510758918[/C][/ROW]
[ROW][C]28[/C][C]5.3757833202351e-05[/C][C]0.000107515666404702[/C][C]0.999946242166798[/C][/ROW]
[ROW][C]29[/C][C]5.82856594215919e-05[/C][C]0.000116571318843184[/C][C]0.999941714340578[/C][/ROW]
[ROW][C]30[/C][C]8.40921699437727e-05[/C][C]0.000168184339887545[/C][C]0.999915907830056[/C][/ROW]
[ROW][C]31[/C][C]0.00016874474640859[/C][C]0.00033748949281718[/C][C]0.999831255253591[/C][/ROW]
[ROW][C]32[/C][C]0.000281920505697742[/C][C]0.000563841011395483[/C][C]0.999718079494302[/C][/ROW]
[ROW][C]33[/C][C]0.00056039776539084[/C][C]0.00112079553078168[/C][C]0.99943960223461[/C][/ROW]
[ROW][C]34[/C][C]0.000957142174098245[/C][C]0.00191428434819649[/C][C]0.999042857825902[/C][/ROW]
[ROW][C]35[/C][C]0.00112153532362934[/C][C]0.00224307064725869[/C][C]0.99887846467637[/C][/ROW]
[ROW][C]36[/C][C]0.000916082525558293[/C][C]0.00183216505111659[/C][C]0.999083917474442[/C][/ROW]
[ROW][C]37[/C][C]0.000688791484274926[/C][C]0.00137758296854985[/C][C]0.999311208515725[/C][/ROW]
[ROW][C]38[/C][C]0.000491906852837908[/C][C]0.000983813705675817[/C][C]0.999508093147162[/C][/ROW]
[ROW][C]39[/C][C]0.000323713292406975[/C][C]0.00064742658481395[/C][C]0.999676286707593[/C][/ROW]
[ROW][C]40[/C][C]0.000247764043012029[/C][C]0.000495528086024057[/C][C]0.999752235956988[/C][/ROW]
[ROW][C]41[/C][C]0.000190679505071837[/C][C]0.000381359010143675[/C][C]0.999809320494928[/C][/ROW]
[ROW][C]42[/C][C]0.000248257165568781[/C][C]0.000496514331137562[/C][C]0.999751742834431[/C][/ROW]
[ROW][C]43[/C][C]0.000799200496923161[/C][C]0.00159840099384632[/C][C]0.999200799503077[/C][/ROW]
[ROW][C]44[/C][C]0.00615913748616246[/C][C]0.0123182749723249[/C][C]0.993840862513838[/C][/ROW]
[ROW][C]45[/C][C]0.0414775033243909[/C][C]0.0829550066487818[/C][C]0.95852249667561[/C][/ROW]
[ROW][C]46[/C][C]0.206638776971325[/C][C]0.413277553942651[/C][C]0.793361223028675[/C][/ROW]
[ROW][C]47[/C][C]0.500016355460788[/C][C]0.999967289078424[/C][C]0.499983644539212[/C][/ROW]
[ROW][C]48[/C][C]0.840288248641335[/C][C]0.31942350271733[/C][C]0.159711751358665[/C][/ROW]
[ROW][C]49[/C][C]0.796719205637204[/C][C]0.406561588725591[/C][C]0.203280794362796[/C][/ROW]
[ROW][C]50[/C][C]0.831179505644961[/C][C]0.337640988710079[/C][C]0.168820494355039[/C][/ROW]
[ROW][C]51[/C][C]0.899466823446679[/C][C]0.201066353106642[/C][C]0.100533176553321[/C][/ROW]
[ROW][C]52[/C][C]0.984680284111943[/C][C]0.0306394317761135[/C][C]0.0153197158880568[/C][/ROW]
[ROW][C]53[/C][C]0.968826411484034[/C][C]0.0623471770319311[/C][C]0.0311735885159656[/C][/ROW]
[ROW][C]54[/C][C]0.926958061517207[/C][C]0.146083876965586[/C][C]0.073041938482793[/C][/ROW]
[ROW][C]55[/C][C]0.86410377180552[/C][C]0.271792456388961[/C][C]0.135896228194481[/C][/ROW]
[/TABLE]
Source: https://freestatistics.org/blog/index.php?pk=57572&T=5

Globally Unique Identifier (entire table): ba.freestatistics.org/blog/index.php?pk=57572&T=5

As an alternative you can also use a QR Code:  

The GUIDs for individual cells are displayed in the table below:

Goldfeld-Quandt test for Heteroskedasticity
p-valuesAlternative Hypothesis
breakpoint indexgreater2-sidedless
50.2413719383136200.4827438766272390.75862806168638
60.2307821352708070.4615642705416140.769217864729193
70.2118592250930720.4237184501861430.788140774906928
80.1511110974772940.3022221949545880.848888902522706
90.1427345485999290.2854690971998580.857265451400071
100.1185016503202010.2370033006404030.881498349679799
110.07521967969233270.1504393593846650.924780320307667
120.04772313061732930.09544626123465850.95227686938267
130.02866740663417940.05733481326835880.97133259336582
140.01729998266184280.03459996532368550.982700017338157
150.009190606430750370.01838121286150070.99080939356925
160.004960689928447070.009921379856894130.995039310071553
170.00243079281848670.00486158563697340.997569207181513
180.001276557513688730.002553115027377460.998723442486311
190.000811270430815260.001622540861630520.999188729569185
200.0004196280498026660.0008392560996053320.999580371950197
210.000485490530067130.000970981060134260.999514509469933
220.0003630096634223590.0007260193268447190.999636990336578
230.0002642640926863050.0005285281853726090.999735735907314
240.0002322384228728290.0004644768457456570.999767761577127
250.0001432091287019270.0002864182574038540.999856790871298
269.13773895548201e-050.0001827547791096400.999908622610445
276.44892410824026e-050.0001289784821648050.999935510758918
285.3757833202351e-050.0001075156664047020.999946242166798
295.82856594215919e-050.0001165713188431840.999941714340578
308.40921699437727e-050.0001681843398875450.999915907830056
310.000168744746408590.000337489492817180.999831255253591
320.0002819205056977420.0005638410113954830.999718079494302
330.000560397765390840.001120795530781680.99943960223461
340.0009571421740982450.001914284348196490.999042857825902
350.001121535323629340.002243070647258690.99887846467637
360.0009160825255582930.001832165051116590.999083917474442
370.0006887914842749260.001377582968549850.999311208515725
380.0004919068528379080.0009838137056758170.999508093147162
390.0003237132924069750.000647426584813950.999676286707593
400.0002477640430120290.0004955280860240570.999752235956988
410.0001906795050718370.0003813590101436750.999809320494928
420.0002482571655687810.0004965143311375620.999751742834431
430.0007992004969231610.001598400993846320.999200799503077
440.006159137486162460.01231827497232490.993840862513838
450.04147750332439090.08295500664878180.95852249667561
460.2066387769713250.4132775539426510.793361223028675
470.5000163554607880.9999672890784240.499983644539212
480.8402882486413350.319423502717330.159711751358665
490.7967192056372040.4065615887255910.203280794362796
500.8311795056449610.3376409887100790.168820494355039
510.8994668234466790.2010663531066420.100533176553321
520.9846802841119430.03063943177611350.0153197158880568
530.9688264114840340.06234717703193110.0311735885159656
540.9269580615172070.1460838769655860.073041938482793
550.864103771805520.2717924563889610.135896228194481


Meta Analysis of Goldfeld-Quandt test for Heteroskedasticity
Description# significant tests% significant testsOK/NOK
1% type I error level280.549019607843137NOK
5% type I error level320.627450980392157NOK
10% type I error level360.705882352941177NOK

\begin{tabular}{lllllllll}
\hline
Meta Analysis of Goldfeld-Quandt test for Heteroskedasticity \tabularnewline
Description & # significant tests & % significant tests & OK/NOK \tabularnewline
1% type I error level & 28 & 0.549019607843137 & NOK \tabularnewline
5% type I error level & 32 & 0.627450980392157 & NOK \tabularnewline
10% type I error level & 36 & 0.705882352941177 & NOK \tabularnewline
\hline
\end{tabular}
%Source: https://freestatistics.org/blog/index.php?pk=57572&T=6

[TABLE]
[ROW][C]Meta Analysis of Goldfeld-Quandt test for Heteroskedasticity[/C][/ROW]
[ROW][C]Description[/C][C]# significant tests[/C][C]% significant tests[/C][C]OK/NOK[/C][/ROW]
[ROW][C]1% type I error level[/C][C]28[/C][C]0.549019607843137[/C][C]NOK[/C][/ROW]
[ROW][C]5% type I error level[/C][C]32[/C][C]0.627450980392157[/C][C]NOK[/C][/ROW]
[ROW][C]10% type I error level[/C][C]36[/C][C]0.705882352941177[/C][C]NOK[/C][/ROW]
[/TABLE]
Source: https://freestatistics.org/blog/index.php?pk=57572&T=6

Globally Unique Identifier (entire table): ba.freestatistics.org/blog/index.php?pk=57572&T=6

As an alternative you can also use a QR Code:  

The GUIDs for individual cells are displayed in the table below:

Meta Analysis of Goldfeld-Quandt test for Heteroskedasticity
Description# significant tests% significant testsOK/NOK
1% type I error level280.549019607843137NOK
5% type I error level320.627450980392157NOK
10% type I error level360.705882352941177NOK


Parameters (Session):
par1 = 1 ; par2 = Include Monthly Dummies ; par3 = Linear Trend ;
Parameters (R input):
par1 = 2 ; par2 = Do not include Seasonal Dummies ; par3 = No Linear Trend ;
R code (references can be found in the software module):
library(lattice)
library(lmtest)
n25 <- 25 #minimum number of obs. for Goldfeld-Quandt test
par1 <- as.numeric(par1)
x <- t(y)
k <- length(x[1,])
n <- length(x[,1])
x1 <- cbind(x[,par1], x[,1:k!=par1])
mycolnames <- c(colnames(x)[par1], colnames(x)[1:k!=par1])
colnames(x1) <- mycolnames #colnames(x)[par1]
x <- x1
if (par3 == 'First Differences'){
x2 <- array(0, dim=c(n-1,k), dimnames=list(1:(n-1), paste('(1-B)',colnames(x),sep='')))
for (i in 1:n-1) {
for (j in 1:k) {
x2[i,j] <- x[i+1,j] - x[i,j]
}
}
x <- x2
}
if (par2 == 'Include Monthly Dummies'){
x2 <- array(0, dim=c(n,11), dimnames=list(1:n, paste('M', seq(1:11), sep ='')))
for (i in 1:11){
x2[seq(i,n,12),i] <- 1
}
x <- cbind(x, x2)
}
if (par2 == 'Include Quarterly Dummies'){
x2 <- array(0, dim=c(n,3), dimnames=list(1:n, paste('Q', seq(1:3), sep ='')))
for (i in 1:3){
x2[seq(i,n,4),i] <- 1
}
x <- cbind(x, x2)
}
k <- length(x[1,])
if (par3 == 'Linear Trend'){
x <- cbind(x, c(1:n))
colnames(x)[k+1] <- 't'
}
x
k <- length(x[1,])
df <- as.data.frame(x)
(mylm <- lm(df))
(mysum <- summary(mylm))
if (n > n25) {
kp3 <- k + 3
nmkm3 <- n - k - 3
gqarr <- array(NA, dim=c(nmkm3-kp3+1,3))
numgqtests <- 0
numsignificant1 <- 0
numsignificant5 <- 0
numsignificant10 <- 0
for (mypoint in kp3:nmkm3) {
j <- 0
numgqtests <- numgqtests + 1
for (myalt in c('greater', 'two.sided', 'less')) {
j <- j + 1
gqarr[mypoint-kp3+1,j] <- gqtest(mylm, point=mypoint, alternative=myalt)$p.value
}
if (gqarr[mypoint-kp3+1,2] < 0.01) numsignificant1 <- numsignificant1 + 1
if (gqarr[mypoint-kp3+1,2] < 0.05) numsignificant5 <- numsignificant5 + 1
if (gqarr[mypoint-kp3+1,2] < 0.10) numsignificant10 <- numsignificant10 + 1
}
gqarr
}
bitmap(file='test0.png')
plot(x[,1], type='l', main='Actuals and Interpolation', ylab='value of Actuals and Interpolation (dots)', xlab='time or index')
points(x[,1]-mysum$resid)
grid()
dev.off()
bitmap(file='test1.png')
plot(mysum$resid, type='b', pch=19, main='Residuals', ylab='value of Residuals', xlab='time or index')
grid()
dev.off()
bitmap(file='test2.png')
hist(mysum$resid, main='Residual Histogram', xlab='values of Residuals')
grid()
dev.off()
bitmap(file='test3.png')
densityplot(~mysum$resid,col='black',main='Residual Density Plot', xlab='values of Residuals')
dev.off()
bitmap(file='test4.png')
qqnorm(mysum$resid, main='Residual Normal Q-Q Plot')
qqline(mysum$resid)
grid()
dev.off()
(myerror <- as.ts(mysum$resid))
bitmap(file='test5.png')
dum <- cbind(lag(myerror,k=1),myerror)
dum
dum1 <- dum[2:length(myerror),]
dum1
z <- as.data.frame(dum1)
z
plot(z,main=paste('Residual Lag plot, lowess, and regression line'), ylab='values of Residuals', xlab='lagged values of Residuals')
lines(lowess(z))
abline(lm(z))
grid()
dev.off()
bitmap(file='test6.png')
acf(mysum$resid, lag.max=length(mysum$resid)/2, main='Residual Autocorrelation Function')
grid()
dev.off()
bitmap(file='test7.png')
pacf(mysum$resid, lag.max=length(mysum$resid)/2, main='Residual Partial Autocorrelation Function')
grid()
dev.off()
bitmap(file='test8.png')
opar <- par(mfrow = c(2,2), oma = c(0, 0, 1.1, 0))
plot(mylm, las = 1, sub='Residual Diagnostics')
par(opar)
dev.off()
if (n > n25) {
bitmap(file='test9.png')
plot(kp3:nmkm3,gqarr[,2], main='Goldfeld-Quandt test',ylab='2-sided p-value',xlab='breakpoint')
grid()
dev.off()
}
load(file='createtable')
a<-table.start()
a<-table.row.start(a)
a<-table.element(a, 'Multiple Linear Regression - Estimated Regression Equation', 1, TRUE)
a<-table.row.end(a)
myeq <- colnames(x)[1]
myeq <- paste(myeq, '[t] = ', sep='')
for (i in 1:k){
if (mysum$coefficients[i,1] > 0) myeq <- paste(myeq, '+', '')
myeq <- paste(myeq, mysum$coefficients[i,1], sep=' ')
if (rownames(mysum$coefficients)[i] != '(Intercept)') {
myeq <- paste(myeq, rownames(mysum$coefficients)[i], sep='')
if (rownames(mysum$coefficients)[i] != 't') myeq <- paste(myeq, '[t]', sep='')
}
}
myeq <- paste(myeq, ' + e[t]')
a<-table.row.start(a)
a<-table.element(a, myeq)
a<-table.row.end(a)
a<-table.end(a)
table.save(a,file='mytable1.tab')
a<-table.start()
a<-table.row.start(a)
a<-table.element(a,hyperlink('ols1.htm','Multiple Linear Regression - Ordinary Least Squares',''), 6, TRUE)
a<-table.row.end(a)
a<-table.row.start(a)
a<-table.element(a,'Variable',header=TRUE)
a<-table.element(a,'Parameter',header=TRUE)
a<-table.element(a,'S.D.',header=TRUE)
a<-table.element(a,'T-STAT
H0: parameter = 0',header=TRUE)
a<-table.element(a,'2-tail p-value',header=TRUE)
a<-table.element(a,'1-tail p-value',header=TRUE)
a<-table.row.end(a)
for (i in 1:k){
a<-table.row.start(a)
a<-table.element(a,rownames(mysum$coefficients)[i],header=TRUE)
a<-table.element(a,mysum$coefficients[i,1])
a<-table.element(a, round(mysum$coefficients[i,2],6))
a<-table.element(a, round(mysum$coefficients[i,3],4))
a<-table.element(a, round(mysum$coefficients[i,4],6))
a<-table.element(a, round(mysum$coefficients[i,4]/2,6))
a<-table.row.end(a)
}
a<-table.end(a)
table.save(a,file='mytable2.tab')
a<-table.start()
a<-table.row.start(a)
a<-table.element(a, 'Multiple Linear Regression - Regression Statistics', 2, TRUE)
a<-table.row.end(a)
a<-table.row.start(a)
a<-table.element(a, 'Multiple R',1,TRUE)
a<-table.element(a, sqrt(mysum$r.squared))
a<-table.row.end(a)
a<-table.row.start(a)
a<-table.element(a, 'R-squared',1,TRUE)
a<-table.element(a, mysum$r.squared)
a<-table.row.end(a)
a<-table.row.start(a)
a<-table.element(a, 'Adjusted R-squared',1,TRUE)
a<-table.element(a, mysum$adj.r.squared)
a<-table.row.end(a)
a<-table.row.start(a)
a<-table.element(a, 'F-TEST (value)',1,TRUE)
a<-table.element(a, mysum$fstatistic[1])
a<-table.row.end(a)
a<-table.row.start(a)
a<-table.element(a, 'F-TEST (DF numerator)',1,TRUE)
a<-table.element(a, mysum$fstatistic[2])
a<-table.row.end(a)
a<-table.row.start(a)
a<-table.element(a, 'F-TEST (DF denominator)',1,TRUE)
a<-table.element(a, mysum$fstatistic[3])
a<-table.row.end(a)
a<-table.row.start(a)
a<-table.element(a, 'p-value',1,TRUE)
a<-table.element(a, 1-pf(mysum$fstatistic[1],mysum$fstatistic[2],mysum$fstatistic[3]))
a<-table.row.end(a)
a<-table.row.start(a)
a<-table.element(a, 'Multiple Linear Regression - Residual Statistics', 2, TRUE)
a<-table.row.end(a)
a<-table.row.start(a)
a<-table.element(a, 'Residual Standard Deviation',1,TRUE)
a<-table.element(a, mysum$sigma)
a<-table.row.end(a)
a<-table.row.start(a)
a<-table.element(a, 'Sum Squared Residuals',1,TRUE)
a<-table.element(a, sum(myerror*myerror))
a<-table.row.end(a)
a<-table.end(a)
table.save(a,file='mytable3.tab')
a<-table.start()
a<-table.row.start(a)
a<-table.element(a, 'Multiple Linear Regression - Actuals, Interpolation, and Residuals', 4, TRUE)
a<-table.row.end(a)
a<-table.row.start(a)
a<-table.element(a, 'Time or Index', 1, TRUE)
a<-table.element(a, 'Actuals', 1, TRUE)
a<-table.element(a, 'Interpolation
Forecast', 1, TRUE)
a<-table.element(a, 'Residuals
Prediction Error', 1, TRUE)
a<-table.row.end(a)
for (i in 1:n) {
a<-table.row.start(a)
a<-table.element(a,i, 1, TRUE)
a<-table.element(a,x[i])
a<-table.element(a,x[i]-mysum$resid[i])
a<-table.element(a,mysum$resid[i])
a<-table.row.end(a)
}
a<-table.end(a)
table.save(a,file='mytable4.tab')
if (n > n25) {
a<-table.start()
a<-table.row.start(a)
a<-table.element(a,'Goldfeld-Quandt test for Heteroskedasticity',4,TRUE)
a<-table.row.end(a)
a<-table.row.start(a)
a<-table.element(a,'p-values',header=TRUE)
a<-table.element(a,'Alternative Hypothesis',3,header=TRUE)
a<-table.row.end(a)
a<-table.row.start(a)
a<-table.element(a,'breakpoint index',header=TRUE)
a<-table.element(a,'greater',header=TRUE)
a<-table.element(a,'2-sided',header=TRUE)
a<-table.element(a,'less',header=TRUE)
a<-table.row.end(a)
for (mypoint in kp3:nmkm3) {
a<-table.row.start(a)
a<-table.element(a,mypoint,header=TRUE)
a<-table.element(a,gqarr[mypoint-kp3+1,1])
a<-table.element(a,gqarr[mypoint-kp3+1,2])
a<-table.element(a,gqarr[mypoint-kp3+1,3])
a<-table.row.end(a)
}
a<-table.end(a)
table.save(a,file='mytable5.tab')
a<-table.start()
a<-table.row.start(a)
a<-table.element(a,'Meta Analysis of Goldfeld-Quandt test for Heteroskedasticity',4,TRUE)
a<-table.row.end(a)
a<-table.row.start(a)
a<-table.element(a,'Description',header=TRUE)
a<-table.element(a,'# significant tests',header=TRUE)
a<-table.element(a,'% significant tests',header=TRUE)
a<-table.element(a,'OK/NOK',header=TRUE)
a<-table.row.end(a)
a<-table.row.start(a)
a<-table.element(a,'1% type I error level',header=TRUE)
a<-table.element(a,numsignificant1)
a<-table.element(a,numsignificant1/numgqtests)
if (numsignificant1/numgqtests < 0.01) dum <- 'OK' else dum <- 'NOK'
a<-table.element(a,dum)
a<-table.row.end(a)
a<-table.row.start(a)
a<-table.element(a,'5% type I error level',header=TRUE)
a<-table.element(a,numsignificant5)
a<-table.element(a,numsignificant5/numgqtests)
if (numsignificant5/numgqtests < 0.05) dum <- 'OK' else dum <- 'NOK'
a<-table.element(a,dum)
a<-table.row.end(a)
a<-table.row.start(a)
a<-table.element(a,'10% type I error level',header=TRUE)
a<-table.element(a,numsignificant10)
a<-table.element(a,numsignificant10/numgqtests)
if (numsignificant10/numgqtests < 0.1) dum <- 'OK' else dum <- 'NOK'
a<-table.element(a,dum)
a<-table.row.end(a)
a<-table.end(a)
table.save(a,file='mytable6.tab')
}