Free Statistics

of Irreproducible Research!

Author's title

Author*The author of this computation has been verified*
R Software Modulerwasp_pairs.wasp
Title produced by softwareKendall tau Correlation Matrix
Date of computationFri, 31 Oct 2008 07:09:45 -0600
Cite this page as followsStatistical Computations at FreeStatistics.org, Office for Research Development and Education, URL https://freestatistics.org/blog/index.php?v=date/2008/Oct/31/t12254586225fdqrb3qrx3ybpo.htm/, Retrieved Sat, 18 May 2024 07:24:41 +0000
Statistical Computations at FreeStatistics.org, Office for Research Development and Education, URL https://freestatistics.org/blog/index.php?pk=20261, Retrieved Sat, 18 May 2024 07:24:41 +0000
QR Codes:

Original text written by user:
IsPrivate?No (this computation is public)
User-defined keywords
Estimated Impact185
Family? (F = Feedback message, R = changed R code, M = changed R Module, P = changed Parameters, D = changed Data)
F     [Mean Plot] [workshop 3] [2007-10-26 12:14:28] [e9ffc5de6f8a7be62f22b142b5b6b1a8]
F RMPD  [Blocked Bootstrap Plot - Central Tendency] [vraag 4] [2008-10-29 19:47:27] [c45c87b96bbf32ffc2144fc37d767b2e]
F RMPD    [Kendall tau Correlation Matrix] [vraag 1] [2008-10-30 14:09:39] [c45c87b96bbf32ffc2144fc37d767b2e]
F    D        [Kendall tau Correlation Matrix] [Hypothesis Testin...] [2008-10-31 13:09:45] [6797a1f4a60918966297e9d9220cabc2] [Current]
F    D          [Kendall tau Correlation Matrix] [Hypothesis Testin...] [2008-10-31 13:20:14] [063e4b67ad7d3a8a83eccec794cd5aa7]
F               [Kendall tau Correlation Matrix] [Kendall tau corre...] [2008-11-06 06:12:21] [1b742211e88d1643c42c5773474321b2]
Feedback Forum
2008-11-07 12:52:04 [Tom Ardies] [reply
De waarden onder de histogrammen geven de betrouwbaarheid van de correlatie weer. Namelijk hoe lager de waarde hoe hoger de betrouwbaarheid. Daarom is de correlatie het meest betrouwbaar bij RNR en RCF, want daar bedraagt de kendall tau correlatie 0,1
2008-11-09 15:18:56 [Bob Leysen] [reply
Foute grafiek.

http://www.freestatistics.org/blog/index.php?v=date/2008/Nov/02/t12256472532j8zy95yw5bzx06.htm

De getallen in de rechthoeken zeggen niet wat correlatie is, dit is de betrouwbaarheid van uw correlatie. Hoe hoger het getal, hoe meer louter toeval.
De tweede kolom (RNR) is het meest betrouwbaar (0,01).
  2008-11-09 15:20:37 [Bob Leysen] [reply
Deze grafiek is correct, maar de andere link in het word document niet
2008-11-11 19:25:33 [Ellen Van Ham] [reply
Het antwoord op de vraag is correct. Je kan hier best de Kendall tau Correlation plot voor gebruiken. Op de schuine as zien we de variabele met daarnaast de scatter plot. Het voordeel van deze plot is dat men de rangen met elkaar kan vergelijken. Het is ook veel robuuster voor outliers, mits de spreiding hierdoor kleiner is. De getallen zijn geen correlatiecoëfficiënt (zoals in het antwoord gezegd) maar wel de betrouwbaarheid. Hoe hoger dat getal, hoe toevalliger je het getal gevonden hebt. Als de coëfficiënt onder 0,05 is dat het beste (hoe kleiner hoe beter). Dit is het geval bij RNR.

Post a new message
Dataseries X:
4.2	4.8	20.8	0.9	39.6
2.6	-4.2	17.1	0.85	36.1
3	1.6	22.3	0.83	34.4
3.8	5.2	25.1	0.84	33.4
4	9.2	27.7	0.85	34.8
3.5	4.6	24.9	0.83	33.7
4.1	10.6	29.5	0.83	36.3


Summary of computational transaction
Raw Inputview raw input (R code)
Raw Outputview raw output of R engine
Computing time1 seconds
R Server'Gwilym Jenkins' @ 72.249.127.135

\begin{tabular}{lllllllll}
\hline
Summary of computational transaction \tabularnewline
Raw Input & view raw input (R code)  \tabularnewline
Raw Output & view raw output of R engine  \tabularnewline
Computing time & 1 seconds \tabularnewline
R Server & 'Gwilym Jenkins' @ 72.249.127.135 \tabularnewline
\hline
\end{tabular}
%Source: https://freestatistics.org/blog/index.php?pk=20261&T=0

[TABLE]
[ROW][C]Summary of computational transaction[/C][/ROW]
[ROW][C]Raw Input[/C][C]view raw input (R code) [/C][/ROW]
[ROW][C]Raw Output[/C][C]view raw output of R engine [/C][/ROW]
[ROW][C]Computing time[/C][C]1 seconds[/C][/ROW]
[ROW][C]R Server[/C][C]'Gwilym Jenkins' @ 72.249.127.135[/C][/ROW]
[/TABLE]
Source: https://freestatistics.org/blog/index.php?pk=20261&T=0

Globally Unique Identifier (entire table): ba.freestatistics.org/blog/index.php?pk=20261&T=0

As an alternative you can also use a QR Code:  

The GUIDs for individual cells are displayed in the table below:

Summary of computational transaction
Raw Inputview raw input (R code)
Raw Outputview raw output of R engine
Computing time1 seconds
R Server'Gwilym Jenkins' @ 72.249.127.135


Kendall tau rank correlations for all pairs of data series
pairtaup-value
tau( RNVM , RNR )0.7142857142857140.0301587301587301
tau( RNVM , RCF )0.5238095238095240.136111111111111
tau( RNVM , RLEZ )0.2646280620124820.427262856745706
tau( RNVM , REV )0.3333333333333330.381349206349206
tau( RNR , RCF )0.809523809523810.0107142857142857
tau( RNR , RLEZ )-0.05292561240249630.873844698517373
tau( RNR , REV )0.04761904761904761
tau( RCF , RLEZ )-0.2646280620124820.427262856745706
tau( RCF , REV )-0.1428571428571430.772619047619048
tau( RLEZ , REV )0.3704792868174740.266379923342483

\begin{tabular}{lllllllll}
\hline
Kendall tau rank correlations for all pairs of data series \tabularnewline
pair & tau & p-value \tabularnewline
tau( RNVM , RNR ) & 0.714285714285714 & 0.0301587301587301 \tabularnewline
tau( RNVM , RCF ) & 0.523809523809524 & 0.136111111111111 \tabularnewline
tau( RNVM , RLEZ ) & 0.264628062012482 & 0.427262856745706 \tabularnewline
tau( RNVM , REV ) & 0.333333333333333 & 0.381349206349206 \tabularnewline
tau( RNR , RCF ) & 0.80952380952381 & 0.0107142857142857 \tabularnewline
tau( RNR , RLEZ ) & -0.0529256124024963 & 0.873844698517373 \tabularnewline
tau( RNR , REV ) & 0.0476190476190476 & 1 \tabularnewline
tau( RCF , RLEZ ) & -0.264628062012482 & 0.427262856745706 \tabularnewline
tau( RCF , REV ) & -0.142857142857143 & 0.772619047619048 \tabularnewline
tau( RLEZ , REV ) & 0.370479286817474 & 0.266379923342483 \tabularnewline
\hline
\end{tabular}
%Source: https://freestatistics.org/blog/index.php?pk=20261&T=1

[TABLE]
[ROW][C]Kendall tau rank correlations for all pairs of data series[/C][/ROW]
[ROW][C]pair[/C][C]tau[/C][C]p-value[/C][/ROW]
[ROW][C]tau( RNVM , RNR )[/C][C]0.714285714285714[/C][C]0.0301587301587301[/C][/ROW]
[ROW][C]tau( RNVM , RCF )[/C][C]0.523809523809524[/C][C]0.136111111111111[/C][/ROW]
[ROW][C]tau( RNVM , RLEZ )[/C][C]0.264628062012482[/C][C]0.427262856745706[/C][/ROW]
[ROW][C]tau( RNVM , REV )[/C][C]0.333333333333333[/C][C]0.381349206349206[/C][/ROW]
[ROW][C]tau( RNR , RCF )[/C][C]0.80952380952381[/C][C]0.0107142857142857[/C][/ROW]
[ROW][C]tau( RNR , RLEZ )[/C][C]-0.0529256124024963[/C][C]0.873844698517373[/C][/ROW]
[ROW][C]tau( RNR , REV )[/C][C]0.0476190476190476[/C][C]1[/C][/ROW]
[ROW][C]tau( RCF , RLEZ )[/C][C]-0.264628062012482[/C][C]0.427262856745706[/C][/ROW]
[ROW][C]tau( RCF , REV )[/C][C]-0.142857142857143[/C][C]0.772619047619048[/C][/ROW]
[ROW][C]tau( RLEZ , REV )[/C][C]0.370479286817474[/C][C]0.266379923342483[/C][/ROW]
[/TABLE]
Source: https://freestatistics.org/blog/index.php?pk=20261&T=1

Globally Unique Identifier (entire table): ba.freestatistics.org/blog/index.php?pk=20261&T=1

As an alternative you can also use a QR Code:  

The GUIDs for individual cells are displayed in the table below:

Kendall tau rank correlations for all pairs of data series
pairtaup-value
tau( RNVM , RNR )0.7142857142857140.0301587301587301
tau( RNVM , RCF )0.5238095238095240.136111111111111
tau( RNVM , RLEZ )0.2646280620124820.427262856745706
tau( RNVM , REV )0.3333333333333330.381349206349206
tau( RNR , RCF )0.809523809523810.0107142857142857
tau( RNR , RLEZ )-0.05292561240249630.873844698517373
tau( RNR , REV )0.04761904761904761
tau( RCF , RLEZ )-0.2646280620124820.427262856745706
tau( RCF , REV )-0.1428571428571430.772619047619048
tau( RLEZ , REV )0.3704792868174740.266379923342483


Parameters (Session):
Parameters (R input):
R code (references can be found in the software module):
panel.tau <- function(x, y, digits=2, prefix='', cex.cor)
{
usr <- par('usr'); on.exit(par(usr))
par(usr = c(0, 1, 0, 1))
rr <- cor.test(x, y, method='kendall')
r <- round(rr$p.value,2)
txt <- format(c(r, 0.123456789), digits=digits)[1]
txt <- paste(prefix, txt, sep='')
if(missing(cex.cor)) cex <- 0.5/strwidth(txt)
text(0.5, 0.5, txt, cex = cex)
}
panel.hist <- function(x, ...)
{
usr <- par('usr'); on.exit(par(usr))
par(usr = c(usr[1:2], 0, 1.5) )
h <- hist(x, plot = FALSE)
breaks <- h$breaks; nB <- length(breaks)
y <- h$counts; y <- y/max(y)
rect(breaks[-nB], 0, breaks[-1], y, col='grey', ...)
}
bitmap(file='test1.png')
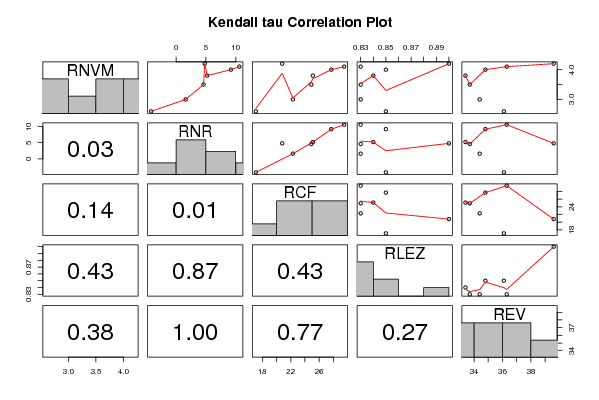
pairs(t(y),diag.panel=panel.hist, upper.panel=panel.smooth, lower.panel=panel.tau, main=main)
dev.off()
load(file='createtable')
a<-table.start()
a<-table.row.start(a)
a<-table.element(a,'Kendall tau rank correlations for all pairs of data series',3,TRUE)
a<-table.row.end(a)
a<-table.row.start(a)
a<-table.element(a,'pair',1,TRUE)
a<-table.element(a,'tau',1,TRUE)
a<-table.element(a,'p-value',1,TRUE)
a<-table.row.end(a)
n <- length(y[,1])
n
cor.test(y[1,],y[2,],method='kendall')
for (i in 1:(n-1))
{
for (j in (i+1):n)
{
a<-table.row.start(a)
dum <- paste('tau(',dimnames(t(x))[[2]][i])
dum <- paste(dum,',')
dum <- paste(dum,dimnames(t(x))[[2]][j])
dum <- paste(dum,')')
a<-table.element(a,dum,header=TRUE)
r <- cor.test(y[i,],y[j,],method='kendall')
a<-table.element(a,r$estimate)
a<-table.element(a,r$p.value)
a<-table.row.end(a)
}
}
a<-table.end(a)
table.save(a,file='mytable.tab')