Free Statistics
of Irreproducible Research!
Description of Statistical Computation | |||||||||||||||||||||||||||||||||||||||||
|---|---|---|---|---|---|---|---|---|---|---|---|---|---|---|---|---|---|---|---|---|---|---|---|---|---|---|---|---|---|---|---|---|---|---|---|---|---|---|---|---|---|
| Author's title | |||||||||||||||||||||||||||||||||||||||||
| Author | *The author of this computation has been verified* | ||||||||||||||||||||||||||||||||||||||||
| R Software Module | rwasp_univariatedataseries.wasp | ||||||||||||||||||||||||||||||||||||||||
| Title produced by software | Univariate Data Series | ||||||||||||||||||||||||||||||||||||||||
| Date of computation | Tue, 14 Oct 2008 13:04:41 -0600 | ||||||||||||||||||||||||||||||||||||||||
| Cite this page as follows | Statistical Computations at FreeStatistics.org, Office for Research Development and Education, URL https://freestatistics.org/blog/index.php?v=date/2008/Oct/14/t12240111194hl7n83uroa5ngo.htm/, Retrieved Sat, 18 May 2024 03:43:05 +0000 | ||||||||||||||||||||||||||||||||||||||||
| Statistical Computations at FreeStatistics.org, Office for Research Development and Education, URL https://freestatistics.org/blog/index.php?pk=16269, Retrieved Sat, 18 May 2024 03:43:05 +0000 | |||||||||||||||||||||||||||||||||||||||||
| QR Codes: | |||||||||||||||||||||||||||||||||||||||||
|
| |||||||||||||||||||||||||||||||||||||||||
| Original text written by user: | |||||||||||||||||||||||||||||||||||||||||
| IsPrivate? | No (this computation is public) | ||||||||||||||||||||||||||||||||||||||||
| User-defined keywords | |||||||||||||||||||||||||||||||||||||||||
| Estimated Impact | 174 | ||||||||||||||||||||||||||||||||||||||||
Tree of Dependent Computations | |||||||||||||||||||||||||||||||||||||||||
| Family? (F = Feedback message, R = changed R code, M = changed R Module, P = changed Parameters, D = changed Data) | |||||||||||||||||||||||||||||||||||||||||
| F [Univariate Data Series] [Indicator van het...] [2008-10-13 07:49:48] [fdafc09d93b3f1f7b53d2097951a84d1] - PD [Univariate Data Series] [Prijsindexcijfers...] [2008-10-14 19:04:41] [b23db733701c4d62df5e228d507c1c6a] [Current] | |||||||||||||||||||||||||||||||||||||||||
| Feedback Forum | |||||||||||||||||||||||||||||||||||||||||
Post a new message | |||||||||||||||||||||||||||||||||||||||||
Dataset | |||||||||||||||||||||||||||||||||||||||||
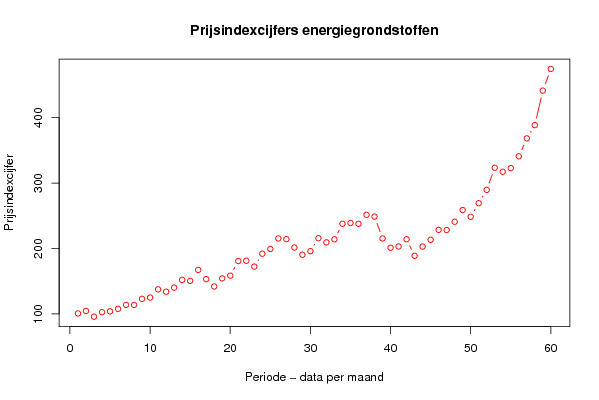
| Dataseries X: | |||||||||||||||||||||||||||||||||||||||||
100,8 104,6 95,9 102,7 104 107,9 113,8 113,8 123,1 125,1 137,6 134 140,3 152,1 150,6 167,3 153,2 142 154,4 158,5 180,9 181,3 172,4 192 199,3 215,4 214,3 201,5 190,5 196 215,7 209,4 214,1 237,8 239 237,8 251,5 248,8 215,4 201,2 203,1 214,2 188,9 203 213,3 228,5 228,2 240,9 258,8 248,5 269,2 289,6 323,4 317,2 322,8 340,9 368,2 388,5 441,2 474,3 | |||||||||||||||||||||||||||||||||||||||||
Tables (Output of Computation) | |||||||||||||||||||||||||||||||||||||||||
| |||||||||||||||||||||||||||||||||||||||||
Figures (Output of Computation) | |||||||||||||||||||||||||||||||||||||||||
Input Parameters & R Code | |||||||||||||||||||||||||||||||||||||||||
| Parameters (Session): | |||||||||||||||||||||||||||||||||||||||||
| par1 = Prijsindexcijfers van de grondstoffen , Energiegrondstoffen, Totaal ; par2 = http://www.nbb.be/belgostat/PublicatieSelectieLinker?LinkID=15000005|910000082&Lang=N ; par3 = Prijsindexcijfers van de grondstoffen , Energiegrondstoffen, Totaal - Periode 2003/07 - 2008/06 (indexcijfers jaar 2000 = 100) ; | |||||||||||||||||||||||||||||||||||||||||
| Parameters (R input): | |||||||||||||||||||||||||||||||||||||||||
| par1 = Prijsindexcijfers van de grondstoffen , Energiegrondstoffen, Totaal ; par2 = http://www.nbb.be/belgostat/PublicatieSelectieLinker?LinkID=15000005|910000082&Lang=N ; par3 = Prijsindexcijfers van de grondstoffen , Energiegrondstoffen, Totaal - Periode 2003/07 - 2008/06 (indexcijfers jaar 2000 = 100) ; | |||||||||||||||||||||||||||||||||||||||||
| R code (references can be found in the software module): | |||||||||||||||||||||||||||||||||||||||||
bitmap(file='test1.png') | |||||||||||||||||||||||||||||||||||||||||