Free Statistics
of Irreproducible Research!
Description of Statistical Computation | |||||||||||||||||||||||||||||||||||||||||
|---|---|---|---|---|---|---|---|---|---|---|---|---|---|---|---|---|---|---|---|---|---|---|---|---|---|---|---|---|---|---|---|---|---|---|---|---|---|---|---|---|---|
| Author's title | |||||||||||||||||||||||||||||||||||||||||
| Author | *The author of this computation has been verified* | ||||||||||||||||||||||||||||||||||||||||
| R Software Module | rwasp_univariatedataseries.wasp | ||||||||||||||||||||||||||||||||||||||||
| Title produced by software | Univariate Data Series | ||||||||||||||||||||||||||||||||||||||||
| Date of computation | Mon, 13 Oct 2008 12:39:11 -0600 | ||||||||||||||||||||||||||||||||||||||||
| Cite this page as follows | Statistical Computations at FreeStatistics.org, Office for Research Development and Education, URL https://freestatistics.org/blog/index.php?v=date/2008/Oct/13/t1223923198bqsvqzqnrzuc1jb.htm/, Retrieved Sat, 18 May 2024 04:01:54 +0000 | ||||||||||||||||||||||||||||||||||||||||
| Statistical Computations at FreeStatistics.org, Office for Research Development and Education, URL https://freestatistics.org/blog/index.php?pk=15889, Retrieved Sat, 18 May 2024 04:01:54 +0000 | |||||||||||||||||||||||||||||||||||||||||
| QR Codes: | |||||||||||||||||||||||||||||||||||||||||
|
| |||||||||||||||||||||||||||||||||||||||||
| Original text written by user: | |||||||||||||||||||||||||||||||||||||||||
| IsPrivate? | No (this computation is public) | ||||||||||||||||||||||||||||||||||||||||
| User-defined keywords | |||||||||||||||||||||||||||||||||||||||||
| Estimated Impact | 172 | ||||||||||||||||||||||||||||||||||||||||
Tree of Dependent Computations | |||||||||||||||||||||||||||||||||||||||||
| Family? (F = Feedback message, R = changed R code, M = changed R Module, P = changed Parameters, D = changed Data) | |||||||||||||||||||||||||||||||||||||||||
| F [Univariate Data Series] [Arbeidsinkomens] [2008-10-13 18:39:11] [6fc58909ffe15c247a4f6748c8841ab4] [Current] - PD [Univariate Data Series] [Tijdreeks: Totaal...] [2008-10-19 18:19:54] [87cabf13a90315c7085b765dcebb7412] - PD [Univariate Data Series] [Tijdreeks: Aantal...] [2008-10-19 18:32:06] [87cabf13a90315c7085b765dcebb7412] - PD [Univariate Data Series] [Tijdreeks: Aantal...] [2008-10-19 18:35:29] [87cabf13a90315c7085b765dcebb7412] - PD [Univariate Data Series] [Tijdreeks: Aantal...] [2008-10-19 18:38:06] [87cabf13a90315c7085b765dcebb7412] - PD [Univariate Data Series] [Tijdreeks 1: tota...] [2008-10-22 17:58:06] [a18c43c8b63fa6800a53bb187b9ddd45] - PD [Univariate Data Series] [tijdreeks 1: tota...] [2008-10-22 18:18:59] [631938996a408f8d8cf3d9850ca0cd03] F P [Univariate Data Series] [Totaal aantal wer...] [2008-10-27 21:45:45] [d2d412c7f4d35ffbf5ee5ee89db327d4] | |||||||||||||||||||||||||||||||||||||||||
| Feedback Forum | |||||||||||||||||||||||||||||||||||||||||
Post a new message | |||||||||||||||||||||||||||||||||||||||||
Dataset | |||||||||||||||||||||||||||||||||||||||||
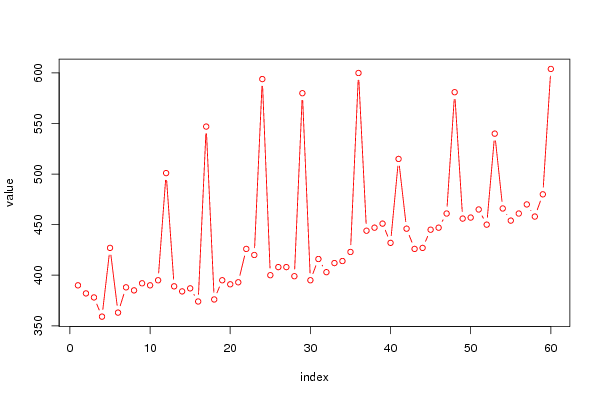
| Dataseries X: | |||||||||||||||||||||||||||||||||||||||||
390 382 378 359 427 363 388 385 392 390 395 501 389 384 387 374 547 376 395 391 393 426 420 594 400 408 408 399 580 395 416 403 412 414 423 600 444 447 451 432 515 446 426 427 445 447 461 581 456 457 465 450 540 466 454 461 470 458 480 604 | |||||||||||||||||||||||||||||||||||||||||
Tables (Output of Computation) | |||||||||||||||||||||||||||||||||||||||||
| |||||||||||||||||||||||||||||||||||||||||
Figures (Output of Computation) | |||||||||||||||||||||||||||||||||||||||||
Input Parameters & R Code | |||||||||||||||||||||||||||||||||||||||||
| Parameters (Session): | |||||||||||||||||||||||||||||||||||||||||
| par1 = Arbeidsinkomens ; par2 = Belgostat ; | |||||||||||||||||||||||||||||||||||||||||
| Parameters (R input): | |||||||||||||||||||||||||||||||||||||||||
| par1 = Arbeidsinkomens ; par2 = Belgostat ; par3 = ; | |||||||||||||||||||||||||||||||||||||||||
| R code (references can be found in the software module): | |||||||||||||||||||||||||||||||||||||||||
bitmap(file='test1.png') | |||||||||||||||||||||||||||||||||||||||||