Free Statistics
of Irreproducible Research!
Description of Statistical Computation | |||||||||||||||||||||||||||||||||||||||||
|---|---|---|---|---|---|---|---|---|---|---|---|---|---|---|---|---|---|---|---|---|---|---|---|---|---|---|---|---|---|---|---|---|---|---|---|---|---|---|---|---|---|
| Author's title | |||||||||||||||||||||||||||||||||||||||||
| Author | *The author of this computation has been verified* | ||||||||||||||||||||||||||||||||||||||||
| R Software Module | rwasp_univariatedataseries.wasp | ||||||||||||||||||||||||||||||||||||||||
| Title produced by software | Univariate Data Series | ||||||||||||||||||||||||||||||||||||||||
| Date of computation | Mon, 13 Oct 2008 12:18:09 -0600 | ||||||||||||||||||||||||||||||||||||||||
| Cite this page as follows | Statistical Computations at FreeStatistics.org, Office for Research Development and Education, URL https://freestatistics.org/blog/index.php?v=date/2008/Oct/13/t1223921970n5ya469e5zly83t.htm/, Retrieved Sat, 18 May 2024 04:24:51 +0000 | ||||||||||||||||||||||||||||||||||||||||
| Statistical Computations at FreeStatistics.org, Office for Research Development and Education, URL https://freestatistics.org/blog/index.php?pk=15838, Retrieved Sat, 18 May 2024 04:24:51 +0000 | |||||||||||||||||||||||||||||||||||||||||
| QR Codes: | |||||||||||||||||||||||||||||||||||||||||
|
| |||||||||||||||||||||||||||||||||||||||||
| Original text written by user: | |||||||||||||||||||||||||||||||||||||||||
| IsPrivate? | No (this computation is public) | ||||||||||||||||||||||||||||||||||||||||
| User-defined keywords | |||||||||||||||||||||||||||||||||||||||||
| Estimated Impact | 164 | ||||||||||||||||||||||||||||||||||||||||
Tree of Dependent Computations | |||||||||||||||||||||||||||||||||||||||||
| Family? (F = Feedback message, R = changed R code, M = changed R Module, P = changed Parameters, D = changed Data) | |||||||||||||||||||||||||||||||||||||||||
| F [Univariate Data Series] [tijdreeks 1] [2008-10-13 18:18:09] [6797a1f4a60918966297e9d9220cabc2] [Current] - RMPD [Back to Back Histogram] [q8 totaal werkloo...] [2008-10-19 13:35:07] [063e4b67ad7d3a8a83eccec794cd5aa7] - RMPD [Back to Back Histogram] [q8 totaal werkloo...] [2008-10-19 13:47:24] [063e4b67ad7d3a8a83eccec794cd5aa7] F RMPD [Central Tendency] [q9 Central Tenden...] [2008-10-19 13:54:25] [063e4b67ad7d3a8a83eccec794cd5aa7] - RMPD [Pearson Correlation] [correlatie totaal...] [2008-10-19 14:20:41] [063e4b67ad7d3a8a83eccec794cd5aa7] - D [Pearson Correlation] [correlatie totaal...] [2008-10-19 14:31:37] [b60c8529de1d5b7f91715041b29d619e] - D [Pearson Correlation] [correlatie totaal...] [2008-10-19 14:35:42] [063e4b67ad7d3a8a83eccec794cd5aa7] - RMPD [Pearson Correlation] [correlatie totaal...] [2008-10-19 14:26:12] [063e4b67ad7d3a8a83eccec794cd5aa7] - PD [Univariate Data Series] [tijdreeks 1: tota...] [2008-10-19 14:54:55] [063e4b67ad7d3a8a83eccec794cd5aa7] - PD [Univariate Data Series] [Tijdreeks 1 Totaa...] [2008-10-20 16:30:02] [063e4b67ad7d3a8a83eccec794cd5aa7] - PD [Univariate Data Series] [tijdreeks 2: tota...] [2008-10-19 14:57:24] [063e4b67ad7d3a8a83eccec794cd5aa7] - PD [Univariate Data Series] [Tijdreeks 2 Totaa...] [2008-10-20 16:34:18] [063e4b67ad7d3a8a83eccec794cd5aa7] - P [Univariate Data Series] [Werkloosheid mannen] [2008-10-22 18:07:20] [631938996a408f8d8cf3d9850ca0cd03] - PD [Univariate Data Series] [tijdreeks 3: tota...] [2008-10-19 14:59:51] [063e4b67ad7d3a8a83eccec794cd5aa7] - PD [Univariate Data Series] [Tijdreeks 3 Totaa...] [2008-10-20 16:37:44] [063e4b67ad7d3a8a83eccec794cd5aa7] - PD [Univariate Data Series] [tijdreeks 3: Tota...] [2008-10-22 18:12:46] [631938996a408f8d8cf3d9850ca0cd03] - PD [Univariate Data Series] [tijdreeks 4: tota...] [2008-10-19 15:02:41] [063e4b67ad7d3a8a83eccec794cd5aa7] - P [Univariate Data Series] [Tijdreeks 4 Totaa...] [2008-10-20 16:41:05] [063e4b67ad7d3a8a83eccec794cd5aa7] - PD [Univariate Data Series] [tijdreeks 4: Tota...] [2008-10-22 18:17:01] [631938996a408f8d8cf3d9850ca0cd03] | |||||||||||||||||||||||||||||||||||||||||
| Feedback Forum | |||||||||||||||||||||||||||||||||||||||||
Post a new message | |||||||||||||||||||||||||||||||||||||||||
Dataset | |||||||||||||||||||||||||||||||||||||||||
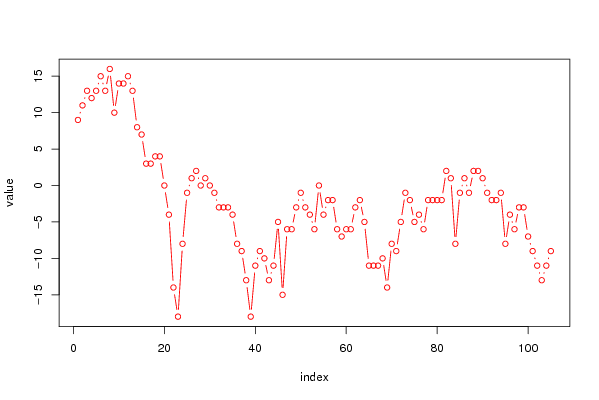
| Dataseries X: | |||||||||||||||||||||||||||||||||||||||||
9 11 13 12 13 15 13 16 10 14 14 15 13 8 7 3 3 4 4 0 -4 -14 -18 -8 -1 1 2 0 1 0 -1 -3 -3 -3 -4 -8 -9 -13 -18 -11 -9 -10 -13 -11 -5 -15 -6 -6 -3 -1 -3 -4 -6 0 -4 -2 -2 -6 -7 -6 -6 -3 -2 -5 -11 -11 -11 -10 -14 -8 -9 -5 -1 -2 -5 -4 -6 -2 -2 -2 -2 2 1 -8 -1 1 -1 2 2 1 -1 -2 -2 -1 -8 -4 -6 -3 -3 -7 -9 -11 -13 -11 -9 | |||||||||||||||||||||||||||||||||||||||||
Tables (Output of Computation) | |||||||||||||||||||||||||||||||||||||||||
| |||||||||||||||||||||||||||||||||||||||||
Figures (Output of Computation) | |||||||||||||||||||||||||||||||||||||||||
Input Parameters & R Code | |||||||||||||||||||||||||||||||||||||||||
| Parameters (Session): | |||||||||||||||||||||||||||||||||||||||||
| par1 = indicator van het consumentenvertrouwen ; par2 = Belgostat ; | |||||||||||||||||||||||||||||||||||||||||
| Parameters (R input): | |||||||||||||||||||||||||||||||||||||||||
| par1 = indicator van het consumentenvertrouwen ; par2 = Belgostat ; par3 = ; | |||||||||||||||||||||||||||||||||||||||||
| R code (references can be found in the software module): | |||||||||||||||||||||||||||||||||||||||||
bitmap(file='test1.png') | |||||||||||||||||||||||||||||||||||||||||