Free Statistics

of Irreproducible Research!

Author's title

Author*The author of this computation has been verified*
R Software Modulerwasp_multipleregression.wasp
Title produced by softwareMultiple Regression
Date of computationThu, 27 Nov 2008 19:24:13 -0700
Cite this page as followsStatistical Computations at FreeStatistics.org, Office for Research Development and Education, URL https://freestatistics.org/blog/index.php?v=date/2008/Nov/28/t12278391277wootojncsgesef.htm/, Retrieved Sun, 19 May 2024 09:02:24 +0000
Statistical Computations at FreeStatistics.org, Office for Research Development and Education, URL https://freestatistics.org/blog/index.php?pk=25954, Retrieved Sun, 19 May 2024 09:02:24 +0000
QR Codes:

Original text written by user:
IsPrivate?No (this computation is public)
User-defined keywords
Estimated Impact196
Family? (F = Feedback message, R = changed R code, M = changed R Module, P = changed Parameters, D = changed Data)
F       [Multiple Regression] [Q3 the seatbelt law] [2008-11-28 02:24:13] [9f72e095d5529918bf5b0810c01bf6ce] [Current]
-   PD    [Multiple Regression] [Multiple regressi...] [2008-12-23 17:52:25] [7a4703cb85a198d9845d72899eff0288]
-   PD    [Multiple Regression] [Multiple Regressi...] [2008-12-23 17:57:09] [7a4703cb85a198d9845d72899eff0288]
-   PD    [Multiple Regression] [Multiple Regressi...] [2008-12-23 17:59:48] [7a4703cb85a198d9845d72899eff0288]
Feedback Forum
2008-11-30 16:08:41 [a2386b643d711541400692649981f2dc] [reply
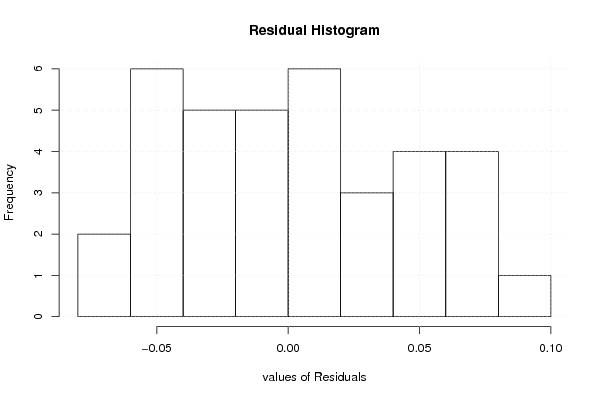
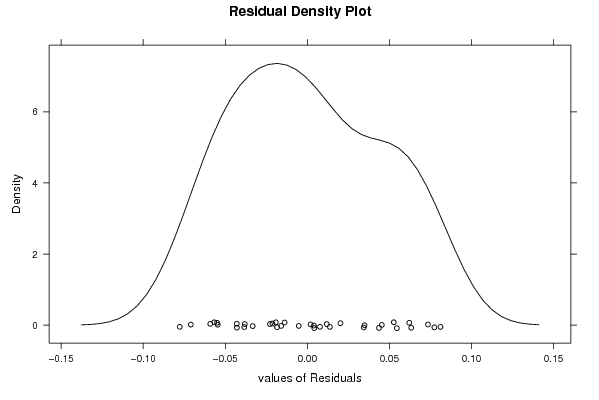
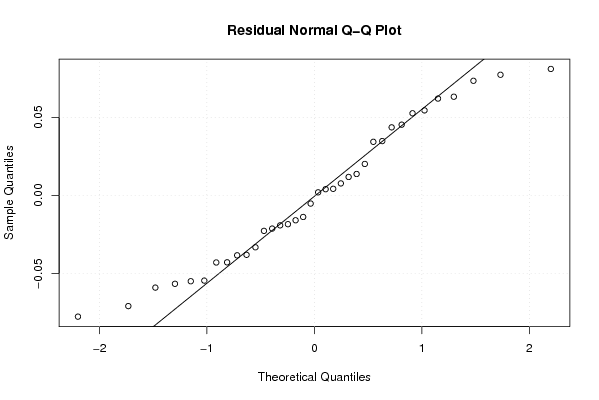
Je kon misschien eerst de dummies en lineaire trend weglaten om een verband te zoeken. Bij grafiek 1 en 2 had je een lijn kunnen toevoegen aan je grafiek, ter extra verduidelijking. Bij de normaalverdeling had je kunnen vermelden dat de grafiek een soort klokvorm moet vertonen. Bij de residuals van de q-qplot kon je nog vermelden dat er aan de staarten duidelijk outliers waren. Bij de laatste grafiek had je nog de blauwe stippellijn kunnen verklaren (betrouwbaardheisinterval).
2008-12-01 12:40:25 [Jessica Alves Pires] [reply
Ik ben het eens met voorgaande opmerking.

Post a new message
Dataseries X:
1,0137	0
0,9834	0
0,9643	0
0,947	0
0,906	0
0,9492	0
0,9397	0
0,9041	0
0,8721	0
0,8552	0
0,8564	0
0,8973	0
0,9383	0
0,9217	0
0,9095	0
0,892	0
0,8742	0
0,8532	0
0,8607	0
0,9005	0
0,9111	1
0,9059	1
0,8883	1
0,8924	1
0,8833	1
0,87	1
0,8758	1
0,8858	1
0,917	1
0,9554	1
0,9922	1
0,9778	1
0,9808	1
0,9811	1
1,0014	1
1,0183	1


Summary of computational transaction
Raw Inputview raw input (R code)
Raw Outputview raw output of R engine
Computing time3 seconds
R Server'Gwilym Jenkins' @ 72.249.127.135

\begin{tabular}{lllllllll}
\hline
Summary of computational transaction \tabularnewline
Raw Input & view raw input (R code)  \tabularnewline
Raw Output & view raw output of R engine  \tabularnewline
Computing time & 3 seconds \tabularnewline
R Server & 'Gwilym Jenkins' @ 72.249.127.135 \tabularnewline
\hline
\end{tabular}
%Source: https://freestatistics.org/blog/index.php?pk=25954&T=0

[TABLE]
[ROW][C]Summary of computational transaction[/C][/ROW]
[ROW][C]Raw Input[/C][C]view raw input (R code) [/C][/ROW]
[ROW][C]Raw Output[/C][C]view raw output of R engine [/C][/ROW]
[ROW][C]Computing time[/C][C]3 seconds[/C][/ROW]
[ROW][C]R Server[/C][C]'Gwilym Jenkins' @ 72.249.127.135[/C][/ROW]
[/TABLE]
Source: https://freestatistics.org/blog/index.php?pk=25954&T=0

Globally Unique Identifier (entire table): ba.freestatistics.org/blog/index.php?pk=25954&T=0

As an alternative you can also use a QR Code:  

The GUIDs for individual cells are displayed in the table below:

Summary of computational transaction
Raw Inputview raw input (R code)
Raw Outputview raw output of R engine
Computing time3 seconds
R Server'Gwilym Jenkins' @ 72.249.127.135


Multiple Linear Regression - Estimated Regression Equation
Koers[t] = + 0.92616111111111 + 0.0331083333333331Dummy[t] + 0.014529166666666M1[t] -0.00502777777777762M2[t] -0.0130180555555553M3[t] -0.0207749999999999M4[t] -0.0294652777777777M5[t] -0.0087555555555555M6[t] + 0.00335416666666673M7[t] + 0.00046388888888894M8[t] -0.0161958333333332M9[t] -0.0229527777777777M10[t] -0.0211430555555554M11[t] -0.000509722222222204t + e[t]

\begin{tabular}{lllllllll}
\hline
Multiple Linear Regression - Estimated Regression Equation \tabularnewline
Koers[t] =  +  0.92616111111111 +  0.0331083333333331Dummy[t] +  0.014529166666666M1[t] -0.00502777777777762M2[t] -0.0130180555555553M3[t] -0.0207749999999999M4[t] -0.0294652777777777M5[t] -0.0087555555555555M6[t] +  0.00335416666666673M7[t] +  0.00046388888888894M8[t] -0.0161958333333332M9[t] -0.0229527777777777M10[t] -0.0211430555555554M11[t] -0.000509722222222204t  + e[t] \tabularnewline
\hline
\end{tabular}
%Source: https://freestatistics.org/blog/index.php?pk=25954&T=1

[TABLE]
[ROW][C]Multiple Linear Regression - Estimated Regression Equation[/C][/ROW]
[ROW][C]Koers[t] =  +  0.92616111111111 +  0.0331083333333331Dummy[t] +  0.014529166666666M1[t] -0.00502777777777762M2[t] -0.0130180555555553M3[t] -0.0207749999999999M4[t] -0.0294652777777777M5[t] -0.0087555555555555M6[t] +  0.00335416666666673M7[t] +  0.00046388888888894M8[t] -0.0161958333333332M9[t] -0.0229527777777777M10[t] -0.0211430555555554M11[t] -0.000509722222222204t  + e[t][/C][/ROW]
[/TABLE]
Source: https://freestatistics.org/blog/index.php?pk=25954&T=1

Globally Unique Identifier (entire table): ba.freestatistics.org/blog/index.php?pk=25954&T=1

As an alternative you can also use a QR Code:  

The GUIDs for individual cells are displayed in the table below:

Multiple Linear Regression - Estimated Regression Equation
Koers[t] = + 0.92616111111111 + 0.0331083333333331Dummy[t] + 0.014529166666666M1[t] -0.00502777777777762M2[t] -0.0130180555555553M3[t] -0.0207749999999999M4[t] -0.0294652777777777M5[t] -0.0087555555555555M6[t] + 0.00335416666666673M7[t] + 0.00046388888888894M8[t] -0.0161958333333332M9[t] -0.0229527777777777M10[t] -0.0211430555555554M11[t] -0.000509722222222204t + e[t]


Multiple Linear Regression - Ordinary Least Squares
VariableParameterS.D.T-STATH0: parameter = 02-tail p-value1-tail p-value
(Intercept)0.926161111111110.04277921.6500
Dummy0.03310833333333310.0405840.81580.4233550.211678
M10.0145291666666660.0483430.30050.7665870.383293
M2-0.005027777777777620.047987-0.10480.9175050.458753
M3-0.01301805555555530.047708-0.27290.78750.39375
M4-0.02077499999999990.047508-0.43730.6661610.333081
M5-0.02946527777777770.047388-0.62180.5404690.270235
M6-0.00875555555555550.047347-0.18490.8549850.427492
M70.003354166666666730.0473880.07080.9442110.472106
M80.000463888888888940.0475080.00980.9922970.496149
M9-0.01619583333333320.047226-0.34290.7348990.36745
M10-0.02295277777777770.047024-0.48810.6303050.315152
M11-0.02114305555555540.046902-0.45080.6565540.328277
t-0.0005097222222222040.001953-0.26110.7964810.398241

\begin{tabular}{lllllllll}
\hline
Multiple Linear Regression - Ordinary Least Squares \tabularnewline
Variable & Parameter & S.D. & T-STATH0: parameter = 0 & 2-tail p-value & 1-tail p-value \tabularnewline
(Intercept) & 0.92616111111111 & 0.042779 & 21.65 & 0 & 0 \tabularnewline
Dummy & 0.0331083333333331 & 0.040584 & 0.8158 & 0.423355 & 0.211678 \tabularnewline
M1 & 0.014529166666666 & 0.048343 & 0.3005 & 0.766587 & 0.383293 \tabularnewline
M2 & -0.00502777777777762 & 0.047987 & -0.1048 & 0.917505 & 0.458753 \tabularnewline
M3 & -0.0130180555555553 & 0.047708 & -0.2729 & 0.7875 & 0.39375 \tabularnewline
M4 & -0.0207749999999999 & 0.047508 & -0.4373 & 0.666161 & 0.333081 \tabularnewline
M5 & -0.0294652777777777 & 0.047388 & -0.6218 & 0.540469 & 0.270235 \tabularnewline
M6 & -0.0087555555555555 & 0.047347 & -0.1849 & 0.854985 & 0.427492 \tabularnewline
M7 & 0.00335416666666673 & 0.047388 & 0.0708 & 0.944211 & 0.472106 \tabularnewline
M8 & 0.00046388888888894 & 0.047508 & 0.0098 & 0.992297 & 0.496149 \tabularnewline
M9 & -0.0161958333333332 & 0.047226 & -0.3429 & 0.734899 & 0.36745 \tabularnewline
M10 & -0.0229527777777777 & 0.047024 & -0.4881 & 0.630305 & 0.315152 \tabularnewline
M11 & -0.0211430555555554 & 0.046902 & -0.4508 & 0.656554 & 0.328277 \tabularnewline
t & -0.000509722222222204 & 0.001953 & -0.2611 & 0.796481 & 0.398241 \tabularnewline
\hline
\end{tabular}
%Source: https://freestatistics.org/blog/index.php?pk=25954&T=2

[TABLE]
[ROW][C]Multiple Linear Regression - Ordinary Least Squares[/C][/ROW]
[ROW][C]Variable[/C][C]Parameter[/C][C]S.D.[/C][C]T-STATH0: parameter = 0[/C][C]2-tail p-value[/C][C]1-tail p-value[/C][/ROW]
[ROW][C](Intercept)[/C][C]0.92616111111111[/C][C]0.042779[/C][C]21.65[/C][C]0[/C][C]0[/C][/ROW]
[ROW][C]Dummy[/C][C]0.0331083333333331[/C][C]0.040584[/C][C]0.8158[/C][C]0.423355[/C][C]0.211678[/C][/ROW]
[ROW][C]M1[/C][C]0.014529166666666[/C][C]0.048343[/C][C]0.3005[/C][C]0.766587[/C][C]0.383293[/C][/ROW]
[ROW][C]M2[/C][C]-0.00502777777777762[/C][C]0.047987[/C][C]-0.1048[/C][C]0.917505[/C][C]0.458753[/C][/ROW]
[ROW][C]M3[/C][C]-0.0130180555555553[/C][C]0.047708[/C][C]-0.2729[/C][C]0.7875[/C][C]0.39375[/C][/ROW]
[ROW][C]M4[/C][C]-0.0207749999999999[/C][C]0.047508[/C][C]-0.4373[/C][C]0.666161[/C][C]0.333081[/C][/ROW]
[ROW][C]M5[/C][C]-0.0294652777777777[/C][C]0.047388[/C][C]-0.6218[/C][C]0.540469[/C][C]0.270235[/C][/ROW]
[ROW][C]M6[/C][C]-0.0087555555555555[/C][C]0.047347[/C][C]-0.1849[/C][C]0.854985[/C][C]0.427492[/C][/ROW]
[ROW][C]M7[/C][C]0.00335416666666673[/C][C]0.047388[/C][C]0.0708[/C][C]0.944211[/C][C]0.472106[/C][/ROW]
[ROW][C]M8[/C][C]0.00046388888888894[/C][C]0.047508[/C][C]0.0098[/C][C]0.992297[/C][C]0.496149[/C][/ROW]
[ROW][C]M9[/C][C]-0.0161958333333332[/C][C]0.047226[/C][C]-0.3429[/C][C]0.734899[/C][C]0.36745[/C][/ROW]
[ROW][C]M10[/C][C]-0.0229527777777777[/C][C]0.047024[/C][C]-0.4881[/C][C]0.630305[/C][C]0.315152[/C][/ROW]
[ROW][C]M11[/C][C]-0.0211430555555554[/C][C]0.046902[/C][C]-0.4508[/C][C]0.656554[/C][C]0.328277[/C][/ROW]
[ROW][C]t[/C][C]-0.000509722222222204[/C][C]0.001953[/C][C]-0.2611[/C][C]0.796481[/C][C]0.398241[/C][/ROW]
[/TABLE]
Source: https://freestatistics.org/blog/index.php?pk=25954&T=2

Globally Unique Identifier (entire table): ba.freestatistics.org/blog/index.php?pk=25954&T=2

As an alternative you can also use a QR Code:  

The GUIDs for individual cells are displayed in the table below:

Multiple Linear Regression - Ordinary Least Squares
VariableParameterS.D.T-STATH0: parameter = 02-tail p-value1-tail p-value
(Intercept)0.926161111111110.04277921.6500
Dummy0.03310833333333310.0405840.81580.4233550.211678
M10.0145291666666660.0483430.30050.7665870.383293
M2-0.005027777777777620.047987-0.10480.9175050.458753
M3-0.01301805555555530.047708-0.27290.78750.39375
M4-0.02077499999999990.047508-0.43730.6661610.333081
M5-0.02946527777777770.047388-0.62180.5404690.270235
M6-0.00875555555555550.047347-0.18490.8549850.427492
M70.003354166666666730.0473880.07080.9442110.472106
M80.000463888888888940.0475080.00980.9922970.496149
M9-0.01619583333333320.047226-0.34290.7348990.36745
M10-0.02295277777777770.047024-0.48810.6303050.315152
M11-0.02114305555555540.046902-0.45080.6565540.328277
t-0.0005097222222222040.001953-0.26110.7964810.398241


Multiple Linear Regression - Regression Statistics
Multiple R0.346974625571324
R-squared0.120391390790361
Adjusted R-squared-0.399377332833517
F-TEST (value)0.231624923390888
F-TEST (DF numerator)13
F-TEST (DF denominator)22
p-value0.995521571488883
Multiple Linear Regression - Residual Statistics
Residual Standard Deviation0.0573937395399866
Sum Squared Residuals0.072468909444444

\begin{tabular}{lllllllll}
\hline
Multiple Linear Regression - Regression Statistics \tabularnewline
Multiple R & 0.346974625571324 \tabularnewline
R-squared & 0.120391390790361 \tabularnewline
Adjusted R-squared & -0.399377332833517 \tabularnewline
F-TEST (value) & 0.231624923390888 \tabularnewline
F-TEST (DF numerator) & 13 \tabularnewline
F-TEST (DF denominator) & 22 \tabularnewline
p-value & 0.995521571488883 \tabularnewline
Multiple Linear Regression - Residual Statistics \tabularnewline
Residual Standard Deviation & 0.0573937395399866 \tabularnewline
Sum Squared Residuals & 0.072468909444444 \tabularnewline
\hline
\end{tabular}
%Source: https://freestatistics.org/blog/index.php?pk=25954&T=3

[TABLE]
[ROW][C]Multiple Linear Regression - Regression Statistics[/C][/ROW]
[ROW][C]Multiple R[/C][C]0.346974625571324[/C][/ROW]
[ROW][C]R-squared[/C][C]0.120391390790361[/C][/ROW]
[ROW][C]Adjusted R-squared[/C][C]-0.399377332833517[/C][/ROW]
[ROW][C]F-TEST (value)[/C][C]0.231624923390888[/C][/ROW]
[ROW][C]F-TEST (DF numerator)[/C][C]13[/C][/ROW]
[ROW][C]F-TEST (DF denominator)[/C][C]22[/C][/ROW]
[ROW][C]p-value[/C][C]0.995521571488883[/C][/ROW]
[ROW][C]Multiple Linear Regression - Residual Statistics[/C][/ROW]
[ROW][C]Residual Standard Deviation[/C][C]0.0573937395399866[/C][/ROW]
[ROW][C]Sum Squared Residuals[/C][C]0.072468909444444[/C][/ROW]
[/TABLE]
Source: https://freestatistics.org/blog/index.php?pk=25954&T=3

Globally Unique Identifier (entire table): ba.freestatistics.org/blog/index.php?pk=25954&T=3

As an alternative you can also use a QR Code:  

The GUIDs for individual cells are displayed in the table below:

Multiple Linear Regression - Regression Statistics
Multiple R0.346974625571324
R-squared0.120391390790361
Adjusted R-squared-0.399377332833517
F-TEST (value)0.231624923390888
F-TEST (DF numerator)13
F-TEST (DF denominator)22
p-value0.995521571488883
Multiple Linear Regression - Residual Statistics
Residual Standard Deviation0.0573937395399866
Sum Squared Residuals0.072468909444444


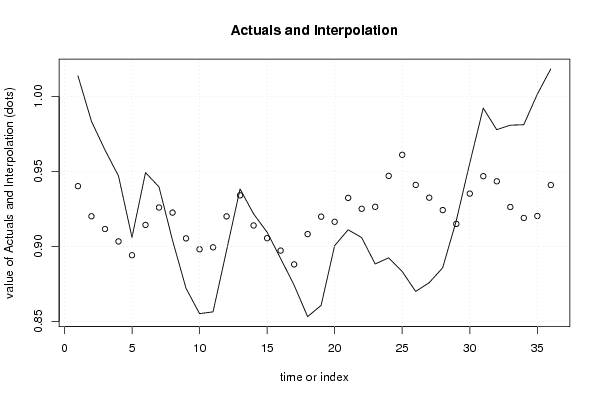
Multiple Linear Regression - Actuals, Interpolation, and Residuals
Time or IndexActualsInterpolationForecastResidualsPrediction Error
11.01370.9401805555555570.0735194444444428
20.98340.9201138888888890.0632861111111113
30.96430.9116138888888890.0526861111111112
40.9470.9033472222222220.0436527777777779
50.9060.8941472222222220.0118527777777779
60.94920.9143472222222220.034852777777778
70.93970.9259472222222220.0137527777777779
80.90410.922547222222222-0.0184472222222220
90.87210.905377777777778-0.0332777777777777
100.85520.898111111111111-0.0429111111111111
110.85640.899411111111111-0.043011111111111
120.89730.920044444444444-0.0227444444444443
130.93830.9340638888888880.00423611111111192
140.92170.9139972222222220.00770277777777766
150.90950.9054972222222220.00400277777777763
160.8920.897230555555556-0.00523055555555562
170.87420.888030555555556-0.0138305555555557
180.85320.908230555555556-0.0550305555555557
190.86070.919830555555556-0.0591305555555556
200.90050.916430555555556-0.0159305555555557
210.91110.932369444444444-0.0212694444444444
220.90590.925102777777778-0.0192027777777777
230.88830.926402777777778-0.0381027777777778
240.89240.947036111111111-0.054636111111111
250.88330.961055555555555-0.0777555555555548
260.870.940988888888889-0.070988888888889
270.87580.932488888888889-0.056688888888889
280.88580.924222222222222-0.0384222222222223
290.9170.9150222222222220.00197777777777774
300.95540.9352222222222220.0201777777777777
310.99220.9468222222222220.0453777777777777
320.97780.9434222222222220.0343777777777777
330.98080.9262527777777780.0545472222222221
340.98110.9189861111111110.0621138888888887
351.00140.9202861111111110.0811138888888887
361.01830.9409194444444450.0773805555555554

\begin{tabular}{lllllllll}
\hline
Multiple Linear Regression - Actuals, Interpolation, and Residuals \tabularnewline
Time or Index & Actuals & InterpolationForecast & ResidualsPrediction Error \tabularnewline
1 & 1.0137 & 0.940180555555557 & 0.0735194444444428 \tabularnewline
2 & 0.9834 & 0.920113888888889 & 0.0632861111111113 \tabularnewline
3 & 0.9643 & 0.911613888888889 & 0.0526861111111112 \tabularnewline
4 & 0.947 & 0.903347222222222 & 0.0436527777777779 \tabularnewline
5 & 0.906 & 0.894147222222222 & 0.0118527777777779 \tabularnewline
6 & 0.9492 & 0.914347222222222 & 0.034852777777778 \tabularnewline
7 & 0.9397 & 0.925947222222222 & 0.0137527777777779 \tabularnewline
8 & 0.9041 & 0.922547222222222 & -0.0184472222222220 \tabularnewline
9 & 0.8721 & 0.905377777777778 & -0.0332777777777777 \tabularnewline
10 & 0.8552 & 0.898111111111111 & -0.0429111111111111 \tabularnewline
11 & 0.8564 & 0.899411111111111 & -0.043011111111111 \tabularnewline
12 & 0.8973 & 0.920044444444444 & -0.0227444444444443 \tabularnewline
13 & 0.9383 & 0.934063888888888 & 0.00423611111111192 \tabularnewline
14 & 0.9217 & 0.913997222222222 & 0.00770277777777766 \tabularnewline
15 & 0.9095 & 0.905497222222222 & 0.00400277777777763 \tabularnewline
16 & 0.892 & 0.897230555555556 & -0.00523055555555562 \tabularnewline
17 & 0.8742 & 0.888030555555556 & -0.0138305555555557 \tabularnewline
18 & 0.8532 & 0.908230555555556 & -0.0550305555555557 \tabularnewline
19 & 0.8607 & 0.919830555555556 & -0.0591305555555556 \tabularnewline
20 & 0.9005 & 0.916430555555556 & -0.0159305555555557 \tabularnewline
21 & 0.9111 & 0.932369444444444 & -0.0212694444444444 \tabularnewline
22 & 0.9059 & 0.925102777777778 & -0.0192027777777777 \tabularnewline
23 & 0.8883 & 0.926402777777778 & -0.0381027777777778 \tabularnewline
24 & 0.8924 & 0.947036111111111 & -0.054636111111111 \tabularnewline
25 & 0.8833 & 0.961055555555555 & -0.0777555555555548 \tabularnewline
26 & 0.87 & 0.940988888888889 & -0.070988888888889 \tabularnewline
27 & 0.8758 & 0.932488888888889 & -0.056688888888889 \tabularnewline
28 & 0.8858 & 0.924222222222222 & -0.0384222222222223 \tabularnewline
29 & 0.917 & 0.915022222222222 & 0.00197777777777774 \tabularnewline
30 & 0.9554 & 0.935222222222222 & 0.0201777777777777 \tabularnewline
31 & 0.9922 & 0.946822222222222 & 0.0453777777777777 \tabularnewline
32 & 0.9778 & 0.943422222222222 & 0.0343777777777777 \tabularnewline
33 & 0.9808 & 0.926252777777778 & 0.0545472222222221 \tabularnewline
34 & 0.9811 & 0.918986111111111 & 0.0621138888888887 \tabularnewline
35 & 1.0014 & 0.920286111111111 & 0.0811138888888887 \tabularnewline
36 & 1.0183 & 0.940919444444445 & 0.0773805555555554 \tabularnewline
\hline
\end{tabular}
%Source: https://freestatistics.org/blog/index.php?pk=25954&T=4

[TABLE]
[ROW][C]Multiple Linear Regression - Actuals, Interpolation, and Residuals[/C][/ROW]
[ROW][C]Time or Index[/C][C]Actuals[/C][C]InterpolationForecast[/C][C]ResidualsPrediction Error[/C][/ROW]
[ROW][C]1[/C][C]1.0137[/C][C]0.940180555555557[/C][C]0.0735194444444428[/C][/ROW]
[ROW][C]2[/C][C]0.9834[/C][C]0.920113888888889[/C][C]0.0632861111111113[/C][/ROW]
[ROW][C]3[/C][C]0.9643[/C][C]0.911613888888889[/C][C]0.0526861111111112[/C][/ROW]
[ROW][C]4[/C][C]0.947[/C][C]0.903347222222222[/C][C]0.0436527777777779[/C][/ROW]
[ROW][C]5[/C][C]0.906[/C][C]0.894147222222222[/C][C]0.0118527777777779[/C][/ROW]
[ROW][C]6[/C][C]0.9492[/C][C]0.914347222222222[/C][C]0.034852777777778[/C][/ROW]
[ROW][C]7[/C][C]0.9397[/C][C]0.925947222222222[/C][C]0.0137527777777779[/C][/ROW]
[ROW][C]8[/C][C]0.9041[/C][C]0.922547222222222[/C][C]-0.0184472222222220[/C][/ROW]
[ROW][C]9[/C][C]0.8721[/C][C]0.905377777777778[/C][C]-0.0332777777777777[/C][/ROW]
[ROW][C]10[/C][C]0.8552[/C][C]0.898111111111111[/C][C]-0.0429111111111111[/C][/ROW]
[ROW][C]11[/C][C]0.8564[/C][C]0.899411111111111[/C][C]-0.043011111111111[/C][/ROW]
[ROW][C]12[/C][C]0.8973[/C][C]0.920044444444444[/C][C]-0.0227444444444443[/C][/ROW]
[ROW][C]13[/C][C]0.9383[/C][C]0.934063888888888[/C][C]0.00423611111111192[/C][/ROW]
[ROW][C]14[/C][C]0.9217[/C][C]0.913997222222222[/C][C]0.00770277777777766[/C][/ROW]
[ROW][C]15[/C][C]0.9095[/C][C]0.905497222222222[/C][C]0.00400277777777763[/C][/ROW]
[ROW][C]16[/C][C]0.892[/C][C]0.897230555555556[/C][C]-0.00523055555555562[/C][/ROW]
[ROW][C]17[/C][C]0.8742[/C][C]0.888030555555556[/C][C]-0.0138305555555557[/C][/ROW]
[ROW][C]18[/C][C]0.8532[/C][C]0.908230555555556[/C][C]-0.0550305555555557[/C][/ROW]
[ROW][C]19[/C][C]0.8607[/C][C]0.919830555555556[/C][C]-0.0591305555555556[/C][/ROW]
[ROW][C]20[/C][C]0.9005[/C][C]0.916430555555556[/C][C]-0.0159305555555557[/C][/ROW]
[ROW][C]21[/C][C]0.9111[/C][C]0.932369444444444[/C][C]-0.0212694444444444[/C][/ROW]
[ROW][C]22[/C][C]0.9059[/C][C]0.925102777777778[/C][C]-0.0192027777777777[/C][/ROW]
[ROW][C]23[/C][C]0.8883[/C][C]0.926402777777778[/C][C]-0.0381027777777778[/C][/ROW]
[ROW][C]24[/C][C]0.8924[/C][C]0.947036111111111[/C][C]-0.054636111111111[/C][/ROW]
[ROW][C]25[/C][C]0.8833[/C][C]0.961055555555555[/C][C]-0.0777555555555548[/C][/ROW]
[ROW][C]26[/C][C]0.87[/C][C]0.940988888888889[/C][C]-0.070988888888889[/C][/ROW]
[ROW][C]27[/C][C]0.8758[/C][C]0.932488888888889[/C][C]-0.056688888888889[/C][/ROW]
[ROW][C]28[/C][C]0.8858[/C][C]0.924222222222222[/C][C]-0.0384222222222223[/C][/ROW]
[ROW][C]29[/C][C]0.917[/C][C]0.915022222222222[/C][C]0.00197777777777774[/C][/ROW]
[ROW][C]30[/C][C]0.9554[/C][C]0.935222222222222[/C][C]0.0201777777777777[/C][/ROW]
[ROW][C]31[/C][C]0.9922[/C][C]0.946822222222222[/C][C]0.0453777777777777[/C][/ROW]
[ROW][C]32[/C][C]0.9778[/C][C]0.943422222222222[/C][C]0.0343777777777777[/C][/ROW]
[ROW][C]33[/C][C]0.9808[/C][C]0.926252777777778[/C][C]0.0545472222222221[/C][/ROW]
[ROW][C]34[/C][C]0.9811[/C][C]0.918986111111111[/C][C]0.0621138888888887[/C][/ROW]
[ROW][C]35[/C][C]1.0014[/C][C]0.920286111111111[/C][C]0.0811138888888887[/C][/ROW]
[ROW][C]36[/C][C]1.0183[/C][C]0.940919444444445[/C][C]0.0773805555555554[/C][/ROW]
[/TABLE]
Source: https://freestatistics.org/blog/index.php?pk=25954&T=4

Globally Unique Identifier (entire table): ba.freestatistics.org/blog/index.php?pk=25954&T=4

As an alternative you can also use a QR Code:  

The GUIDs for individual cells are displayed in the table below:

Multiple Linear Regression - Actuals, Interpolation, and Residuals
Time or IndexActualsInterpolationForecastResidualsPrediction Error
11.01370.9401805555555570.0735194444444428
20.98340.9201138888888890.0632861111111113
30.96430.9116138888888890.0526861111111112
40.9470.9033472222222220.0436527777777779
50.9060.8941472222222220.0118527777777779
60.94920.9143472222222220.034852777777778
70.93970.9259472222222220.0137527777777779
80.90410.922547222222222-0.0184472222222220
90.87210.905377777777778-0.0332777777777777
100.85520.898111111111111-0.0429111111111111
110.85640.899411111111111-0.043011111111111
120.89730.920044444444444-0.0227444444444443
130.93830.9340638888888880.00423611111111192
140.92170.9139972222222220.00770277777777766
150.90950.9054972222222220.00400277777777763
160.8920.897230555555556-0.00523055555555562
170.87420.888030555555556-0.0138305555555557
180.85320.908230555555556-0.0550305555555557
190.86070.919830555555556-0.0591305555555556
200.90050.916430555555556-0.0159305555555557
210.91110.932369444444444-0.0212694444444444
220.90590.925102777777778-0.0192027777777777
230.88830.926402777777778-0.0381027777777778
240.89240.947036111111111-0.054636111111111
250.88330.961055555555555-0.0777555555555548
260.870.940988888888889-0.070988888888889
270.87580.932488888888889-0.056688888888889
280.88580.924222222222222-0.0384222222222223
290.9170.9150222222222220.00197777777777774
300.95540.9352222222222220.0201777777777777
310.99220.9468222222222220.0453777777777777
320.97780.9434222222222220.0343777777777777
330.98080.9262527777777780.0545472222222221
340.98110.9189861111111110.0621138888888887
351.00140.9202861111111110.0811138888888887
361.01830.9409194444444450.0773805555555554


Goldfeld-Quandt test for Heteroskedasticity
p-valuesAlternative Hypothesis
breakpoint indexgreater2-sidedless
170.2649463598135130.5298927196270260.735053640186487
180.3278696252105570.6557392504211130.672130374789443
190.3240584004788390.6481168009576790.67594159952116

\begin{tabular}{lllllllll}
\hline
Goldfeld-Quandt test for Heteroskedasticity \tabularnewline
p-values & Alternative Hypothesis \tabularnewline
breakpoint index & greater & 2-sided & less \tabularnewline
17 & 0.264946359813513 & 0.529892719627026 & 0.735053640186487 \tabularnewline
18 & 0.327869625210557 & 0.655739250421113 & 0.672130374789443 \tabularnewline
19 & 0.324058400478839 & 0.648116800957679 & 0.67594159952116 \tabularnewline
\hline
\end{tabular}
%Source: https://freestatistics.org/blog/index.php?pk=25954&T=5

[TABLE]
[ROW][C]Goldfeld-Quandt test for Heteroskedasticity[/C][/ROW]
[ROW][C]p-values[/C][C]Alternative Hypothesis[/C][/ROW]
[ROW][C]breakpoint index[/C][C]greater[/C][C]2-sided[/C][C]less[/C][/ROW]
[ROW][C]17[/C][C]0.264946359813513[/C][C]0.529892719627026[/C][C]0.735053640186487[/C][/ROW]
[ROW][C]18[/C][C]0.327869625210557[/C][C]0.655739250421113[/C][C]0.672130374789443[/C][/ROW]
[ROW][C]19[/C][C]0.324058400478839[/C][C]0.648116800957679[/C][C]0.67594159952116[/C][/ROW]
[/TABLE]
Source: https://freestatistics.org/blog/index.php?pk=25954&T=5

Globally Unique Identifier (entire table): ba.freestatistics.org/blog/index.php?pk=25954&T=5

As an alternative you can also use a QR Code:  

The GUIDs for individual cells are displayed in the table below:

Goldfeld-Quandt test for Heteroskedasticity
p-valuesAlternative Hypothesis
breakpoint indexgreater2-sidedless
170.2649463598135130.5298927196270260.735053640186487
180.3278696252105570.6557392504211130.672130374789443
190.3240584004788390.6481168009576790.67594159952116


Meta Analysis of Goldfeld-Quandt test for Heteroskedasticity
Description# significant tests% significant testsOK/NOK
1% type I error level00OK
5% type I error level00OK
10% type I error level00OK

\begin{tabular}{lllllllll}
\hline
Meta Analysis of Goldfeld-Quandt test for Heteroskedasticity \tabularnewline
Description & # significant tests & % significant tests & OK/NOK \tabularnewline
1% type I error level & 0 & 0 & OK \tabularnewline
5% type I error level & 0 & 0 & OK \tabularnewline
10% type I error level & 0 & 0 & OK \tabularnewline
\hline
\end{tabular}
%Source: https://freestatistics.org/blog/index.php?pk=25954&T=6

[TABLE]
[ROW][C]Meta Analysis of Goldfeld-Quandt test for Heteroskedasticity[/C][/ROW]
[ROW][C]Description[/C][C]# significant tests[/C][C]% significant tests[/C][C]OK/NOK[/C][/ROW]
[ROW][C]1% type I error level[/C][C]0[/C][C]0[/C][C]OK[/C][/ROW]
[ROW][C]5% type I error level[/C][C]0[/C][C]0[/C][C]OK[/C][/ROW]
[ROW][C]10% type I error level[/C][C]0[/C][C]0[/C][C]OK[/C][/ROW]
[/TABLE]
Source: https://freestatistics.org/blog/index.php?pk=25954&T=6

Globally Unique Identifier (entire table): ba.freestatistics.org/blog/index.php?pk=25954&T=6

As an alternative you can also use a QR Code:  

The GUIDs for individual cells are displayed in the table below:

Meta Analysis of Goldfeld-Quandt test for Heteroskedasticity
Description# significant tests% significant testsOK/NOK
1% type I error level00OK
5% type I error level00OK
10% type I error level00OK


Parameters (Session):
par1 = 1 ; par2 = Include Monthly Dummies ; par3 = Linear Trend ;
Parameters (R input):
par1 = 1 ; par2 = Include Monthly Dummies ; par3 = Linear Trend ;
R code (references can be found in the software module):
library(lattice)
library(lmtest)
n25 <- 25 #minimum number of obs. for Goldfeld-Quandt test
par1 <- as.numeric(par1)
x <- t(y)
k <- length(x[1,])
n <- length(x[,1])
x1 <- cbind(x[,par1], x[,1:k!=par1])
mycolnames <- c(colnames(x)[par1], colnames(x)[1:k!=par1])
colnames(x1) <- mycolnames #colnames(x)[par1]
x <- x1
if (par3 == 'First Differences'){
x2 <- array(0, dim=c(n-1,k), dimnames=list(1:(n-1), paste('(1-B)',colnames(x),sep='')))
for (i in 1:n-1) {
for (j in 1:k) {
x2[i,j] <- x[i+1,j] - x[i,j]
}
}
x <- x2
}
if (par2 == 'Include Monthly Dummies'){
x2 <- array(0, dim=c(n,11), dimnames=list(1:n, paste('M', seq(1:11), sep ='')))
for (i in 1:11){
x2[seq(i,n,12),i] <- 1
}
x <- cbind(x, x2)
}
if (par2 == 'Include Quarterly Dummies'){
x2 <- array(0, dim=c(n,3), dimnames=list(1:n, paste('Q', seq(1:3), sep ='')))
for (i in 1:3){
x2[seq(i,n,4),i] <- 1
}
x <- cbind(x, x2)
}
k <- length(x[1,])
if (par3 == 'Linear Trend'){
x <- cbind(x, c(1:n))
colnames(x)[k+1] <- 't'
}
x
k <- length(x[1,])
df <- as.data.frame(x)
(mylm <- lm(df))
(mysum <- summary(mylm))
if (n > n25) {
kp3 <- k + 3
nmkm3 <- n - k - 3
gqarr <- array(NA, dim=c(nmkm3-kp3+1,3))
numgqtests <- 0
numsignificant1 <- 0
numsignificant5 <- 0
numsignificant10 <- 0
for (mypoint in kp3:nmkm3) {
j <- 0
numgqtests <- numgqtests + 1
for (myalt in c('greater', 'two.sided', 'less')) {
j <- j + 1
gqarr[mypoint-kp3+1,j] <- gqtest(mylm, point=mypoint, alternative=myalt)$p.value
}
if (gqarr[mypoint-kp3+1,2] < 0.01) numsignificant1 <- numsignificant1 + 1
if (gqarr[mypoint-kp3+1,2] < 0.05) numsignificant5 <- numsignificant5 + 1
if (gqarr[mypoint-kp3+1,2] < 0.10) numsignificant10 <- numsignificant10 + 1
}
gqarr
}
bitmap(file='test0.png')
plot(x[,1], type='l', main='Actuals and Interpolation', ylab='value of Actuals and Interpolation (dots)', xlab='time or index')
points(x[,1]-mysum$resid)
grid()
dev.off()
bitmap(file='test1.png')
plot(mysum$resid, type='b', pch=19, main='Residuals', ylab='value of Residuals', xlab='time or index')
grid()
dev.off()
bitmap(file='test2.png')
hist(mysum$resid, main='Residual Histogram', xlab='values of Residuals')
grid()
dev.off()
bitmap(file='test3.png')
densityplot(~mysum$resid,col='black',main='Residual Density Plot', xlab='values of Residuals')
dev.off()
bitmap(file='test4.png')
qqnorm(mysum$resid, main='Residual Normal Q-Q Plot')
qqline(mysum$resid)
grid()
dev.off()
(myerror <- as.ts(mysum$resid))
bitmap(file='test5.png')
dum <- cbind(lag(myerror,k=1),myerror)
dum
dum1 <- dum[2:length(myerror),]
dum1
z <- as.data.frame(dum1)
z
plot(z,main=paste('Residual Lag plot, lowess, and regression line'), ylab='values of Residuals', xlab='lagged values of Residuals')
lines(lowess(z))
abline(lm(z))
grid()
dev.off()
bitmap(file='test6.png')
acf(mysum$resid, lag.max=length(mysum$resid)/2, main='Residual Autocorrelation Function')
grid()
dev.off()
bitmap(file='test7.png')
pacf(mysum$resid, lag.max=length(mysum$resid)/2, main='Residual Partial Autocorrelation Function')
grid()
dev.off()
bitmap(file='test8.png')
opar <- par(mfrow = c(2,2), oma = c(0, 0, 1.1, 0))
plot(mylm, las = 1, sub='Residual Diagnostics')
par(opar)
dev.off()
if (n > n25) {
bitmap(file='test9.png')
plot(kp3:nmkm3,gqarr[,2], main='Goldfeld-Quandt test',ylab='2-sided p-value',xlab='breakpoint')
grid()
dev.off()
}
load(file='createtable')
a<-table.start()
a<-table.row.start(a)
a<-table.element(a, 'Multiple Linear Regression - Estimated Regression Equation', 1, TRUE)
a<-table.row.end(a)
myeq <- colnames(x)[1]
myeq <- paste(myeq, '[t] = ', sep='')
for (i in 1:k){
if (mysum$coefficients[i,1] > 0) myeq <- paste(myeq, '+', '')
myeq <- paste(myeq, mysum$coefficients[i,1], sep=' ')
if (rownames(mysum$coefficients)[i] != '(Intercept)') {
myeq <- paste(myeq, rownames(mysum$coefficients)[i], sep='')
if (rownames(mysum$coefficients)[i] != 't') myeq <- paste(myeq, '[t]', sep='')
}
}
myeq <- paste(myeq, ' + e[t]')
a<-table.row.start(a)
a<-table.element(a, myeq)
a<-table.row.end(a)
a<-table.end(a)
table.save(a,file='mytable1.tab')
a<-table.start()
a<-table.row.start(a)
a<-table.element(a,hyperlink('ols1.htm','Multiple Linear Regression - Ordinary Least Squares',''), 6, TRUE)
a<-table.row.end(a)
a<-table.row.start(a)
a<-table.element(a,'Variable',header=TRUE)
a<-table.element(a,'Parameter',header=TRUE)
a<-table.element(a,'S.D.',header=TRUE)
a<-table.element(a,'T-STAT
H0: parameter = 0',header=TRUE)
a<-table.element(a,'2-tail p-value',header=TRUE)
a<-table.element(a,'1-tail p-value',header=TRUE)
a<-table.row.end(a)
for (i in 1:k){
a<-table.row.start(a)
a<-table.element(a,rownames(mysum$coefficients)[i],header=TRUE)
a<-table.element(a,mysum$coefficients[i,1])
a<-table.element(a, round(mysum$coefficients[i,2],6))
a<-table.element(a, round(mysum$coefficients[i,3],4))
a<-table.element(a, round(mysum$coefficients[i,4],6))
a<-table.element(a, round(mysum$coefficients[i,4]/2,6))
a<-table.row.end(a)
}
a<-table.end(a)
table.save(a,file='mytable2.tab')
a<-table.start()
a<-table.row.start(a)
a<-table.element(a, 'Multiple Linear Regression - Regression Statistics', 2, TRUE)
a<-table.row.end(a)
a<-table.row.start(a)
a<-table.element(a, 'Multiple R',1,TRUE)
a<-table.element(a, sqrt(mysum$r.squared))
a<-table.row.end(a)
a<-table.row.start(a)
a<-table.element(a, 'R-squared',1,TRUE)
a<-table.element(a, mysum$r.squared)
a<-table.row.end(a)
a<-table.row.start(a)
a<-table.element(a, 'Adjusted R-squared',1,TRUE)
a<-table.element(a, mysum$adj.r.squared)
a<-table.row.end(a)
a<-table.row.start(a)
a<-table.element(a, 'F-TEST (value)',1,TRUE)
a<-table.element(a, mysum$fstatistic[1])
a<-table.row.end(a)
a<-table.row.start(a)
a<-table.element(a, 'F-TEST (DF numerator)',1,TRUE)
a<-table.element(a, mysum$fstatistic[2])
a<-table.row.end(a)
a<-table.row.start(a)
a<-table.element(a, 'F-TEST (DF denominator)',1,TRUE)
a<-table.element(a, mysum$fstatistic[3])
a<-table.row.end(a)
a<-table.row.start(a)
a<-table.element(a, 'p-value',1,TRUE)
a<-table.element(a, 1-pf(mysum$fstatistic[1],mysum$fstatistic[2],mysum$fstatistic[3]))
a<-table.row.end(a)
a<-table.row.start(a)
a<-table.element(a, 'Multiple Linear Regression - Residual Statistics', 2, TRUE)
a<-table.row.end(a)
a<-table.row.start(a)
a<-table.element(a, 'Residual Standard Deviation',1,TRUE)
a<-table.element(a, mysum$sigma)
a<-table.row.end(a)
a<-table.row.start(a)
a<-table.element(a, 'Sum Squared Residuals',1,TRUE)
a<-table.element(a, sum(myerror*myerror))
a<-table.row.end(a)
a<-table.end(a)
table.save(a,file='mytable3.tab')
a<-table.start()
a<-table.row.start(a)
a<-table.element(a, 'Multiple Linear Regression - Actuals, Interpolation, and Residuals', 4, TRUE)
a<-table.row.end(a)
a<-table.row.start(a)
a<-table.element(a, 'Time or Index', 1, TRUE)
a<-table.element(a, 'Actuals', 1, TRUE)
a<-table.element(a, 'Interpolation
Forecast', 1, TRUE)
a<-table.element(a, 'Residuals
Prediction Error', 1, TRUE)
a<-table.row.end(a)
for (i in 1:n) {
a<-table.row.start(a)
a<-table.element(a,i, 1, TRUE)
a<-table.element(a,x[i])
a<-table.element(a,x[i]-mysum$resid[i])
a<-table.element(a,mysum$resid[i])
a<-table.row.end(a)
}
a<-table.end(a)
table.save(a,file='mytable4.tab')
if (n > n25) {
a<-table.start()
a<-table.row.start(a)
a<-table.element(a,'Goldfeld-Quandt test for Heteroskedasticity',4,TRUE)
a<-table.row.end(a)
a<-table.row.start(a)
a<-table.element(a,'p-values',header=TRUE)
a<-table.element(a,'Alternative Hypothesis',3,header=TRUE)
a<-table.row.end(a)
a<-table.row.start(a)
a<-table.element(a,'breakpoint index',header=TRUE)
a<-table.element(a,'greater',header=TRUE)
a<-table.element(a,'2-sided',header=TRUE)
a<-table.element(a,'less',header=TRUE)
a<-table.row.end(a)
for (mypoint in kp3:nmkm3) {
a<-table.row.start(a)
a<-table.element(a,mypoint,header=TRUE)
a<-table.element(a,gqarr[mypoint-kp3+1,1])
a<-table.element(a,gqarr[mypoint-kp3+1,2])
a<-table.element(a,gqarr[mypoint-kp3+1,3])
a<-table.row.end(a)
}
a<-table.end(a)
table.save(a,file='mytable5.tab')
a<-table.start()
a<-table.row.start(a)
a<-table.element(a,'Meta Analysis of Goldfeld-Quandt test for Heteroskedasticity',4,TRUE)
a<-table.row.end(a)
a<-table.row.start(a)
a<-table.element(a,'Description',header=TRUE)
a<-table.element(a,'# significant tests',header=TRUE)
a<-table.element(a,'% significant tests',header=TRUE)
a<-table.element(a,'OK/NOK',header=TRUE)
a<-table.row.end(a)
a<-table.row.start(a)
a<-table.element(a,'1% type I error level',header=TRUE)
a<-table.element(a,numsignificant1)
a<-table.element(a,numsignificant1/numgqtests)
if (numsignificant1/numgqtests < 0.01) dum <- 'OK' else dum <- 'NOK'
a<-table.element(a,dum)
a<-table.row.end(a)
a<-table.row.start(a)
a<-table.element(a,'5% type I error level',header=TRUE)
a<-table.element(a,numsignificant5)
a<-table.element(a,numsignificant5/numgqtests)
if (numsignificant5/numgqtests < 0.05) dum <- 'OK' else dum <- 'NOK'
a<-table.element(a,dum)
a<-table.row.end(a)
a<-table.row.start(a)
a<-table.element(a,'10% type I error level',header=TRUE)
a<-table.element(a,numsignificant10)
a<-table.element(a,numsignificant10/numgqtests)
if (numsignificant10/numgqtests < 0.1) dum <- 'OK' else dum <- 'NOK'
a<-table.element(a,dum)
a<-table.row.end(a)
a<-table.end(a)
table.save(a,file='mytable6.tab')
}