Free Statistics

of Irreproducible Research!

Author's title

Author*The author of this computation has been verified*
R Software Modulerwasp_smp.wasp
Title produced by softwareStandard Deviation-Mean Plot
Date of computationThu, 27 Nov 2008 15:18:06 -0700
Cite this page as followsStatistical Computations at FreeStatistics.org, Office for Research Development and Education, URL https://freestatistics.org/blog/index.php?v=date/2008/Nov/27/t1227824336k75lyk70hz0nx4l.htm/, Retrieved Sun, 19 May 2024 10:11:01 +0000
Statistical Computations at FreeStatistics.org, Office for Research Development and Education, URL https://freestatistics.org/blog/index.php?pk=25924, Retrieved Sun, 19 May 2024 10:11:01 +0000
QR Codes:

Original text written by user:
IsPrivate?No (this computation is public)
User-defined keywords
Estimated Impact181
Family? (F = Feedback message, R = changed R code, M = changed R Module, P = changed Parameters, D = changed Data)
F     [Law of Averages] [Random Walk Simul...] [2008-11-25 18:40:39] [b98453cac15ba1066b407e146608df68]
F       [Law of Averages] [Random Walk Simul...] [2008-11-27 19:45:04] [58bf45a666dc5198906262e8815a9722]
F RMPD    [Standard Deviation-Mean Plot] [Standard Deviatio...] [2008-11-27 22:08:29] [58bf45a666dc5198906262e8815a9722]
-    D        [Standard Deviation-Mean Plot] [Standard Deviatio...] [2008-11-27 22:18:06] [63db34dadd44fb018112addcdefe949f] [Current]
Feedback Forum

Post a new message
Dataseries X:
101
88
108
116
104
110
105
107
124
109
102
125
102
101
116
114
115
119
108
110
120
113
111
121
99
104
117
108
122
122
111
111
131
108
118
119
104
105
118
124
123
114
119
116
129
112
123
124
117
110
118
135
127
117
137
130
132
142
122
126


Summary of computational transaction
Raw Inputview raw input (R code)
Raw Outputview raw output of R engine
Computing time2 seconds
R Server'Sir Ronald Aylmer Fisher' @ 193.190.124.24

\begin{tabular}{lllllllll}
\hline
Summary of computational transaction \tabularnewline
Raw Input & view raw input (R code)  \tabularnewline
Raw Output & view raw output of R engine  \tabularnewline
Computing time & 2 seconds \tabularnewline
R Server & 'Sir Ronald Aylmer Fisher' @ 193.190.124.24 \tabularnewline
\hline
\end{tabular}
%Source: https://freestatistics.org/blog/index.php?pk=25924&T=0

[TABLE]
[ROW][C]Summary of computational transaction[/C][/ROW]
[ROW][C]Raw Input[/C][C]view raw input (R code) [/C][/ROW]
[ROW][C]Raw Output[/C][C]view raw output of R engine [/C][/ROW]
[ROW][C]Computing time[/C][C]2 seconds[/C][/ROW]
[ROW][C]R Server[/C][C]'Sir Ronald Aylmer Fisher' @ 193.190.124.24[/C][/ROW]
[/TABLE]
Source: https://freestatistics.org/blog/index.php?pk=25924&T=0

Globally Unique Identifier (entire table): ba.freestatistics.org/blog/index.php?pk=25924&T=0

As an alternative you can also use a QR Code:  

The GUIDs for individual cells are displayed in the table below:

Summary of computational transaction
Raw Inputview raw input (R code)
Raw Outputview raw output of R engine
Computing time2 seconds
R Server'Sir Ronald Aylmer Fisher' @ 193.190.124.24


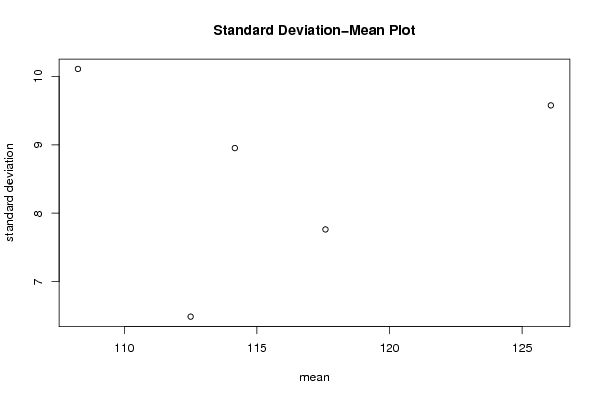
Standard Deviation-Mean Plot
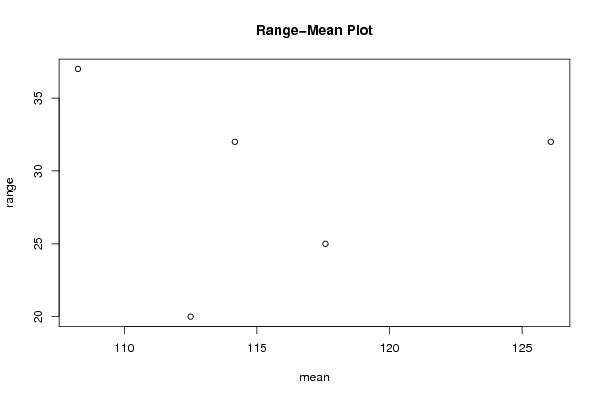
SectionMeanStandard DeviationRange
1108.2510.109626375615737
2112.56.4877506958042920
3114.1666666666678.9527378578575132
4117.5833333333337.7630632816660425
5126.0833333333339.5770400943974832

\begin{tabular}{lllllllll}
\hline
Standard Deviation-Mean Plot \tabularnewline
Section & Mean & Standard Deviation & Range \tabularnewline
1 & 108.25 & 10.1096263756157 & 37 \tabularnewline
2 & 112.5 & 6.48775069580429 & 20 \tabularnewline
3 & 114.166666666667 & 8.95273785785751 & 32 \tabularnewline
4 & 117.583333333333 & 7.76306328166604 & 25 \tabularnewline
5 & 126.083333333333 & 9.57704009439748 & 32 \tabularnewline
\hline
\end{tabular}
%Source: https://freestatistics.org/blog/index.php?pk=25924&T=1

[TABLE]
[ROW][C]Standard Deviation-Mean Plot[/C][/ROW]
[ROW][C]Section[/C][C]Mean[/C][C]Standard Deviation[/C][C]Range[/C][/ROW]
[ROW][C]1[/C][C]108.25[/C][C]10.1096263756157[/C][C]37[/C][/ROW]
[ROW][C]2[/C][C]112.5[/C][C]6.48775069580429[/C][C]20[/C][/ROW]
[ROW][C]3[/C][C]114.166666666667[/C][C]8.95273785785751[/C][C]32[/C][/ROW]
[ROW][C]4[/C][C]117.583333333333[/C][C]7.76306328166604[/C][C]25[/C][/ROW]
[ROW][C]5[/C][C]126.083333333333[/C][C]9.57704009439748[/C][C]32[/C][/ROW]
[/TABLE]
Source: https://freestatistics.org/blog/index.php?pk=25924&T=1

Globally Unique Identifier (entire table): ba.freestatistics.org/blog/index.php?pk=25924&T=1

As an alternative you can also use a QR Code:  

The GUIDs for individual cells are displayed in the table below:

Standard Deviation-Mean Plot
SectionMeanStandard DeviationRange
1108.2510.109626375615737
2112.56.4877506958042920
3114.1666666666678.9527378578575132
4117.5833333333337.7630632816660425
5126.0833333333339.5770400943974832


Regression: S.E.(k) = alpha + beta * Mean(k)
alpha6.29395749351428
beta0.0197386101185706
S.D.0.125266355583334
T-STAT0.157573117112355
p-value0.884801581134944

\begin{tabular}{lllllllll}
\hline
Regression: S.E.(k) = alpha + beta * Mean(k) \tabularnewline
alpha & 6.29395749351428 \tabularnewline
beta & 0.0197386101185706 \tabularnewline
S.D. & 0.125266355583334 \tabularnewline
T-STAT & 0.157573117112355 \tabularnewline
p-value & 0.884801581134944 \tabularnewline
\hline
\end{tabular}
%Source: https://freestatistics.org/blog/index.php?pk=25924&T=2

[TABLE]
[ROW][C]Regression: S.E.(k) = alpha + beta * Mean(k)[/C][/ROW]
[ROW][C]alpha[/C][C]6.29395749351428[/C][/ROW]
[ROW][C]beta[/C][C]0.0197386101185706[/C][/ROW]
[ROW][C]S.D.[/C][C]0.125266355583334[/C][/ROW]
[ROW][C]T-STAT[/C][C]0.157573117112355[/C][/ROW]
[ROW][C]p-value[/C][C]0.884801581134944[/C][/ROW]
[/TABLE]
Source: https://freestatistics.org/blog/index.php?pk=25924&T=2

Globally Unique Identifier (entire table): ba.freestatistics.org/blog/index.php?pk=25924&T=2

As an alternative you can also use a QR Code:  

The GUIDs for individual cells are displayed in the table below:

Regression: S.E.(k) = alpha + beta * Mean(k)
alpha6.29395749351428
beta0.0197386101185706
S.D.0.125266355583334
T-STAT0.157573117112355
p-value0.884801581134944


Regression: ln S.E.(k) = alpha + beta * ln Mean(k)
alpha0.638381802837485
beta0.315472389127337
S.D.1.80114971024408
T-STAT0.175150564849263
p-value0.872115661287936
Lambda0.684527610872663

\begin{tabular}{lllllllll}
\hline
Regression: ln S.E.(k) = alpha + beta * ln Mean(k) \tabularnewline
alpha & 0.638381802837485 \tabularnewline
beta & 0.315472389127337 \tabularnewline
S.D. & 1.80114971024408 \tabularnewline
T-STAT & 0.175150564849263 \tabularnewline
p-value & 0.872115661287936 \tabularnewline
Lambda & 0.684527610872663 \tabularnewline
\hline
\end{tabular}
%Source: https://freestatistics.org/blog/index.php?pk=25924&T=3

[TABLE]
[ROW][C]Regression: ln S.E.(k) = alpha + beta * ln Mean(k)[/C][/ROW]
[ROW][C]alpha[/C][C]0.638381802837485[/C][/ROW]
[ROW][C]beta[/C][C]0.315472389127337[/C][/ROW]
[ROW][C]S.D.[/C][C]1.80114971024408[/C][/ROW]
[ROW][C]T-STAT[/C][C]0.175150564849263[/C][/ROW]
[ROW][C]p-value[/C][C]0.872115661287936[/C][/ROW]
[ROW][C]Lambda[/C][C]0.684527610872663[/C][/ROW]
[/TABLE]
Source: https://freestatistics.org/blog/index.php?pk=25924&T=3

Globally Unique Identifier (entire table): ba.freestatistics.org/blog/index.php?pk=25924&T=3

As an alternative you can also use a QR Code:  

The GUIDs for individual cells are displayed in the table below:

Regression: ln S.E.(k) = alpha + beta * ln Mean(k)
alpha0.638381802837485
beta0.315472389127337
S.D.1.80114971024408
T-STAT0.175150564849263
p-value0.872115661287936
Lambda0.684527610872663


Parameters (Session):
par1 = 12 ;
Parameters (R input):
par1 = 12 ;
R code (references can be found in the software module):
par1 <- as.numeric(par1)
(n <- length(x))
(np <- floor(n / par1))
arr <- array(NA,dim=c(par1,np))
j <- 0
k <- 1
for (i in 1:(np*par1))
{
j = j + 1
arr[j,k] <- x[i]
if (j == par1) {
j = 0
k=k+1
}
}
arr
arr.mean <- array(NA,dim=np)
arr.sd <- array(NA,dim=np)
arr.range <- array(NA,dim=np)
for (j in 1:np)
{
arr.mean[j] <- mean(arr[,j],na.rm=TRUE)
arr.sd[j] <- sd(arr[,j],na.rm=TRUE)
arr.range[j] <- max(arr[,j],na.rm=TRUE) - min(arr[,j],na.rm=TRUE)
}
arr.mean
arr.sd
arr.range
(lm1 <- lm(arr.sd~arr.mean))
(lnlm1 <- lm(log(arr.sd)~log(arr.mean)))
(lm2 <- lm(arr.range~arr.mean))
bitmap(file='test1.png')
plot(arr.mean,arr.sd,main='Standard Deviation-Mean Plot',xlab='mean',ylab='standard deviation')
dev.off()
bitmap(file='test2.png')
plot(arr.mean,arr.range,main='Range-Mean Plot',xlab='mean',ylab='range')
dev.off()
load(file='createtable')
a<-table.start()
a<-table.row.start(a)
a<-table.element(a,'Standard Deviation-Mean Plot',4,TRUE)
a<-table.row.end(a)
a<-table.row.start(a)
a<-table.element(a,'Section',header=TRUE)
a<-table.element(a,'Mean',header=TRUE)
a<-table.element(a,'Standard Deviation',header=TRUE)
a<-table.element(a,'Range',header=TRUE)
a<-table.row.end(a)
for (j in 1:np) {
a<-table.row.start(a)
a<-table.element(a,j,header=TRUE)
a<-table.element(a,arr.mean[j])
a<-table.element(a,arr.sd[j] )
a<-table.element(a,arr.range[j] )
a<-table.row.end(a)
}
a<-table.end(a)
table.save(a,file='mytable.tab')
a<-table.start()
a<-table.row.start(a)
a<-table.element(a,'Regression: S.E.(k) = alpha + beta * Mean(k)',2,TRUE)
a<-table.row.end(a)
a<-table.row.start(a)
a<-table.element(a,'alpha',header=TRUE)
a<-table.element(a,lm1$coefficients[[1]])
a<-table.row.end(a)
a<-table.row.start(a)
a<-table.element(a,'beta',header=TRUE)
a<-table.element(a,lm1$coefficients[[2]])
a<-table.row.end(a)
a<-table.row.start(a)
a<-table.element(a,'S.D.',header=TRUE)
a<-table.element(a,summary(lm1)$coefficients[2,2])
a<-table.row.end(a)
a<-table.row.start(a)
a<-table.element(a,'T-STAT',header=TRUE)
a<-table.element(a,summary(lm1)$coefficients[2,3])
a<-table.row.end(a)
a<-table.row.start(a)
a<-table.element(a,'p-value',header=TRUE)
a<-table.element(a,summary(lm1)$coefficients[2,4])
a<-table.row.end(a)
a<-table.end(a)
table.save(a,file='mytable1.tab')
a<-table.start()
a<-table.row.start(a)
a<-table.element(a,'Regression: ln S.E.(k) = alpha + beta * ln Mean(k)',2,TRUE)
a<-table.row.end(a)
a<-table.row.start(a)
a<-table.element(a,'alpha',header=TRUE)
a<-table.element(a,lnlm1$coefficients[[1]])
a<-table.row.end(a)
a<-table.row.start(a)
a<-table.element(a,'beta',header=TRUE)
a<-table.element(a,lnlm1$coefficients[[2]])
a<-table.row.end(a)
a<-table.row.start(a)
a<-table.element(a,'S.D.',header=TRUE)
a<-table.element(a,summary(lnlm1)$coefficients[2,2])
a<-table.row.end(a)
a<-table.row.start(a)
a<-table.element(a,'T-STAT',header=TRUE)
a<-table.element(a,summary(lnlm1)$coefficients[2,3])
a<-table.row.end(a)
a<-table.row.start(a)
a<-table.element(a,'p-value',header=TRUE)
a<-table.element(a,summary(lnlm1)$coefficients[2,4])
a<-table.row.end(a)
a<-table.row.start(a)
a<-table.element(a,'Lambda',header=TRUE)
a<-table.element(a,1-lnlm1$coefficients[[2]])
a<-table.row.end(a)
a<-table.end(a)
table.save(a,file='mytable2.tab')