Free Statistics

of Irreproducible Research!

Author's title

Author*Unverified author*
R Software Modulerwasp_multipleregression.wasp
Title produced by softwareMultiple Regression
Date of computationThu, 27 Nov 2008 13:01:56 -0700
Cite this page as followsStatistical Computations at FreeStatistics.org, Office for Research Development and Education, URL https://freestatistics.org/blog/index.php?v=date/2008/Nov/27/t12278163509ba9muabxbjjfca.htm/, Retrieved Sun, 19 May 2024 09:45:30 +0000
Statistical Computations at FreeStatistics.org, Office for Research Development and Education, URL https://freestatistics.org/blog/index.php?pk=25890, Retrieved Sun, 19 May 2024 09:45:30 +0000
QR Codes:

Original text written by user:
IsPrivate?No (this computation is public)
User-defined keywords
Estimated Impact155
Family? (F = Feedback message, R = changed R code, M = changed R Module, P = changed Parameters, D = changed Data)
-     [Multiple Regression] [Q1 The Seatbeltlaw] [2007-11-14 19:27:43] [8cd6641b921d30ebe00b648d1481bba0]
F R  D    [Multiple Regression] [] [2008-11-27 20:01:56] [0655940460a4fd80d3d4d54548b75d49] [Current]
Feedback Forum
2008-11-29 14:42:51 [Ken Wright] [reply
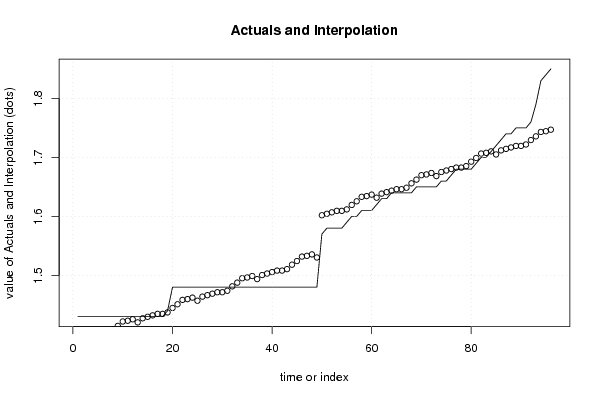
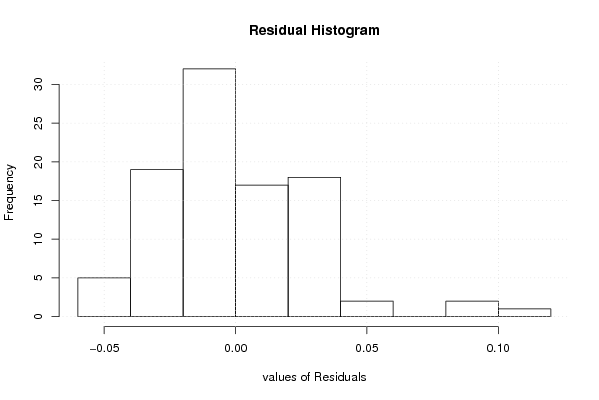
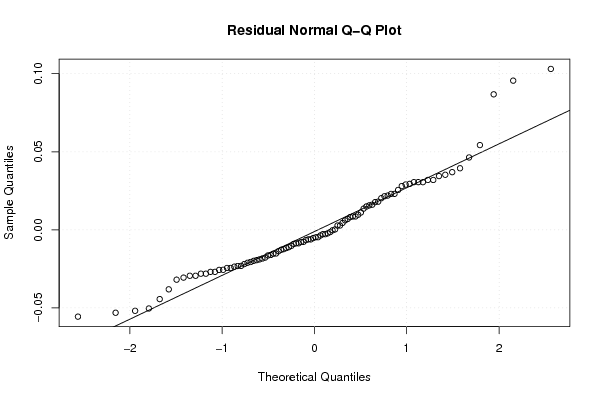
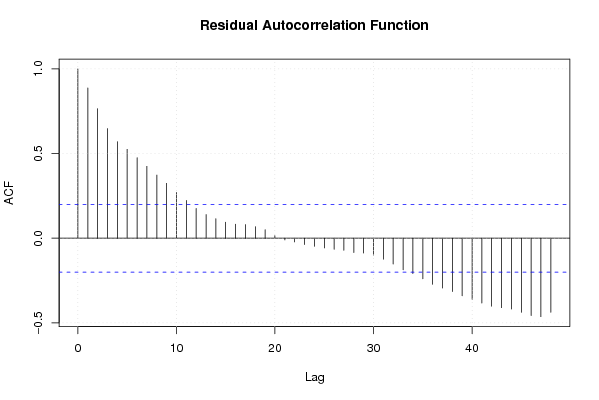
Je stelt dat de vrijmaking van de maximumprijs van brood geen effect heeft. Maar uit je R square kan je zien dat deze 93% is, dus dit wilt zeggen dat de dummy een zeer grote invloed heeft. Zo kan je ook zien bij de grafiek actuals and interpolation dat er rond de 5ste waarde een significante stijging is. Bij jouw tijdreeks kan men ook stellen dat er zeker geen seizoenaliteit is. Want de p-value is telkens groter als 0,05. Natuurlijk kan er nog aan het model gewerkt worden, dit kan je bv afleiden uit het histogram dat niet echt een normaalverdeling volgt of bij de autocorrelatie waar je uit kan afleiden doordat veel staafjes buiten de 95% betrouwbaarinterval liggen dat er kan worden voorspeld op basis van het verleden, dat niet goed is.
2008-12-01 14:55:23 [Erik Geysen] [reply
De Adjusted R-squared is 93% wat goed is. Dit wil zeggen dat we heel veel van de gegevens kunnen verklaren. Vroeger werd er een maximumprijs opgelegd. Daarom kijken we naar de one-tail P-value. We verwachten als er dan al iets gebeurd dat het een stijging zal zijn en zeker geen daling.
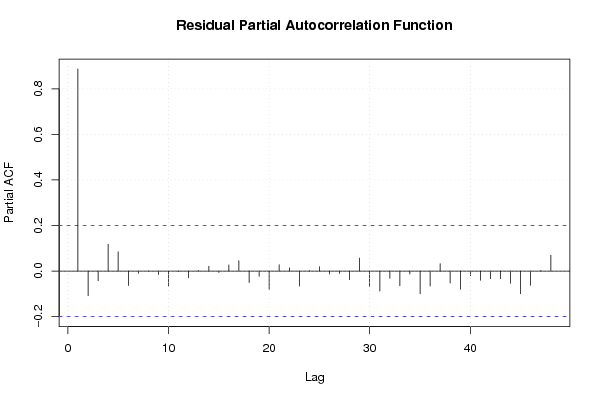
Op de residual autocorrelattion function zien we bijna elk staafje buiten het betrouwbaarheidsinterval(=95%) komen. Daarom kunnen we zeggen dat het niet betrouwbaar is. Als de ene dag de prijs van een brood zeer hoog is, is de kans groot dat het de volgende dag ook nog zeer hoog zal zijn. De kans op een stijging of daling is 50%/. Het is dus voorspellen op basis van het verleden.
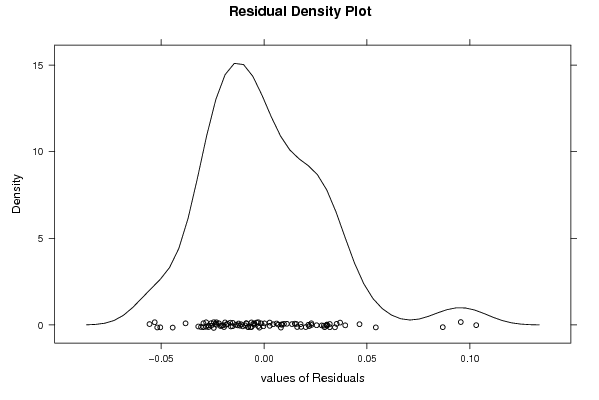
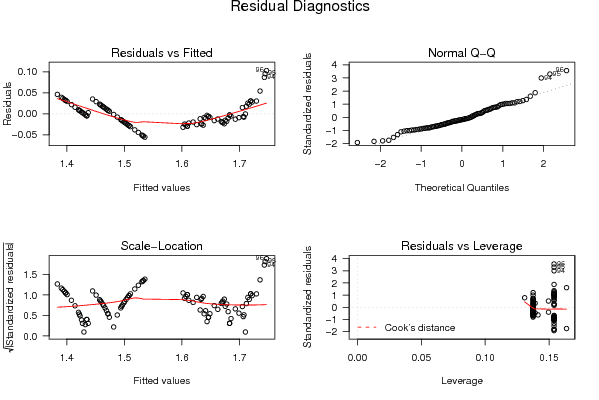
Nog zien we dat het histogram geen normaalverdeling weergeeft.
2008-12-01 18:55:03 [Bénédicte Soens] [reply
De r-kwadraat waarde is hier 93% en dit is zeer goed. Hierbij kunnen we zeggen dat 93% van de schommelingen van de gegevens te verklaren is. Wanneer we kijken naar de p-waarde (<0,05) kunnen we zeggen dat dit significant verschillend is van 0 (0-hypothese)is en dat het niet toe te wijzen valt aan toeval. Er werden geen grafieken weergegeven met uitleg. (Voor iets gelijkaardige uitleg zou ik kijken naar het antwoord dat ik gegeven heb op Q2 op het forum).
Een algemeen besluit kan ik wel formuleren: We kunnen zeggen dat dit geen perfect model is en dat er nog verbeteringen aan het onderzoek kunnen toegepast worden . Om aan de assumpties te voldoen zijn er 2 voorwaarden:
1. geen patroon of autocorrelatie: Daarbij kijken we naar de residual autocorrelation function, we kunne vaststellen dat er geen patroon is, dus aan deze voorwaarde werd voldaan.
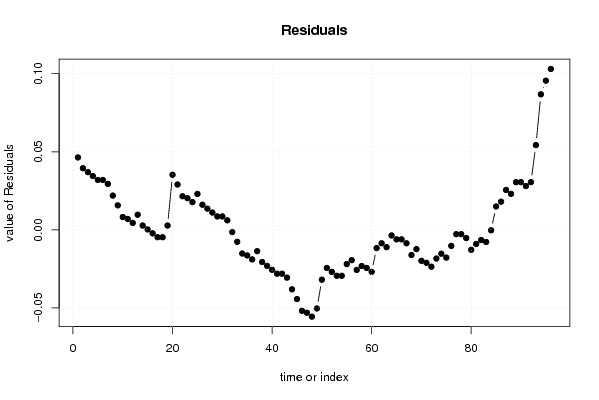
2. het gemiddelde moet constant en 0 zijn: hierbij kijken we naar de grafiek van de residuals. Daarbij is vrij duidelijk dat dit niet constant is en ook verschillend van 0. Dus aan deze voorwaarde werd niet voldaan.

Post a new message
Dataseries X:
1.43	0
1.43	0
1.43	0
1.43	0
1.43	0
1.43	0
1.43	0
1.43	0
1.43	0
1.43	0
1.43	0
1.43	0
1.43	0
1.43	0
1.43	0
1.43	0
1.43	0
1.43	0
1.44	0
1.48	0
1.48	0
1.48	0
1.48	0
1.48	0
1.48	0
1.48	0
1.48	0
1.48	0
1.48	0
1.48	0
1.48	0
1.48	0
1.48	0
1.48	0
1.48	0
1.48	0
1.48	0
1.48	0
1.48	0
1.48	0
1.48	0
1.48	0
1.48	0
1.48	0
1.48	0
1.48	0
1.48	0
1.48	0
1.48	0
1.57	1
1.58	1
1.58	1
1.58	1
1.58	1
1.59	1
1.6	1
1.6	1
1.61	1
1.61	1
1.61	1
1.62	1
1.63	1
1.63	1
1.64	1
1.64	1
1.64	1
1.64	1
1.64	1
1.65	1
1.65	1
1.65	1
1.65	1
1.65	1
1.66	1
1.66	1
1.67	1
1.68	1
1.68	1
1.68	1
1.68	1
1.69	1
1.7	1
1.7	1
1.71	1
1.72	1
1.73	1
1.74	1
1.74	1
1.75	1
1.75	1
1.75	1
1.76	1
1.79	1
1.83	1
1.84	1
1.85	1


Summary of computational transaction
Raw Inputview raw input (R code)
Raw Outputview raw output of R engine
Computing time5 seconds
R Server'Sir Ronald Aylmer Fisher' @ 193.190.124.24

\begin{tabular}{lllllllll}
\hline
Summary of computational transaction \tabularnewline
Raw Input & view raw input (R code)  \tabularnewline
Raw Output & view raw output of R engine  \tabularnewline
Computing time & 5 seconds \tabularnewline
R Server & 'Sir Ronald Aylmer Fisher' @ 193.190.124.24 \tabularnewline
\hline
\end{tabular}
%Source: https://freestatistics.org/blog/index.php?pk=25890&T=0

[TABLE]
[ROW][C]Summary of computational transaction[/C][/ROW]
[ROW][C]Raw Input[/C][C]view raw input (R code) [/C][/ROW]
[ROW][C]Raw Output[/C][C]view raw output of R engine [/C][/ROW]
[ROW][C]Computing time[/C][C]5 seconds[/C][/ROW]
[ROW][C]R Server[/C][C]'Sir Ronald Aylmer Fisher' @ 193.190.124.24[/C][/ROW]
[/TABLE]
Source: https://freestatistics.org/blog/index.php?pk=25890&T=0

Globally Unique Identifier (entire table): ba.freestatistics.org/blog/index.php?pk=25890&T=0

As an alternative you can also use a QR Code:  

The GUIDs for individual cells are displayed in the table below:

Summary of computational transaction
Raw Inputview raw input (R code)
Raw Outputview raw output of R engine
Computing time5 seconds
R Server'Sir Ronald Aylmer Fisher' @ 193.190.124.24


Multiple Linear Regression - Estimated Regression Equation
Y[t] = + 1.38886855205562 + 0.064639945069093X[t] -0.0082963729865816M1[t] -0.00443306010928969M2[t] -0.00498975409836072M3[t] -0.00554644808743174M4[t] -0.00610314207650277M5[t] -0.0091598360655738M6[t] -0.00971653005464484M7[t] -0.00527322404371587M8[t] -0.0020799180327869M9[t] + 0.00236338797814207M10[t] + 0.000556693989071041M11[t] + 0.00305669398907103t + e[t]

\begin{tabular}{lllllllll}
\hline
Multiple Linear Regression - Estimated Regression Equation \tabularnewline
Y[t] =  +  1.38886855205562 +  0.064639945069093X[t] -0.0082963729865816M1[t] -0.00443306010928969M2[t] -0.00498975409836072M3[t] -0.00554644808743174M4[t] -0.00610314207650277M5[t] -0.0091598360655738M6[t] -0.00971653005464484M7[t] -0.00527322404371587M8[t] -0.0020799180327869M9[t] +  0.00236338797814207M10[t] +  0.000556693989071041M11[t] +  0.00305669398907103t  + e[t] \tabularnewline
\hline
\end{tabular}
%Source: https://freestatistics.org/blog/index.php?pk=25890&T=1

[TABLE]
[ROW][C]Multiple Linear Regression - Estimated Regression Equation[/C][/ROW]
[ROW][C]Y[t] =  +  1.38886855205562 +  0.064639945069093X[t] -0.0082963729865816M1[t] -0.00443306010928969M2[t] -0.00498975409836072M3[t] -0.00554644808743174M4[t] -0.00610314207650277M5[t] -0.0091598360655738M6[t] -0.00971653005464484M7[t] -0.00527322404371587M8[t] -0.0020799180327869M9[t] +  0.00236338797814207M10[t] +  0.000556693989071041M11[t] +  0.00305669398907103t  + e[t][/C][/ROW]
[/TABLE]
Source: https://freestatistics.org/blog/index.php?pk=25890&T=1

Globally Unique Identifier (entire table): ba.freestatistics.org/blog/index.php?pk=25890&T=1

As an alternative you can also use a QR Code:  

The GUIDs for individual cells are displayed in the table below:

Multiple Linear Regression - Estimated Regression Equation
Y[t] = + 1.38886855205562 + 0.064639945069093X[t] -0.0082963729865816M1[t] -0.00443306010928969M2[t] -0.00498975409836072M3[t] -0.00554644808743174M4[t] -0.00610314207650277M5[t] -0.0091598360655738M6[t] -0.00971653005464484M7[t] -0.00527322404371587M8[t] -0.0020799180327869M9[t] + 0.00236338797814207M10[t] + 0.000556693989071041M11[t] + 0.00305669398907103t + e[t]


Multiple Linear Regression - Ordinary Least Squares
VariableParameterS.D.T-STATH0: parameter = 02-tail p-value1-tail p-value
(Intercept)1.388868552055620.013597102.145700
X0.0646399450690930.013094.93824e-062e-06
M1-0.00829637298658160.015799-0.52510.6009210.300461
M2-0.004433060109289690.015912-0.27860.7812550.390628
M3-0.004989754098360720.015878-0.31420.7541310.377065
M4-0.005546448087431740.015848-0.350.7272560.363628
M5-0.006103142076502770.015821-0.38580.700680.35034
M6-0.00915983606557380.015798-0.57980.563640.28182
M7-0.009716530054644840.015779-0.61580.5397310.269866
M8-0.005273224043715870.015763-0.33450.7388260.369413
M9-0.00207991803278690.01575-0.13210.8952620.447631
M100.002363387978142070.0157410.15010.8810220.440511
M110.0005566939890710410.0157360.03540.9718650.485932
t0.003056693989071030.00023712.874900

\begin{tabular}{lllllllll}
\hline
Multiple Linear Regression - Ordinary Least Squares \tabularnewline
Variable & Parameter & S.D. & T-STATH0: parameter = 0 & 2-tail p-value & 1-tail p-value \tabularnewline
(Intercept) & 1.38886855205562 & 0.013597 & 102.1457 & 0 & 0 \tabularnewline
X & 0.064639945069093 & 0.01309 & 4.9382 & 4e-06 & 2e-06 \tabularnewline
M1 & -0.0082963729865816 & 0.015799 & -0.5251 & 0.600921 & 0.300461 \tabularnewline
M2 & -0.00443306010928969 & 0.015912 & -0.2786 & 0.781255 & 0.390628 \tabularnewline
M3 & -0.00498975409836072 & 0.015878 & -0.3142 & 0.754131 & 0.377065 \tabularnewline
M4 & -0.00554644808743174 & 0.015848 & -0.35 & 0.727256 & 0.363628 \tabularnewline
M5 & -0.00610314207650277 & 0.015821 & -0.3858 & 0.70068 & 0.35034 \tabularnewline
M6 & -0.0091598360655738 & 0.015798 & -0.5798 & 0.56364 & 0.28182 \tabularnewline
M7 & -0.00971653005464484 & 0.015779 & -0.6158 & 0.539731 & 0.269866 \tabularnewline
M8 & -0.00527322404371587 & 0.015763 & -0.3345 & 0.738826 & 0.369413 \tabularnewline
M9 & -0.0020799180327869 & 0.01575 & -0.1321 & 0.895262 & 0.447631 \tabularnewline
M10 & 0.00236338797814207 & 0.015741 & 0.1501 & 0.881022 & 0.440511 \tabularnewline
M11 & 0.000556693989071041 & 0.015736 & 0.0354 & 0.971865 & 0.485932 \tabularnewline
t & 0.00305669398907103 & 0.000237 & 12.8749 & 0 & 0 \tabularnewline
\hline
\end{tabular}
%Source: https://freestatistics.org/blog/index.php?pk=25890&T=2

[TABLE]
[ROW][C]Multiple Linear Regression - Ordinary Least Squares[/C][/ROW]
[ROW][C]Variable[/C][C]Parameter[/C][C]S.D.[/C][C]T-STATH0: parameter = 0[/C][C]2-tail p-value[/C][C]1-tail p-value[/C][/ROW]
[ROW][C](Intercept)[/C][C]1.38886855205562[/C][C]0.013597[/C][C]102.1457[/C][C]0[/C][C]0[/C][/ROW]
[ROW][C]X[/C][C]0.064639945069093[/C][C]0.01309[/C][C]4.9382[/C][C]4e-06[/C][C]2e-06[/C][/ROW]
[ROW][C]M1[/C][C]-0.0082963729865816[/C][C]0.015799[/C][C]-0.5251[/C][C]0.600921[/C][C]0.300461[/C][/ROW]
[ROW][C]M2[/C][C]-0.00443306010928969[/C][C]0.015912[/C][C]-0.2786[/C][C]0.781255[/C][C]0.390628[/C][/ROW]
[ROW][C]M3[/C][C]-0.00498975409836072[/C][C]0.015878[/C][C]-0.3142[/C][C]0.754131[/C][C]0.377065[/C][/ROW]
[ROW][C]M4[/C][C]-0.00554644808743174[/C][C]0.015848[/C][C]-0.35[/C][C]0.727256[/C][C]0.363628[/C][/ROW]
[ROW][C]M5[/C][C]-0.00610314207650277[/C][C]0.015821[/C][C]-0.3858[/C][C]0.70068[/C][C]0.35034[/C][/ROW]
[ROW][C]M6[/C][C]-0.0091598360655738[/C][C]0.015798[/C][C]-0.5798[/C][C]0.56364[/C][C]0.28182[/C][/ROW]
[ROW][C]M7[/C][C]-0.00971653005464484[/C][C]0.015779[/C][C]-0.6158[/C][C]0.539731[/C][C]0.269866[/C][/ROW]
[ROW][C]M8[/C][C]-0.00527322404371587[/C][C]0.015763[/C][C]-0.3345[/C][C]0.738826[/C][C]0.369413[/C][/ROW]
[ROW][C]M9[/C][C]-0.0020799180327869[/C][C]0.01575[/C][C]-0.1321[/C][C]0.895262[/C][C]0.447631[/C][/ROW]
[ROW][C]M10[/C][C]0.00236338797814207[/C][C]0.015741[/C][C]0.1501[/C][C]0.881022[/C][C]0.440511[/C][/ROW]
[ROW][C]M11[/C][C]0.000556693989071041[/C][C]0.015736[/C][C]0.0354[/C][C]0.971865[/C][C]0.485932[/C][/ROW]
[ROW][C]t[/C][C]0.00305669398907103[/C][C]0.000237[/C][C]12.8749[/C][C]0[/C][C]0[/C][/ROW]
[/TABLE]
Source: https://freestatistics.org/blog/index.php?pk=25890&T=2

Globally Unique Identifier (entire table): ba.freestatistics.org/blog/index.php?pk=25890&T=2

As an alternative you can also use a QR Code:  

The GUIDs for individual cells are displayed in the table below:

Multiple Linear Regression - Ordinary Least Squares
VariableParameterS.D.T-STATH0: parameter = 02-tail p-value1-tail p-value
(Intercept)1.388868552055620.013597102.145700
X0.0646399450690930.013094.93824e-062e-06
M1-0.00829637298658160.015799-0.52510.6009210.300461
M2-0.004433060109289690.015912-0.27860.7812550.390628
M3-0.004989754098360720.015878-0.31420.7541310.377065
M4-0.005546448087431740.015848-0.350.7272560.363628
M5-0.006103142076502770.015821-0.38580.700680.35034
M6-0.00915983606557380.015798-0.57980.563640.28182
M7-0.009716530054644840.015779-0.61580.5397310.269866
M8-0.005273224043715870.015763-0.33450.7388260.369413
M9-0.00207991803278690.01575-0.13210.8952620.447631
M100.002363387978142070.0157410.15010.8810220.440511
M110.0005566939890710410.0157360.03540.9718650.485932
t0.003056693989071030.00023712.874900


Multiple Linear Regression - Regression Statistics
Multiple R0.96904457174087
R-squared0.939047382020445
Adjusted R-squared0.929384162096857
F-TEST (value)97.1774821897844
F-TEST (DF numerator)13
F-TEST (DF denominator)82
p-value0
Multiple Linear Regression - Residual Statistics
Residual Standard Deviation0.0314679069865167
Sum Squared Residuals0.0811987919491892

\begin{tabular}{lllllllll}
\hline
Multiple Linear Regression - Regression Statistics \tabularnewline
Multiple R & 0.96904457174087 \tabularnewline
R-squared & 0.939047382020445 \tabularnewline
Adjusted R-squared & 0.929384162096857 \tabularnewline
F-TEST (value) & 97.1774821897844 \tabularnewline
F-TEST (DF numerator) & 13 \tabularnewline
F-TEST (DF denominator) & 82 \tabularnewline
p-value & 0 \tabularnewline
Multiple Linear Regression - Residual Statistics \tabularnewline
Residual Standard Deviation & 0.0314679069865167 \tabularnewline
Sum Squared Residuals & 0.0811987919491892 \tabularnewline
\hline
\end{tabular}
%Source: https://freestatistics.org/blog/index.php?pk=25890&T=3

[TABLE]
[ROW][C]Multiple Linear Regression - Regression Statistics[/C][/ROW]
[ROW][C]Multiple R[/C][C]0.96904457174087[/C][/ROW]
[ROW][C]R-squared[/C][C]0.939047382020445[/C][/ROW]
[ROW][C]Adjusted R-squared[/C][C]0.929384162096857[/C][/ROW]
[ROW][C]F-TEST (value)[/C][C]97.1774821897844[/C][/ROW]
[ROW][C]F-TEST (DF numerator)[/C][C]13[/C][/ROW]
[ROW][C]F-TEST (DF denominator)[/C][C]82[/C][/ROW]
[ROW][C]p-value[/C][C]0[/C][/ROW]
[ROW][C]Multiple Linear Regression - Residual Statistics[/C][/ROW]
[ROW][C]Residual Standard Deviation[/C][C]0.0314679069865167[/C][/ROW]
[ROW][C]Sum Squared Residuals[/C][C]0.0811987919491892[/C][/ROW]
[/TABLE]
Source: https://freestatistics.org/blog/index.php?pk=25890&T=3

Globally Unique Identifier (entire table): ba.freestatistics.org/blog/index.php?pk=25890&T=3

As an alternative you can also use a QR Code:  

The GUIDs for individual cells are displayed in the table below:

Multiple Linear Regression - Regression Statistics
Multiple R0.96904457174087
R-squared0.939047382020445
Adjusted R-squared0.929384162096857
F-TEST (value)97.1774821897844
F-TEST (DF numerator)13
F-TEST (DF denominator)82
p-value0
Multiple Linear Regression - Residual Statistics
Residual Standard Deviation0.0314679069865167
Sum Squared Residuals0.0811987919491892


Multiple Linear Regression - Actuals, Interpolation, and Residuals
Time or IndexActualsInterpolationForecastResidualsPrediction Error
11.431.383628873058100.0463711269418962
21.431.390548879924470.0394511200755299
31.431.393048879924470.0369511200755299
41.431.395548879924470.0344511200755299
51.431.398048879924470.0319511200755299
61.431.398048879924470.0319511200755299
71.431.400548879924470.0294511200755299
81.431.408048879924470.0219511200755299
91.431.414298879924470.0157011200755299
101.431.421798879924470.00820112007552986
111.431.423048879924470.00695112007552987
121.431.425548879924470.00445112007552987
131.431.420309200926960.00969079907304043
141.431.427229207793320.0027707922066774
151.431.429729207793320.000270792206677471
161.431.43222920779332-0.00222920779332253
171.431.43472920779332-0.00472920779332254
181.431.43472920779332-0.00472920779332254
191.441.437229207793320.00277079220667747
201.481.444729207793320.0352707922066775
211.481.450979207793320.0290207922066775
221.481.458479207793320.0215207922066775
231.481.459729207793320.0202707922066775
241.481.462229207793320.0177707922066775
251.481.456989528795810.0230104712041881
261.481.463909535662170.0160904643378251
271.481.466409535662170.0135904643378251
281.481.468909535662170.0110904643378251
291.481.471409535662170.0085904643378251
301.481.471409535662170.0085904643378251
311.481.473909535662170.0060904643378251
321.481.48140953566217-0.00140953566217490
331.481.48765953566217-0.00765953566217491
341.481.49515953566217-0.0151595356621749
351.481.49640953566217-0.0164095356621749
361.481.49890953566217-0.0189095356621749
371.481.49366985666466-0.0136698566646643
381.481.50058986353103-0.0205898635310273
391.481.50308986353103-0.0230898635310273
401.481.50558986353103-0.0255898635310273
411.481.50808986353103-0.0280898635310273
421.481.50808986353103-0.0280898635310273
431.481.51058986353103-0.0305898635310273
441.481.51808986353103-0.0380898635310273
451.481.52433986353103-0.0443398635310273
461.481.53183986353103-0.0518398635310273
471.481.53308986353103-0.0530898635310273
481.481.53558986353103-0.0555898635310273
491.481.53035018453352-0.0503501845335167
501.571.60191013646897-0.0319101364689726
511.581.60441013646897-0.0244101364689726
521.581.60691013646897-0.0269101364689726
531.581.60941013646897-0.0294101364689726
541.581.60941013646897-0.0294101364689726
551.591.61191013646897-0.0219101364689726
561.61.61941013646897-0.0194101364689726
571.61.62566013646897-0.0256601364689726
581.611.63316013646897-0.0231601364689726
591.611.63441013646897-0.0244101364689726
601.611.63691013646897-0.0269101364689726
611.621.63167045747146-0.0116704574714620
621.631.63859046433783-0.00859046433782516
631.631.64109046433783-0.0110904643378252
641.641.64359046433783-0.00359046433782517
651.641.64609046433783-0.00609046433782518
661.641.64609046433783-0.00609046433782518
671.641.64859046433783-0.00859046433782518
681.641.65609046433783-0.0160904643378252
691.651.66234046433783-0.0123404643378252
701.651.66984046433783-0.0198404643378252
711.651.67109046433783-0.0210904643378252
721.651.67359046433782-0.0235904643378252
731.651.66835078534031-0.0183507853403146
741.661.67527079220668-0.0152707922066775
751.661.67777079220668-0.0177707922066776
761.671.68027079220668-0.0102707922066775
771.681.68277079220668-0.00277079220667754
781.681.68277079220668-0.00277079220667753
791.681.68527079220668-0.00527079220667753
801.681.69277079220668-0.0127707922066775
811.691.69902079220668-0.00902079220667754
821.71.70652079220668-0.00652079220667754
831.71.70777079220668-0.00777079220667754
841.711.71027079220668-0.000270792206677525
851.721.705031113209170.0149688867908331
861.731.711951120075530.0180488799244701
871.741.714451120075530.0255488799244701
881.741.716951120075530.0230488799244701
891.751.719451120075530.0305488799244701
901.751.719451120075530.0305488799244701
911.751.721951120075530.0280488799244701
921.761.729451120075530.0305488799244701
931.791.735701120075530.0542988799244702
941.831.743201120075530.0867988799244702
951.841.744451120075530.0955488799244702
961.851.746951120075530.103048879924470

\begin{tabular}{lllllllll}
\hline
Multiple Linear Regression - Actuals, Interpolation, and Residuals \tabularnewline
Time or Index & Actuals & InterpolationForecast & ResidualsPrediction Error \tabularnewline
1 & 1.43 & 1.38362887305810 & 0.0463711269418962 \tabularnewline
2 & 1.43 & 1.39054887992447 & 0.0394511200755299 \tabularnewline
3 & 1.43 & 1.39304887992447 & 0.0369511200755299 \tabularnewline
4 & 1.43 & 1.39554887992447 & 0.0344511200755299 \tabularnewline
5 & 1.43 & 1.39804887992447 & 0.0319511200755299 \tabularnewline
6 & 1.43 & 1.39804887992447 & 0.0319511200755299 \tabularnewline
7 & 1.43 & 1.40054887992447 & 0.0294511200755299 \tabularnewline
8 & 1.43 & 1.40804887992447 & 0.0219511200755299 \tabularnewline
9 & 1.43 & 1.41429887992447 & 0.0157011200755299 \tabularnewline
10 & 1.43 & 1.42179887992447 & 0.00820112007552986 \tabularnewline
11 & 1.43 & 1.42304887992447 & 0.00695112007552987 \tabularnewline
12 & 1.43 & 1.42554887992447 & 0.00445112007552987 \tabularnewline
13 & 1.43 & 1.42030920092696 & 0.00969079907304043 \tabularnewline
14 & 1.43 & 1.42722920779332 & 0.0027707922066774 \tabularnewline
15 & 1.43 & 1.42972920779332 & 0.000270792206677471 \tabularnewline
16 & 1.43 & 1.43222920779332 & -0.00222920779332253 \tabularnewline
17 & 1.43 & 1.43472920779332 & -0.00472920779332254 \tabularnewline
18 & 1.43 & 1.43472920779332 & -0.00472920779332254 \tabularnewline
19 & 1.44 & 1.43722920779332 & 0.00277079220667747 \tabularnewline
20 & 1.48 & 1.44472920779332 & 0.0352707922066775 \tabularnewline
21 & 1.48 & 1.45097920779332 & 0.0290207922066775 \tabularnewline
22 & 1.48 & 1.45847920779332 & 0.0215207922066775 \tabularnewline
23 & 1.48 & 1.45972920779332 & 0.0202707922066775 \tabularnewline
24 & 1.48 & 1.46222920779332 & 0.0177707922066775 \tabularnewline
25 & 1.48 & 1.45698952879581 & 0.0230104712041881 \tabularnewline
26 & 1.48 & 1.46390953566217 & 0.0160904643378251 \tabularnewline
27 & 1.48 & 1.46640953566217 & 0.0135904643378251 \tabularnewline
28 & 1.48 & 1.46890953566217 & 0.0110904643378251 \tabularnewline
29 & 1.48 & 1.47140953566217 & 0.0085904643378251 \tabularnewline
30 & 1.48 & 1.47140953566217 & 0.0085904643378251 \tabularnewline
31 & 1.48 & 1.47390953566217 & 0.0060904643378251 \tabularnewline
32 & 1.48 & 1.48140953566217 & -0.00140953566217490 \tabularnewline
33 & 1.48 & 1.48765953566217 & -0.00765953566217491 \tabularnewline
34 & 1.48 & 1.49515953566217 & -0.0151595356621749 \tabularnewline
35 & 1.48 & 1.49640953566217 & -0.0164095356621749 \tabularnewline
36 & 1.48 & 1.49890953566217 & -0.0189095356621749 \tabularnewline
37 & 1.48 & 1.49366985666466 & -0.0136698566646643 \tabularnewline
38 & 1.48 & 1.50058986353103 & -0.0205898635310273 \tabularnewline
39 & 1.48 & 1.50308986353103 & -0.0230898635310273 \tabularnewline
40 & 1.48 & 1.50558986353103 & -0.0255898635310273 \tabularnewline
41 & 1.48 & 1.50808986353103 & -0.0280898635310273 \tabularnewline
42 & 1.48 & 1.50808986353103 & -0.0280898635310273 \tabularnewline
43 & 1.48 & 1.51058986353103 & -0.0305898635310273 \tabularnewline
44 & 1.48 & 1.51808986353103 & -0.0380898635310273 \tabularnewline
45 & 1.48 & 1.52433986353103 & -0.0443398635310273 \tabularnewline
46 & 1.48 & 1.53183986353103 & -0.0518398635310273 \tabularnewline
47 & 1.48 & 1.53308986353103 & -0.0530898635310273 \tabularnewline
48 & 1.48 & 1.53558986353103 & -0.0555898635310273 \tabularnewline
49 & 1.48 & 1.53035018453352 & -0.0503501845335167 \tabularnewline
50 & 1.57 & 1.60191013646897 & -0.0319101364689726 \tabularnewline
51 & 1.58 & 1.60441013646897 & -0.0244101364689726 \tabularnewline
52 & 1.58 & 1.60691013646897 & -0.0269101364689726 \tabularnewline
53 & 1.58 & 1.60941013646897 & -0.0294101364689726 \tabularnewline
54 & 1.58 & 1.60941013646897 & -0.0294101364689726 \tabularnewline
55 & 1.59 & 1.61191013646897 & -0.0219101364689726 \tabularnewline
56 & 1.6 & 1.61941013646897 & -0.0194101364689726 \tabularnewline
57 & 1.6 & 1.62566013646897 & -0.0256601364689726 \tabularnewline
58 & 1.61 & 1.63316013646897 & -0.0231601364689726 \tabularnewline
59 & 1.61 & 1.63441013646897 & -0.0244101364689726 \tabularnewline
60 & 1.61 & 1.63691013646897 & -0.0269101364689726 \tabularnewline
61 & 1.62 & 1.63167045747146 & -0.0116704574714620 \tabularnewline
62 & 1.63 & 1.63859046433783 & -0.00859046433782516 \tabularnewline
63 & 1.63 & 1.64109046433783 & -0.0110904643378252 \tabularnewline
64 & 1.64 & 1.64359046433783 & -0.00359046433782517 \tabularnewline
65 & 1.64 & 1.64609046433783 & -0.00609046433782518 \tabularnewline
66 & 1.64 & 1.64609046433783 & -0.00609046433782518 \tabularnewline
67 & 1.64 & 1.64859046433783 & -0.00859046433782518 \tabularnewline
68 & 1.64 & 1.65609046433783 & -0.0160904643378252 \tabularnewline
69 & 1.65 & 1.66234046433783 & -0.0123404643378252 \tabularnewline
70 & 1.65 & 1.66984046433783 & -0.0198404643378252 \tabularnewline
71 & 1.65 & 1.67109046433783 & -0.0210904643378252 \tabularnewline
72 & 1.65 & 1.67359046433782 & -0.0235904643378252 \tabularnewline
73 & 1.65 & 1.66835078534031 & -0.0183507853403146 \tabularnewline
74 & 1.66 & 1.67527079220668 & -0.0152707922066775 \tabularnewline
75 & 1.66 & 1.67777079220668 & -0.0177707922066776 \tabularnewline
76 & 1.67 & 1.68027079220668 & -0.0102707922066775 \tabularnewline
77 & 1.68 & 1.68277079220668 & -0.00277079220667754 \tabularnewline
78 & 1.68 & 1.68277079220668 & -0.00277079220667753 \tabularnewline
79 & 1.68 & 1.68527079220668 & -0.00527079220667753 \tabularnewline
80 & 1.68 & 1.69277079220668 & -0.0127707922066775 \tabularnewline
81 & 1.69 & 1.69902079220668 & -0.00902079220667754 \tabularnewline
82 & 1.7 & 1.70652079220668 & -0.00652079220667754 \tabularnewline
83 & 1.7 & 1.70777079220668 & -0.00777079220667754 \tabularnewline
84 & 1.71 & 1.71027079220668 & -0.000270792206677525 \tabularnewline
85 & 1.72 & 1.70503111320917 & 0.0149688867908331 \tabularnewline
86 & 1.73 & 1.71195112007553 & 0.0180488799244701 \tabularnewline
87 & 1.74 & 1.71445112007553 & 0.0255488799244701 \tabularnewline
88 & 1.74 & 1.71695112007553 & 0.0230488799244701 \tabularnewline
89 & 1.75 & 1.71945112007553 & 0.0305488799244701 \tabularnewline
90 & 1.75 & 1.71945112007553 & 0.0305488799244701 \tabularnewline
91 & 1.75 & 1.72195112007553 & 0.0280488799244701 \tabularnewline
92 & 1.76 & 1.72945112007553 & 0.0305488799244701 \tabularnewline
93 & 1.79 & 1.73570112007553 & 0.0542988799244702 \tabularnewline
94 & 1.83 & 1.74320112007553 & 0.0867988799244702 \tabularnewline
95 & 1.84 & 1.74445112007553 & 0.0955488799244702 \tabularnewline
96 & 1.85 & 1.74695112007553 & 0.103048879924470 \tabularnewline
\hline
\end{tabular}
%Source: https://freestatistics.org/blog/index.php?pk=25890&T=4

[TABLE]
[ROW][C]Multiple Linear Regression - Actuals, Interpolation, and Residuals[/C][/ROW]
[ROW][C]Time or Index[/C][C]Actuals[/C][C]InterpolationForecast[/C][C]ResidualsPrediction Error[/C][/ROW]
[ROW][C]1[/C][C]1.43[/C][C]1.38362887305810[/C][C]0.0463711269418962[/C][/ROW]
[ROW][C]2[/C][C]1.43[/C][C]1.39054887992447[/C][C]0.0394511200755299[/C][/ROW]
[ROW][C]3[/C][C]1.43[/C][C]1.39304887992447[/C][C]0.0369511200755299[/C][/ROW]
[ROW][C]4[/C][C]1.43[/C][C]1.39554887992447[/C][C]0.0344511200755299[/C][/ROW]
[ROW][C]5[/C][C]1.43[/C][C]1.39804887992447[/C][C]0.0319511200755299[/C][/ROW]
[ROW][C]6[/C][C]1.43[/C][C]1.39804887992447[/C][C]0.0319511200755299[/C][/ROW]
[ROW][C]7[/C][C]1.43[/C][C]1.40054887992447[/C][C]0.0294511200755299[/C][/ROW]
[ROW][C]8[/C][C]1.43[/C][C]1.40804887992447[/C][C]0.0219511200755299[/C][/ROW]
[ROW][C]9[/C][C]1.43[/C][C]1.41429887992447[/C][C]0.0157011200755299[/C][/ROW]
[ROW][C]10[/C][C]1.43[/C][C]1.42179887992447[/C][C]0.00820112007552986[/C][/ROW]
[ROW][C]11[/C][C]1.43[/C][C]1.42304887992447[/C][C]0.00695112007552987[/C][/ROW]
[ROW][C]12[/C][C]1.43[/C][C]1.42554887992447[/C][C]0.00445112007552987[/C][/ROW]
[ROW][C]13[/C][C]1.43[/C][C]1.42030920092696[/C][C]0.00969079907304043[/C][/ROW]
[ROW][C]14[/C][C]1.43[/C][C]1.42722920779332[/C][C]0.0027707922066774[/C][/ROW]
[ROW][C]15[/C][C]1.43[/C][C]1.42972920779332[/C][C]0.000270792206677471[/C][/ROW]
[ROW][C]16[/C][C]1.43[/C][C]1.43222920779332[/C][C]-0.00222920779332253[/C][/ROW]
[ROW][C]17[/C][C]1.43[/C][C]1.43472920779332[/C][C]-0.00472920779332254[/C][/ROW]
[ROW][C]18[/C][C]1.43[/C][C]1.43472920779332[/C][C]-0.00472920779332254[/C][/ROW]
[ROW][C]19[/C][C]1.44[/C][C]1.43722920779332[/C][C]0.00277079220667747[/C][/ROW]
[ROW][C]20[/C][C]1.48[/C][C]1.44472920779332[/C][C]0.0352707922066775[/C][/ROW]
[ROW][C]21[/C][C]1.48[/C][C]1.45097920779332[/C][C]0.0290207922066775[/C][/ROW]
[ROW][C]22[/C][C]1.48[/C][C]1.45847920779332[/C][C]0.0215207922066775[/C][/ROW]
[ROW][C]23[/C][C]1.48[/C][C]1.45972920779332[/C][C]0.0202707922066775[/C][/ROW]
[ROW][C]24[/C][C]1.48[/C][C]1.46222920779332[/C][C]0.0177707922066775[/C][/ROW]
[ROW][C]25[/C][C]1.48[/C][C]1.45698952879581[/C][C]0.0230104712041881[/C][/ROW]
[ROW][C]26[/C][C]1.48[/C][C]1.46390953566217[/C][C]0.0160904643378251[/C][/ROW]
[ROW][C]27[/C][C]1.48[/C][C]1.46640953566217[/C][C]0.0135904643378251[/C][/ROW]
[ROW][C]28[/C][C]1.48[/C][C]1.46890953566217[/C][C]0.0110904643378251[/C][/ROW]
[ROW][C]29[/C][C]1.48[/C][C]1.47140953566217[/C][C]0.0085904643378251[/C][/ROW]
[ROW][C]30[/C][C]1.48[/C][C]1.47140953566217[/C][C]0.0085904643378251[/C][/ROW]
[ROW][C]31[/C][C]1.48[/C][C]1.47390953566217[/C][C]0.0060904643378251[/C][/ROW]
[ROW][C]32[/C][C]1.48[/C][C]1.48140953566217[/C][C]-0.00140953566217490[/C][/ROW]
[ROW][C]33[/C][C]1.48[/C][C]1.48765953566217[/C][C]-0.00765953566217491[/C][/ROW]
[ROW][C]34[/C][C]1.48[/C][C]1.49515953566217[/C][C]-0.0151595356621749[/C][/ROW]
[ROW][C]35[/C][C]1.48[/C][C]1.49640953566217[/C][C]-0.0164095356621749[/C][/ROW]
[ROW][C]36[/C][C]1.48[/C][C]1.49890953566217[/C][C]-0.0189095356621749[/C][/ROW]
[ROW][C]37[/C][C]1.48[/C][C]1.49366985666466[/C][C]-0.0136698566646643[/C][/ROW]
[ROW][C]38[/C][C]1.48[/C][C]1.50058986353103[/C][C]-0.0205898635310273[/C][/ROW]
[ROW][C]39[/C][C]1.48[/C][C]1.50308986353103[/C][C]-0.0230898635310273[/C][/ROW]
[ROW][C]40[/C][C]1.48[/C][C]1.50558986353103[/C][C]-0.0255898635310273[/C][/ROW]
[ROW][C]41[/C][C]1.48[/C][C]1.50808986353103[/C][C]-0.0280898635310273[/C][/ROW]
[ROW][C]42[/C][C]1.48[/C][C]1.50808986353103[/C][C]-0.0280898635310273[/C][/ROW]
[ROW][C]43[/C][C]1.48[/C][C]1.51058986353103[/C][C]-0.0305898635310273[/C][/ROW]
[ROW][C]44[/C][C]1.48[/C][C]1.51808986353103[/C][C]-0.0380898635310273[/C][/ROW]
[ROW][C]45[/C][C]1.48[/C][C]1.52433986353103[/C][C]-0.0443398635310273[/C][/ROW]
[ROW][C]46[/C][C]1.48[/C][C]1.53183986353103[/C][C]-0.0518398635310273[/C][/ROW]
[ROW][C]47[/C][C]1.48[/C][C]1.53308986353103[/C][C]-0.0530898635310273[/C][/ROW]
[ROW][C]48[/C][C]1.48[/C][C]1.53558986353103[/C][C]-0.0555898635310273[/C][/ROW]
[ROW][C]49[/C][C]1.48[/C][C]1.53035018453352[/C][C]-0.0503501845335167[/C][/ROW]
[ROW][C]50[/C][C]1.57[/C][C]1.60191013646897[/C][C]-0.0319101364689726[/C][/ROW]
[ROW][C]51[/C][C]1.58[/C][C]1.60441013646897[/C][C]-0.0244101364689726[/C][/ROW]
[ROW][C]52[/C][C]1.58[/C][C]1.60691013646897[/C][C]-0.0269101364689726[/C][/ROW]
[ROW][C]53[/C][C]1.58[/C][C]1.60941013646897[/C][C]-0.0294101364689726[/C][/ROW]
[ROW][C]54[/C][C]1.58[/C][C]1.60941013646897[/C][C]-0.0294101364689726[/C][/ROW]
[ROW][C]55[/C][C]1.59[/C][C]1.61191013646897[/C][C]-0.0219101364689726[/C][/ROW]
[ROW][C]56[/C][C]1.6[/C][C]1.61941013646897[/C][C]-0.0194101364689726[/C][/ROW]
[ROW][C]57[/C][C]1.6[/C][C]1.62566013646897[/C][C]-0.0256601364689726[/C][/ROW]
[ROW][C]58[/C][C]1.61[/C][C]1.63316013646897[/C][C]-0.0231601364689726[/C][/ROW]
[ROW][C]59[/C][C]1.61[/C][C]1.63441013646897[/C][C]-0.0244101364689726[/C][/ROW]
[ROW][C]60[/C][C]1.61[/C][C]1.63691013646897[/C][C]-0.0269101364689726[/C][/ROW]
[ROW][C]61[/C][C]1.62[/C][C]1.63167045747146[/C][C]-0.0116704574714620[/C][/ROW]
[ROW][C]62[/C][C]1.63[/C][C]1.63859046433783[/C][C]-0.00859046433782516[/C][/ROW]
[ROW][C]63[/C][C]1.63[/C][C]1.64109046433783[/C][C]-0.0110904643378252[/C][/ROW]
[ROW][C]64[/C][C]1.64[/C][C]1.64359046433783[/C][C]-0.00359046433782517[/C][/ROW]
[ROW][C]65[/C][C]1.64[/C][C]1.64609046433783[/C][C]-0.00609046433782518[/C][/ROW]
[ROW][C]66[/C][C]1.64[/C][C]1.64609046433783[/C][C]-0.00609046433782518[/C][/ROW]
[ROW][C]67[/C][C]1.64[/C][C]1.64859046433783[/C][C]-0.00859046433782518[/C][/ROW]
[ROW][C]68[/C][C]1.64[/C][C]1.65609046433783[/C][C]-0.0160904643378252[/C][/ROW]
[ROW][C]69[/C][C]1.65[/C][C]1.66234046433783[/C][C]-0.0123404643378252[/C][/ROW]
[ROW][C]70[/C][C]1.65[/C][C]1.66984046433783[/C][C]-0.0198404643378252[/C][/ROW]
[ROW][C]71[/C][C]1.65[/C][C]1.67109046433783[/C][C]-0.0210904643378252[/C][/ROW]
[ROW][C]72[/C][C]1.65[/C][C]1.67359046433782[/C][C]-0.0235904643378252[/C][/ROW]
[ROW][C]73[/C][C]1.65[/C][C]1.66835078534031[/C][C]-0.0183507853403146[/C][/ROW]
[ROW][C]74[/C][C]1.66[/C][C]1.67527079220668[/C][C]-0.0152707922066775[/C][/ROW]
[ROW][C]75[/C][C]1.66[/C][C]1.67777079220668[/C][C]-0.0177707922066776[/C][/ROW]
[ROW][C]76[/C][C]1.67[/C][C]1.68027079220668[/C][C]-0.0102707922066775[/C][/ROW]
[ROW][C]77[/C][C]1.68[/C][C]1.68277079220668[/C][C]-0.00277079220667754[/C][/ROW]
[ROW][C]78[/C][C]1.68[/C][C]1.68277079220668[/C][C]-0.00277079220667753[/C][/ROW]
[ROW][C]79[/C][C]1.68[/C][C]1.68527079220668[/C][C]-0.00527079220667753[/C][/ROW]
[ROW][C]80[/C][C]1.68[/C][C]1.69277079220668[/C][C]-0.0127707922066775[/C][/ROW]
[ROW][C]81[/C][C]1.69[/C][C]1.69902079220668[/C][C]-0.00902079220667754[/C][/ROW]
[ROW][C]82[/C][C]1.7[/C][C]1.70652079220668[/C][C]-0.00652079220667754[/C][/ROW]
[ROW][C]83[/C][C]1.7[/C][C]1.70777079220668[/C][C]-0.00777079220667754[/C][/ROW]
[ROW][C]84[/C][C]1.71[/C][C]1.71027079220668[/C][C]-0.000270792206677525[/C][/ROW]
[ROW][C]85[/C][C]1.72[/C][C]1.70503111320917[/C][C]0.0149688867908331[/C][/ROW]
[ROW][C]86[/C][C]1.73[/C][C]1.71195112007553[/C][C]0.0180488799244701[/C][/ROW]
[ROW][C]87[/C][C]1.74[/C][C]1.71445112007553[/C][C]0.0255488799244701[/C][/ROW]
[ROW][C]88[/C][C]1.74[/C][C]1.71695112007553[/C][C]0.0230488799244701[/C][/ROW]
[ROW][C]89[/C][C]1.75[/C][C]1.71945112007553[/C][C]0.0305488799244701[/C][/ROW]
[ROW][C]90[/C][C]1.75[/C][C]1.71945112007553[/C][C]0.0305488799244701[/C][/ROW]
[ROW][C]91[/C][C]1.75[/C][C]1.72195112007553[/C][C]0.0280488799244701[/C][/ROW]
[ROW][C]92[/C][C]1.76[/C][C]1.72945112007553[/C][C]0.0305488799244701[/C][/ROW]
[ROW][C]93[/C][C]1.79[/C][C]1.73570112007553[/C][C]0.0542988799244702[/C][/ROW]
[ROW][C]94[/C][C]1.83[/C][C]1.74320112007553[/C][C]0.0867988799244702[/C][/ROW]
[ROW][C]95[/C][C]1.84[/C][C]1.74445112007553[/C][C]0.0955488799244702[/C][/ROW]
[ROW][C]96[/C][C]1.85[/C][C]1.74695112007553[/C][C]0.103048879924470[/C][/ROW]
[/TABLE]
Source: https://freestatistics.org/blog/index.php?pk=25890&T=4

Globally Unique Identifier (entire table): ba.freestatistics.org/blog/index.php?pk=25890&T=4

As an alternative you can also use a QR Code:  

The GUIDs for individual cells are displayed in the table below:

Multiple Linear Regression - Actuals, Interpolation, and Residuals
Time or IndexActualsInterpolationForecastResidualsPrediction Error
11.431.383628873058100.0463711269418962
21.431.390548879924470.0394511200755299
31.431.393048879924470.0369511200755299
41.431.395548879924470.0344511200755299
51.431.398048879924470.0319511200755299
61.431.398048879924470.0319511200755299
71.431.400548879924470.0294511200755299
81.431.408048879924470.0219511200755299
91.431.414298879924470.0157011200755299
101.431.421798879924470.00820112007552986
111.431.423048879924470.00695112007552987
121.431.425548879924470.00445112007552987
131.431.420309200926960.00969079907304043
141.431.427229207793320.0027707922066774
151.431.429729207793320.000270792206677471
161.431.43222920779332-0.00222920779332253
171.431.43472920779332-0.00472920779332254
181.431.43472920779332-0.00472920779332254
191.441.437229207793320.00277079220667747
201.481.444729207793320.0352707922066775
211.481.450979207793320.0290207922066775
221.481.458479207793320.0215207922066775
231.481.459729207793320.0202707922066775
241.481.462229207793320.0177707922066775
251.481.456989528795810.0230104712041881
261.481.463909535662170.0160904643378251
271.481.466409535662170.0135904643378251
281.481.468909535662170.0110904643378251
291.481.471409535662170.0085904643378251
301.481.471409535662170.0085904643378251
311.481.473909535662170.0060904643378251
321.481.48140953566217-0.00140953566217490
331.481.48765953566217-0.00765953566217491
341.481.49515953566217-0.0151595356621749
351.481.49640953566217-0.0164095356621749
361.481.49890953566217-0.0189095356621749
371.481.49366985666466-0.0136698566646643
381.481.50058986353103-0.0205898635310273
391.481.50308986353103-0.0230898635310273
401.481.50558986353103-0.0255898635310273
411.481.50808986353103-0.0280898635310273
421.481.50808986353103-0.0280898635310273
431.481.51058986353103-0.0305898635310273
441.481.51808986353103-0.0380898635310273
451.481.52433986353103-0.0443398635310273
461.481.53183986353103-0.0518398635310273
471.481.53308986353103-0.0530898635310273
481.481.53558986353103-0.0555898635310273
491.481.53035018453352-0.0503501845335167
501.571.60191013646897-0.0319101364689726
511.581.60441013646897-0.0244101364689726
521.581.60691013646897-0.0269101364689726
531.581.60941013646897-0.0294101364689726
541.581.60941013646897-0.0294101364689726
551.591.61191013646897-0.0219101364689726
561.61.61941013646897-0.0194101364689726
571.61.62566013646897-0.0256601364689726
581.611.63316013646897-0.0231601364689726
591.611.63441013646897-0.0244101364689726
601.611.63691013646897-0.0269101364689726
611.621.63167045747146-0.0116704574714620
621.631.63859046433783-0.00859046433782516
631.631.64109046433783-0.0110904643378252
641.641.64359046433783-0.00359046433782517
651.641.64609046433783-0.00609046433782518
661.641.64609046433783-0.00609046433782518
671.641.64859046433783-0.00859046433782518
681.641.65609046433783-0.0160904643378252
691.651.66234046433783-0.0123404643378252
701.651.66984046433783-0.0198404643378252
711.651.67109046433783-0.0210904643378252
721.651.67359046433782-0.0235904643378252
731.651.66835078534031-0.0183507853403146
741.661.67527079220668-0.0152707922066775
751.661.67777079220668-0.0177707922066776
761.671.68027079220668-0.0102707922066775
771.681.68277079220668-0.00277079220667754
781.681.68277079220668-0.00277079220667753
791.681.68527079220668-0.00527079220667753
801.681.69277079220668-0.0127707922066775
811.691.69902079220668-0.00902079220667754
821.71.70652079220668-0.00652079220667754
831.71.70777079220668-0.00777079220667754
841.711.71027079220668-0.000270792206677525
851.721.705031113209170.0149688867908331
861.731.711951120075530.0180488799244701
871.741.714451120075530.0255488799244701
881.741.716951120075530.0230488799244701
891.751.719451120075530.0305488799244701
901.751.719451120075530.0305488799244701
911.751.721951120075530.0280488799244701
921.761.729451120075530.0305488799244701
931.791.735701120075530.0542988799244702
941.831.743201120075530.0867988799244702
951.841.744451120075530.0955488799244702
961.851.746951120075530.103048879924470


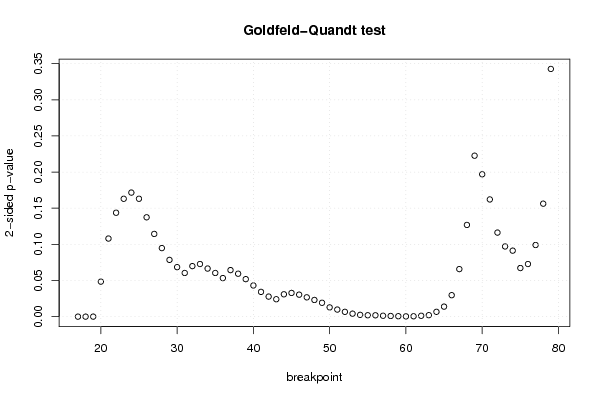
Goldfeld-Quandt test for Heteroskedasticity
p-valuesAlternative Hypothesis
breakpoint indexgreater2-sidedless
174.9252689411005e-439.850537882201e-431
181.31474232953445e-562.62948465906889e-561
192.42211935908881e-054.84423871817762e-050.99997577880641
200.02422993112724460.04845986225448910.975770068872755
210.05403111089058850.1080622217811770.945968889109411
220.07188277367396730.1437655473479350.928117226326033
230.0815451952697980.1630903905395960.918454804730202
240.0858387601200670.1716775202401340.914161239879933
250.08155842716817640.1631168543363530.918441572831824
260.06873316101008070.1374663220201610.93126683898992
270.05723580908307360.1144716181661470.942764190916926
280.04743619189624360.09487238379248720.952563808103756
290.03926722210824210.07853444421648410.960732777891758
300.03424422958409360.06848845916818710.965755770415906
310.03021533714444150.0604306742888830.969784662855558
320.03496208951910920.06992417903821840.96503791048089
330.03642053088262740.07284106176525480.963579469117373
340.03327432199376040.06654864398752080.96672567800624
350.03021834343933190.06043668687866390.969781656560668
360.02668417194526900.05336834389053790.973315828054731
370.03220574439122270.06441148878244530.967794255608777
380.02969643226927690.05939286453855390.970303567730723
390.02595176371856410.05190352743712820.974048236281436
400.02158527554231230.04317055108462470.978414724457688
410.01712051706952960.03424103413905910.98287948293047
420.01387000694985470.02774001389970950.986129993050145
430.01206094573451560.02412189146903110.987939054265484
440.01547769152991790.03095538305983580.984522308470082
450.01640419792350020.03280839584700040.9835958020765
460.01520649961252650.03041299922505300.984793500387473
470.01337273852209220.02674547704418440.986627261477908
480.01154575761886150.02309151523772310.988454242381138
490.009587536924923730.01917507384984750.990412463075076
500.006404849314565880.01280969862913180.993595150685434
510.004904641494354180.009809282988708350.995095358505646
520.003329191875020150.00665838375004030.99667080812498
530.002060839121453670.004121678242907340.997939160878546
540.00125395235208770.00250790470417540.998746047647912
550.0009688968763177060.001937793752635410.999031103123682
560.0009392664182229570.001878532836445910.999060733581777
570.0006264166137629380.001252833227525880.999373583386237
580.0004578530407767330.0009157060815534660.999542146959223
590.0003063202295069530.0006126404590139050.999693679770493
600.0001854238685459890.0003708477370919770.999814576131454
610.0002664784514468420.0005329569028936830.999733521548553
620.0006062150297470080.001212430059494020.999393784970253
630.001021700890717960.002043401781435920.998978299109282
640.003343227889061040.006686455778122090.996656772110939
650.006933520059940110.01386704011988020.99306647994006
660.01485120903096840.02970241806193690.985148790969032
670.03289870773712090.06579741547424190.96710129226288
680.06343834555373360.1268766911074670.936561654446266
690.1113535773497040.2227071546994090.888646422650295
700.09850264424093810.1970052884818760.901497355759062
710.08108857645681490.1621771529136300.918911423543185
720.05815498588127320.1163099717625460.941845014118727
730.04855814091896090.09711628183792180.95144185908104
740.04566156956256210.09132313912512420.954338430437438
750.03363459048128640.06726918096257280.966365409518714
760.03641819244762820.07283638489525650.963581807552372
770.04956327192898970.09912654385797940.95043672807101
780.07815352146252730.1563070429250550.921846478537473
790.1713671736530720.3427343473061440.828632826346928

\begin{tabular}{lllllllll}
\hline
Goldfeld-Quandt test for Heteroskedasticity \tabularnewline
p-values & Alternative Hypothesis \tabularnewline
breakpoint index & greater & 2-sided & less \tabularnewline
17 & 4.9252689411005e-43 & 9.850537882201e-43 & 1 \tabularnewline
18 & 1.31474232953445e-56 & 2.62948465906889e-56 & 1 \tabularnewline
19 & 2.42211935908881e-05 & 4.84423871817762e-05 & 0.99997577880641 \tabularnewline
20 & 0.0242299311272446 & 0.0484598622544891 & 0.975770068872755 \tabularnewline
21 & 0.0540311108905885 & 0.108062221781177 & 0.945968889109411 \tabularnewline
22 & 0.0718827736739673 & 0.143765547347935 & 0.928117226326033 \tabularnewline
23 & 0.081545195269798 & 0.163090390539596 & 0.918454804730202 \tabularnewline
24 & 0.085838760120067 & 0.171677520240134 & 0.914161239879933 \tabularnewline
25 & 0.0815584271681764 & 0.163116854336353 & 0.918441572831824 \tabularnewline
26 & 0.0687331610100807 & 0.137466322020161 & 0.93126683898992 \tabularnewline
27 & 0.0572358090830736 & 0.114471618166147 & 0.942764190916926 \tabularnewline
28 & 0.0474361918962436 & 0.0948723837924872 & 0.952563808103756 \tabularnewline
29 & 0.0392672221082421 & 0.0785344442164841 & 0.960732777891758 \tabularnewline
30 & 0.0342442295840936 & 0.0684884591681871 & 0.965755770415906 \tabularnewline
31 & 0.0302153371444415 & 0.060430674288883 & 0.969784662855558 \tabularnewline
32 & 0.0349620895191092 & 0.0699241790382184 & 0.96503791048089 \tabularnewline
33 & 0.0364205308826274 & 0.0728410617652548 & 0.963579469117373 \tabularnewline
34 & 0.0332743219937604 & 0.0665486439875208 & 0.96672567800624 \tabularnewline
35 & 0.0302183434393319 & 0.0604366868786639 & 0.969781656560668 \tabularnewline
36 & 0.0266841719452690 & 0.0533683438905379 & 0.973315828054731 \tabularnewline
37 & 0.0322057443912227 & 0.0644114887824453 & 0.967794255608777 \tabularnewline
38 & 0.0296964322692769 & 0.0593928645385539 & 0.970303567730723 \tabularnewline
39 & 0.0259517637185641 & 0.0519035274371282 & 0.974048236281436 \tabularnewline
40 & 0.0215852755423123 & 0.0431705510846247 & 0.978414724457688 \tabularnewline
41 & 0.0171205170695296 & 0.0342410341390591 & 0.98287948293047 \tabularnewline
42 & 0.0138700069498547 & 0.0277400138997095 & 0.986129993050145 \tabularnewline
43 & 0.0120609457345156 & 0.0241218914690311 & 0.987939054265484 \tabularnewline
44 & 0.0154776915299179 & 0.0309553830598358 & 0.984522308470082 \tabularnewline
45 & 0.0164041979235002 & 0.0328083958470004 & 0.9835958020765 \tabularnewline
46 & 0.0152064996125265 & 0.0304129992250530 & 0.984793500387473 \tabularnewline
47 & 0.0133727385220922 & 0.0267454770441844 & 0.986627261477908 \tabularnewline
48 & 0.0115457576188615 & 0.0230915152377231 & 0.988454242381138 \tabularnewline
49 & 0.00958753692492373 & 0.0191750738498475 & 0.990412463075076 \tabularnewline
50 & 0.00640484931456588 & 0.0128096986291318 & 0.993595150685434 \tabularnewline
51 & 0.00490464149435418 & 0.00980928298870835 & 0.995095358505646 \tabularnewline
52 & 0.00332919187502015 & 0.0066583837500403 & 0.99667080812498 \tabularnewline
53 & 0.00206083912145367 & 0.00412167824290734 & 0.997939160878546 \tabularnewline
54 & 0.0012539523520877 & 0.0025079047041754 & 0.998746047647912 \tabularnewline
55 & 0.000968896876317706 & 0.00193779375263541 & 0.999031103123682 \tabularnewline
56 & 0.000939266418222957 & 0.00187853283644591 & 0.999060733581777 \tabularnewline
57 & 0.000626416613762938 & 0.00125283322752588 & 0.999373583386237 \tabularnewline
58 & 0.000457853040776733 & 0.000915706081553466 & 0.999542146959223 \tabularnewline
59 & 0.000306320229506953 & 0.000612640459013905 & 0.999693679770493 \tabularnewline
60 & 0.000185423868545989 & 0.000370847737091977 & 0.999814576131454 \tabularnewline
61 & 0.000266478451446842 & 0.000532956902893683 & 0.999733521548553 \tabularnewline
62 & 0.000606215029747008 & 0.00121243005949402 & 0.999393784970253 \tabularnewline
63 & 0.00102170089071796 & 0.00204340178143592 & 0.998978299109282 \tabularnewline
64 & 0.00334322788906104 & 0.00668645577812209 & 0.996656772110939 \tabularnewline
65 & 0.00693352005994011 & 0.0138670401198802 & 0.99306647994006 \tabularnewline
66 & 0.0148512090309684 & 0.0297024180619369 & 0.985148790969032 \tabularnewline
67 & 0.0328987077371209 & 0.0657974154742419 & 0.96710129226288 \tabularnewline
68 & 0.0634383455537336 & 0.126876691107467 & 0.936561654446266 \tabularnewline
69 & 0.111353577349704 & 0.222707154699409 & 0.888646422650295 \tabularnewline
70 & 0.0985026442409381 & 0.197005288481876 & 0.901497355759062 \tabularnewline
71 & 0.0810885764568149 & 0.162177152913630 & 0.918911423543185 \tabularnewline
72 & 0.0581549858812732 & 0.116309971762546 & 0.941845014118727 \tabularnewline
73 & 0.0485581409189609 & 0.0971162818379218 & 0.95144185908104 \tabularnewline
74 & 0.0456615695625621 & 0.0913231391251242 & 0.954338430437438 \tabularnewline
75 & 0.0336345904812864 & 0.0672691809625728 & 0.966365409518714 \tabularnewline
76 & 0.0364181924476282 & 0.0728363848952565 & 0.963581807552372 \tabularnewline
77 & 0.0495632719289897 & 0.0991265438579794 & 0.95043672807101 \tabularnewline
78 & 0.0781535214625273 & 0.156307042925055 & 0.921846478537473 \tabularnewline
79 & 0.171367173653072 & 0.342734347306144 & 0.828632826346928 \tabularnewline
\hline
\end{tabular}
%Source: https://freestatistics.org/blog/index.php?pk=25890&T=5

[TABLE]
[ROW][C]Goldfeld-Quandt test for Heteroskedasticity[/C][/ROW]
[ROW][C]p-values[/C][C]Alternative Hypothesis[/C][/ROW]
[ROW][C]breakpoint index[/C][C]greater[/C][C]2-sided[/C][C]less[/C][/ROW]
[ROW][C]17[/C][C]4.9252689411005e-43[/C][C]9.850537882201e-43[/C][C]1[/C][/ROW]
[ROW][C]18[/C][C]1.31474232953445e-56[/C][C]2.62948465906889e-56[/C][C]1[/C][/ROW]
[ROW][C]19[/C][C]2.42211935908881e-05[/C][C]4.84423871817762e-05[/C][C]0.99997577880641[/C][/ROW]
[ROW][C]20[/C][C]0.0242299311272446[/C][C]0.0484598622544891[/C][C]0.975770068872755[/C][/ROW]
[ROW][C]21[/C][C]0.0540311108905885[/C][C]0.108062221781177[/C][C]0.945968889109411[/C][/ROW]
[ROW][C]22[/C][C]0.0718827736739673[/C][C]0.143765547347935[/C][C]0.928117226326033[/C][/ROW]
[ROW][C]23[/C][C]0.081545195269798[/C][C]0.163090390539596[/C][C]0.918454804730202[/C][/ROW]
[ROW][C]24[/C][C]0.085838760120067[/C][C]0.171677520240134[/C][C]0.914161239879933[/C][/ROW]
[ROW][C]25[/C][C]0.0815584271681764[/C][C]0.163116854336353[/C][C]0.918441572831824[/C][/ROW]
[ROW][C]26[/C][C]0.0687331610100807[/C][C]0.137466322020161[/C][C]0.93126683898992[/C][/ROW]
[ROW][C]27[/C][C]0.0572358090830736[/C][C]0.114471618166147[/C][C]0.942764190916926[/C][/ROW]
[ROW][C]28[/C][C]0.0474361918962436[/C][C]0.0948723837924872[/C][C]0.952563808103756[/C][/ROW]
[ROW][C]29[/C][C]0.0392672221082421[/C][C]0.0785344442164841[/C][C]0.960732777891758[/C][/ROW]
[ROW][C]30[/C][C]0.0342442295840936[/C][C]0.0684884591681871[/C][C]0.965755770415906[/C][/ROW]
[ROW][C]31[/C][C]0.0302153371444415[/C][C]0.060430674288883[/C][C]0.969784662855558[/C][/ROW]
[ROW][C]32[/C][C]0.0349620895191092[/C][C]0.0699241790382184[/C][C]0.96503791048089[/C][/ROW]
[ROW][C]33[/C][C]0.0364205308826274[/C][C]0.0728410617652548[/C][C]0.963579469117373[/C][/ROW]
[ROW][C]34[/C][C]0.0332743219937604[/C][C]0.0665486439875208[/C][C]0.96672567800624[/C][/ROW]
[ROW][C]35[/C][C]0.0302183434393319[/C][C]0.0604366868786639[/C][C]0.969781656560668[/C][/ROW]
[ROW][C]36[/C][C]0.0266841719452690[/C][C]0.0533683438905379[/C][C]0.973315828054731[/C][/ROW]
[ROW][C]37[/C][C]0.0322057443912227[/C][C]0.0644114887824453[/C][C]0.967794255608777[/C][/ROW]
[ROW][C]38[/C][C]0.0296964322692769[/C][C]0.0593928645385539[/C][C]0.970303567730723[/C][/ROW]
[ROW][C]39[/C][C]0.0259517637185641[/C][C]0.0519035274371282[/C][C]0.974048236281436[/C][/ROW]
[ROW][C]40[/C][C]0.0215852755423123[/C][C]0.0431705510846247[/C][C]0.978414724457688[/C][/ROW]
[ROW][C]41[/C][C]0.0171205170695296[/C][C]0.0342410341390591[/C][C]0.98287948293047[/C][/ROW]
[ROW][C]42[/C][C]0.0138700069498547[/C][C]0.0277400138997095[/C][C]0.986129993050145[/C][/ROW]
[ROW][C]43[/C][C]0.0120609457345156[/C][C]0.0241218914690311[/C][C]0.987939054265484[/C][/ROW]
[ROW][C]44[/C][C]0.0154776915299179[/C][C]0.0309553830598358[/C][C]0.984522308470082[/C][/ROW]
[ROW][C]45[/C][C]0.0164041979235002[/C][C]0.0328083958470004[/C][C]0.9835958020765[/C][/ROW]
[ROW][C]46[/C][C]0.0152064996125265[/C][C]0.0304129992250530[/C][C]0.984793500387473[/C][/ROW]
[ROW][C]47[/C][C]0.0133727385220922[/C][C]0.0267454770441844[/C][C]0.986627261477908[/C][/ROW]
[ROW][C]48[/C][C]0.0115457576188615[/C][C]0.0230915152377231[/C][C]0.988454242381138[/C][/ROW]
[ROW][C]49[/C][C]0.00958753692492373[/C][C]0.0191750738498475[/C][C]0.990412463075076[/C][/ROW]
[ROW][C]50[/C][C]0.00640484931456588[/C][C]0.0128096986291318[/C][C]0.993595150685434[/C][/ROW]
[ROW][C]51[/C][C]0.00490464149435418[/C][C]0.00980928298870835[/C][C]0.995095358505646[/C][/ROW]
[ROW][C]52[/C][C]0.00332919187502015[/C][C]0.0066583837500403[/C][C]0.99667080812498[/C][/ROW]
[ROW][C]53[/C][C]0.00206083912145367[/C][C]0.00412167824290734[/C][C]0.997939160878546[/C][/ROW]
[ROW][C]54[/C][C]0.0012539523520877[/C][C]0.0025079047041754[/C][C]0.998746047647912[/C][/ROW]
[ROW][C]55[/C][C]0.000968896876317706[/C][C]0.00193779375263541[/C][C]0.999031103123682[/C][/ROW]
[ROW][C]56[/C][C]0.000939266418222957[/C][C]0.00187853283644591[/C][C]0.999060733581777[/C][/ROW]
[ROW][C]57[/C][C]0.000626416613762938[/C][C]0.00125283322752588[/C][C]0.999373583386237[/C][/ROW]
[ROW][C]58[/C][C]0.000457853040776733[/C][C]0.000915706081553466[/C][C]0.999542146959223[/C][/ROW]
[ROW][C]59[/C][C]0.000306320229506953[/C][C]0.000612640459013905[/C][C]0.999693679770493[/C][/ROW]
[ROW][C]60[/C][C]0.000185423868545989[/C][C]0.000370847737091977[/C][C]0.999814576131454[/C][/ROW]
[ROW][C]61[/C][C]0.000266478451446842[/C][C]0.000532956902893683[/C][C]0.999733521548553[/C][/ROW]
[ROW][C]62[/C][C]0.000606215029747008[/C][C]0.00121243005949402[/C][C]0.999393784970253[/C][/ROW]
[ROW][C]63[/C][C]0.00102170089071796[/C][C]0.00204340178143592[/C][C]0.998978299109282[/C][/ROW]
[ROW][C]64[/C][C]0.00334322788906104[/C][C]0.00668645577812209[/C][C]0.996656772110939[/C][/ROW]
[ROW][C]65[/C][C]0.00693352005994011[/C][C]0.0138670401198802[/C][C]0.99306647994006[/C][/ROW]
[ROW][C]66[/C][C]0.0148512090309684[/C][C]0.0297024180619369[/C][C]0.985148790969032[/C][/ROW]
[ROW][C]67[/C][C]0.0328987077371209[/C][C]0.0657974154742419[/C][C]0.96710129226288[/C][/ROW]
[ROW][C]68[/C][C]0.0634383455537336[/C][C]0.126876691107467[/C][C]0.936561654446266[/C][/ROW]
[ROW][C]69[/C][C]0.111353577349704[/C][C]0.222707154699409[/C][C]0.888646422650295[/C][/ROW]
[ROW][C]70[/C][C]0.0985026442409381[/C][C]0.197005288481876[/C][C]0.901497355759062[/C][/ROW]
[ROW][C]71[/C][C]0.0810885764568149[/C][C]0.162177152913630[/C][C]0.918911423543185[/C][/ROW]
[ROW][C]72[/C][C]0.0581549858812732[/C][C]0.116309971762546[/C][C]0.941845014118727[/C][/ROW]
[ROW][C]73[/C][C]0.0485581409189609[/C][C]0.0971162818379218[/C][C]0.95144185908104[/C][/ROW]
[ROW][C]74[/C][C]0.0456615695625621[/C][C]0.0913231391251242[/C][C]0.954338430437438[/C][/ROW]
[ROW][C]75[/C][C]0.0336345904812864[/C][C]0.0672691809625728[/C][C]0.966365409518714[/C][/ROW]
[ROW][C]76[/C][C]0.0364181924476282[/C][C]0.0728363848952565[/C][C]0.963581807552372[/C][/ROW]
[ROW][C]77[/C][C]0.0495632719289897[/C][C]0.0991265438579794[/C][C]0.95043672807101[/C][/ROW]
[ROW][C]78[/C][C]0.0781535214625273[/C][C]0.156307042925055[/C][C]0.921846478537473[/C][/ROW]
[ROW][C]79[/C][C]0.171367173653072[/C][C]0.342734347306144[/C][C]0.828632826346928[/C][/ROW]
[/TABLE]
Source: https://freestatistics.org/blog/index.php?pk=25890&T=5

Globally Unique Identifier (entire table): ba.freestatistics.org/blog/index.php?pk=25890&T=5

As an alternative you can also use a QR Code:  

The GUIDs for individual cells are displayed in the table below:

Goldfeld-Quandt test for Heteroskedasticity
p-valuesAlternative Hypothesis
breakpoint indexgreater2-sidedless
174.9252689411005e-439.850537882201e-431
181.31474232953445e-562.62948465906889e-561
192.42211935908881e-054.84423871817762e-050.99997577880641
200.02422993112724460.04845986225448910.975770068872755
210.05403111089058850.1080622217811770.945968889109411
220.07188277367396730.1437655473479350.928117226326033
230.0815451952697980.1630903905395960.918454804730202
240.0858387601200670.1716775202401340.914161239879933
250.08155842716817640.1631168543363530.918441572831824
260.06873316101008070.1374663220201610.93126683898992
270.05723580908307360.1144716181661470.942764190916926
280.04743619189624360.09487238379248720.952563808103756
290.03926722210824210.07853444421648410.960732777891758
300.03424422958409360.06848845916818710.965755770415906
310.03021533714444150.0604306742888830.969784662855558
320.03496208951910920.06992417903821840.96503791048089
330.03642053088262740.07284106176525480.963579469117373
340.03327432199376040.06654864398752080.96672567800624
350.03021834343933190.06043668687866390.969781656560668
360.02668417194526900.05336834389053790.973315828054731
370.03220574439122270.06441148878244530.967794255608777
380.02969643226927690.05939286453855390.970303567730723
390.02595176371856410.05190352743712820.974048236281436
400.02158527554231230.04317055108462470.978414724457688
410.01712051706952960.03424103413905910.98287948293047
420.01387000694985470.02774001389970950.986129993050145
430.01206094573451560.02412189146903110.987939054265484
440.01547769152991790.03095538305983580.984522308470082
450.01640419792350020.03280839584700040.9835958020765
460.01520649961252650.03041299922505300.984793500387473
470.01337273852209220.02674547704418440.986627261477908
480.01154575761886150.02309151523772310.988454242381138
490.009587536924923730.01917507384984750.990412463075076
500.006404849314565880.01280969862913180.993595150685434
510.004904641494354180.009809282988708350.995095358505646
520.003329191875020150.00665838375004030.99667080812498
530.002060839121453670.004121678242907340.997939160878546
540.00125395235208770.00250790470417540.998746047647912
550.0009688968763177060.001937793752635410.999031103123682
560.0009392664182229570.001878532836445910.999060733581777
570.0006264166137629380.001252833227525880.999373583386237
580.0004578530407767330.0009157060815534660.999542146959223
590.0003063202295069530.0006126404590139050.999693679770493
600.0001854238685459890.0003708477370919770.999814576131454
610.0002664784514468420.0005329569028936830.999733521548553
620.0006062150297470080.001212430059494020.999393784970253
630.001021700890717960.002043401781435920.998978299109282
640.003343227889061040.006686455778122090.996656772110939
650.006933520059940110.01386704011988020.99306647994006
660.01485120903096840.02970241806193690.985148790969032
670.03289870773712090.06579741547424190.96710129226288
680.06343834555373360.1268766911074670.936561654446266
690.1113535773497040.2227071546994090.888646422650295
700.09850264424093810.1970052884818760.901497355759062
710.08108857645681490.1621771529136300.918911423543185
720.05815498588127320.1163099717625460.941845014118727
730.04855814091896090.09711628183792180.95144185908104
740.04566156956256210.09132313912512420.954338430437438
750.03363459048128640.06726918096257280.966365409518714
760.03641819244762820.07283638489525650.963581807552372
770.04956327192898970.09912654385797940.95043672807101
780.07815352146252730.1563070429250550.921846478537473
790.1713671736530720.3427343473061440.828632826346928


Meta Analysis of Goldfeld-Quandt test for Heteroskedasticity
Description# significant tests% significant testsOK/NOK
1% type I error level170.26984126984127NOK
5% type I error level310.492063492063492NOK
10% type I error level490.777777777777778NOK

\begin{tabular}{lllllllll}
\hline
Meta Analysis of Goldfeld-Quandt test for Heteroskedasticity \tabularnewline
Description & # significant tests & % significant tests & OK/NOK \tabularnewline
1% type I error level & 17 & 0.26984126984127 & NOK \tabularnewline
5% type I error level & 31 & 0.492063492063492 & NOK \tabularnewline
10% type I error level & 49 & 0.777777777777778 & NOK \tabularnewline
\hline
\end{tabular}
%Source: https://freestatistics.org/blog/index.php?pk=25890&T=6

[TABLE]
[ROW][C]Meta Analysis of Goldfeld-Quandt test for Heteroskedasticity[/C][/ROW]
[ROW][C]Description[/C][C]# significant tests[/C][C]% significant tests[/C][C]OK/NOK[/C][/ROW]
[ROW][C]1% type I error level[/C][C]17[/C][C]0.26984126984127[/C][C]NOK[/C][/ROW]
[ROW][C]5% type I error level[/C][C]31[/C][C]0.492063492063492[/C][C]NOK[/C][/ROW]
[ROW][C]10% type I error level[/C][C]49[/C][C]0.777777777777778[/C][C]NOK[/C][/ROW]
[/TABLE]
Source: https://freestatistics.org/blog/index.php?pk=25890&T=6

Globally Unique Identifier (entire table): ba.freestatistics.org/blog/index.php?pk=25890&T=6

As an alternative you can also use a QR Code:  

The GUIDs for individual cells are displayed in the table below:

Meta Analysis of Goldfeld-Quandt test for Heteroskedasticity
Description# significant tests% significant testsOK/NOK
1% type I error level170.26984126984127NOK
5% type I error level310.492063492063492NOK
10% type I error level490.777777777777778NOK


Parameters (Session):
par1 = 1 ; par2 = Include Monthly Dummies ; par3 = Linear Trend ;
Parameters (R input):
par1 = 1 ; par2 = Include Monthly Dummies ; par3 = Linear Trend ;
R code (references can be found in the software module):
library(lattice)
library(lmtest)
n25 <- 25 #minimum number of obs. for Goldfeld-Quandt test
par1 <- as.numeric(par1)
x <- t(y)
k <- length(x[1,])
n <- length(x[,1])
x1 <- cbind(x[,par1], x[,1:k!=par1])
mycolnames <- c(colnames(x)[par1], colnames(x)[1:k!=par1])
colnames(x1) <- mycolnames #colnames(x)[par1]
x <- x1
if (par3 == 'First Differences'){
x2 <- array(0, dim=c(n-1,k), dimnames=list(1:(n-1), paste('(1-B)',colnames(x),sep='')))
for (i in 1:n-1) {
for (j in 1:k) {
x2[i,j] <- x[i+1,j] - x[i,j]
}
}
x <- x2
}
if (par2 == 'Include Monthly Dummies'){
x2 <- array(0, dim=c(n,11), dimnames=list(1:n, paste('M', seq(1:11), sep ='')))
for (i in 1:11){
x2[seq(i,n,12),i] <- 1
}
x <- cbind(x, x2)
}
if (par2 == 'Include Quarterly Dummies'){
x2 <- array(0, dim=c(n,3), dimnames=list(1:n, paste('Q', seq(1:3), sep ='')))
for (i in 1:3){
x2[seq(i,n,4),i] <- 1
}
x <- cbind(x, x2)
}
k <- length(x[1,])
if (par3 == 'Linear Trend'){
x <- cbind(x, c(1:n))
colnames(x)[k+1] <- 't'
}
x
k <- length(x[1,])
df <- as.data.frame(x)
(mylm <- lm(df))
(mysum <- summary(mylm))
if (n > n25) {
kp3 <- k + 3
nmkm3 <- n - k - 3
gqarr <- array(NA, dim=c(nmkm3-kp3+1,3))
numgqtests <- 0
numsignificant1 <- 0
numsignificant5 <- 0
numsignificant10 <- 0
for (mypoint in kp3:nmkm3) {
j <- 0
numgqtests <- numgqtests + 1
for (myalt in c('greater', 'two.sided', 'less')) {
j <- j + 1
gqarr[mypoint-kp3+1,j] <- gqtest(mylm, point=mypoint, alternative=myalt)$p.value
}
if (gqarr[mypoint-kp3+1,2] < 0.01) numsignificant1 <- numsignificant1 + 1
if (gqarr[mypoint-kp3+1,2] < 0.05) numsignificant5 <- numsignificant5 + 1
if (gqarr[mypoint-kp3+1,2] < 0.10) numsignificant10 <- numsignificant10 + 1
}
gqarr
}
bitmap(file='test0.png')
plot(x[,1], type='l', main='Actuals and Interpolation', ylab='value of Actuals and Interpolation (dots)', xlab='time or index')
points(x[,1]-mysum$resid)
grid()
dev.off()
bitmap(file='test1.png')
plot(mysum$resid, type='b', pch=19, main='Residuals', ylab='value of Residuals', xlab='time or index')
grid()
dev.off()
bitmap(file='test2.png')
hist(mysum$resid, main='Residual Histogram', xlab='values of Residuals')
grid()
dev.off()
bitmap(file='test3.png')
densityplot(~mysum$resid,col='black',main='Residual Density Plot', xlab='values of Residuals')
dev.off()
bitmap(file='test4.png')
qqnorm(mysum$resid, main='Residual Normal Q-Q Plot')
qqline(mysum$resid)
grid()
dev.off()
(myerror <- as.ts(mysum$resid))
bitmap(file='test5.png')
dum <- cbind(lag(myerror,k=1),myerror)
dum
dum1 <- dum[2:length(myerror),]
dum1
z <- as.data.frame(dum1)
z
plot(z,main=paste('Residual Lag plot, lowess, and regression line'), ylab='values of Residuals', xlab='lagged values of Residuals')
lines(lowess(z))
abline(lm(z))
grid()
dev.off()
bitmap(file='test6.png')
acf(mysum$resid, lag.max=length(mysum$resid)/2, main='Residual Autocorrelation Function')
grid()
dev.off()
bitmap(file='test7.png')
pacf(mysum$resid, lag.max=length(mysum$resid)/2, main='Residual Partial Autocorrelation Function')
grid()
dev.off()
bitmap(file='test8.png')
opar <- par(mfrow = c(2,2), oma = c(0, 0, 1.1, 0))
plot(mylm, las = 1, sub='Residual Diagnostics')
par(opar)
dev.off()
if (n > n25) {
bitmap(file='test9.png')
plot(kp3:nmkm3,gqarr[,2], main='Goldfeld-Quandt test',ylab='2-sided p-value',xlab='breakpoint')
grid()
dev.off()
}
load(file='createtable')
a<-table.start()
a<-table.row.start(a)
a<-table.element(a, 'Multiple Linear Regression - Estimated Regression Equation', 1, TRUE)
a<-table.row.end(a)
myeq <- colnames(x)[1]
myeq <- paste(myeq, '[t] = ', sep='')
for (i in 1:k){
if (mysum$coefficients[i,1] > 0) myeq <- paste(myeq, '+', '')
myeq <- paste(myeq, mysum$coefficients[i,1], sep=' ')
if (rownames(mysum$coefficients)[i] != '(Intercept)') {
myeq <- paste(myeq, rownames(mysum$coefficients)[i], sep='')
if (rownames(mysum$coefficients)[i] != 't') myeq <- paste(myeq, '[t]', sep='')
}
}
myeq <- paste(myeq, ' + e[t]')
a<-table.row.start(a)
a<-table.element(a, myeq)
a<-table.row.end(a)
a<-table.end(a)
table.save(a,file='mytable1.tab')
a<-table.start()
a<-table.row.start(a)
a<-table.element(a,hyperlink('ols1.htm','Multiple Linear Regression - Ordinary Least Squares',''), 6, TRUE)
a<-table.row.end(a)
a<-table.row.start(a)
a<-table.element(a,'Variable',header=TRUE)
a<-table.element(a,'Parameter',header=TRUE)
a<-table.element(a,'S.D.',header=TRUE)
a<-table.element(a,'T-STAT
H0: parameter = 0',header=TRUE)
a<-table.element(a,'2-tail p-value',header=TRUE)
a<-table.element(a,'1-tail p-value',header=TRUE)
a<-table.row.end(a)
for (i in 1:k){
a<-table.row.start(a)
a<-table.element(a,rownames(mysum$coefficients)[i],header=TRUE)
a<-table.element(a,mysum$coefficients[i,1])
a<-table.element(a, round(mysum$coefficients[i,2],6))
a<-table.element(a, round(mysum$coefficients[i,3],4))
a<-table.element(a, round(mysum$coefficients[i,4],6))
a<-table.element(a, round(mysum$coefficients[i,4]/2,6))
a<-table.row.end(a)
}
a<-table.end(a)
table.save(a,file='mytable2.tab')
a<-table.start()
a<-table.row.start(a)
a<-table.element(a, 'Multiple Linear Regression - Regression Statistics', 2, TRUE)
a<-table.row.end(a)
a<-table.row.start(a)
a<-table.element(a, 'Multiple R',1,TRUE)
a<-table.element(a, sqrt(mysum$r.squared))
a<-table.row.end(a)
a<-table.row.start(a)
a<-table.element(a, 'R-squared',1,TRUE)
a<-table.element(a, mysum$r.squared)
a<-table.row.end(a)
a<-table.row.start(a)
a<-table.element(a, 'Adjusted R-squared',1,TRUE)
a<-table.element(a, mysum$adj.r.squared)
a<-table.row.end(a)
a<-table.row.start(a)
a<-table.element(a, 'F-TEST (value)',1,TRUE)
a<-table.element(a, mysum$fstatistic[1])
a<-table.row.end(a)
a<-table.row.start(a)
a<-table.element(a, 'F-TEST (DF numerator)',1,TRUE)
a<-table.element(a, mysum$fstatistic[2])
a<-table.row.end(a)
a<-table.row.start(a)
a<-table.element(a, 'F-TEST (DF denominator)',1,TRUE)
a<-table.element(a, mysum$fstatistic[3])
a<-table.row.end(a)
a<-table.row.start(a)
a<-table.element(a, 'p-value',1,TRUE)
a<-table.element(a, 1-pf(mysum$fstatistic[1],mysum$fstatistic[2],mysum$fstatistic[3]))
a<-table.row.end(a)
a<-table.row.start(a)
a<-table.element(a, 'Multiple Linear Regression - Residual Statistics', 2, TRUE)
a<-table.row.end(a)
a<-table.row.start(a)
a<-table.element(a, 'Residual Standard Deviation',1,TRUE)
a<-table.element(a, mysum$sigma)
a<-table.row.end(a)
a<-table.row.start(a)
a<-table.element(a, 'Sum Squared Residuals',1,TRUE)
a<-table.element(a, sum(myerror*myerror))
a<-table.row.end(a)
a<-table.end(a)
table.save(a,file='mytable3.tab')
a<-table.start()
a<-table.row.start(a)
a<-table.element(a, 'Multiple Linear Regression - Actuals, Interpolation, and Residuals', 4, TRUE)
a<-table.row.end(a)
a<-table.row.start(a)
a<-table.element(a, 'Time or Index', 1, TRUE)
a<-table.element(a, 'Actuals', 1, TRUE)
a<-table.element(a, 'Interpolation
Forecast', 1, TRUE)
a<-table.element(a, 'Residuals
Prediction Error', 1, TRUE)
a<-table.row.end(a)
for (i in 1:n) {
a<-table.row.start(a)
a<-table.element(a,i, 1, TRUE)
a<-table.element(a,x[i])
a<-table.element(a,x[i]-mysum$resid[i])
a<-table.element(a,mysum$resid[i])
a<-table.row.end(a)
}
a<-table.end(a)
table.save(a,file='mytable4.tab')
if (n > n25) {
a<-table.start()
a<-table.row.start(a)
a<-table.element(a,'Goldfeld-Quandt test for Heteroskedasticity',4,TRUE)
a<-table.row.end(a)
a<-table.row.start(a)
a<-table.element(a,'p-values',header=TRUE)
a<-table.element(a,'Alternative Hypothesis',3,header=TRUE)
a<-table.row.end(a)
a<-table.row.start(a)
a<-table.element(a,'breakpoint index',header=TRUE)
a<-table.element(a,'greater',header=TRUE)
a<-table.element(a,'2-sided',header=TRUE)
a<-table.element(a,'less',header=TRUE)
a<-table.row.end(a)
for (mypoint in kp3:nmkm3) {
a<-table.row.start(a)
a<-table.element(a,mypoint,header=TRUE)
a<-table.element(a,gqarr[mypoint-kp3+1,1])
a<-table.element(a,gqarr[mypoint-kp3+1,2])
a<-table.element(a,gqarr[mypoint-kp3+1,3])
a<-table.row.end(a)
}
a<-table.end(a)
table.save(a,file='mytable5.tab')
a<-table.start()
a<-table.row.start(a)
a<-table.element(a,'Meta Analysis of Goldfeld-Quandt test for Heteroskedasticity',4,TRUE)
a<-table.row.end(a)
a<-table.row.start(a)
a<-table.element(a,'Description',header=TRUE)
a<-table.element(a,'# significant tests',header=TRUE)
a<-table.element(a,'% significant tests',header=TRUE)
a<-table.element(a,'OK/NOK',header=TRUE)
a<-table.row.end(a)
a<-table.row.start(a)
a<-table.element(a,'1% type I error level',header=TRUE)
a<-table.element(a,numsignificant1)
a<-table.element(a,numsignificant1/numgqtests)
if (numsignificant1/numgqtests < 0.01) dum <- 'OK' else dum <- 'NOK'
a<-table.element(a,dum)
a<-table.row.end(a)
a<-table.row.start(a)
a<-table.element(a,'5% type I error level',header=TRUE)
a<-table.element(a,numsignificant5)
a<-table.element(a,numsignificant5/numgqtests)
if (numsignificant5/numgqtests < 0.05) dum <- 'OK' else dum <- 'NOK'
a<-table.element(a,dum)
a<-table.row.end(a)
a<-table.row.start(a)
a<-table.element(a,'10% type I error level',header=TRUE)
a<-table.element(a,numsignificant10)
a<-table.element(a,numsignificant10/numgqtests)
if (numsignificant10/numgqtests < 0.1) dum <- 'OK' else dum <- 'NOK'
a<-table.element(a,dum)
a<-table.row.end(a)
a<-table.end(a)
table.save(a,file='mytable6.tab')
}