Free Statistics

of Irreproducible Research!

Author's title

Author*Unverified author*
R Software Modulerwasp_multipleregression.wasp
Title produced by softwareMultiple Regression
Date of computationThu, 27 Nov 2008 05:00:57 -0700
Cite this page as followsStatistical Computations at FreeStatistics.org, Office for Research Development and Education, URL https://freestatistics.org/blog/index.php?v=date/2008/Nov/27/t1227787397zukxwj3dhstt0cu.htm/, Retrieved Sun, 19 May 2024 10:26:10 +0000
Statistical Computations at FreeStatistics.org, Office for Research Development and Education, URL https://freestatistics.org/blog/index.php?pk=25764, Retrieved Sun, 19 May 2024 10:26:10 +0000
QR Codes:

Original text written by user:
IsPrivate?No (this computation is public)
User-defined keywords
Estimated Impact177
Family? (F = Feedback message, R = changed R code, M = changed R Module, P = changed Parameters, D = changed Data)
-     [Multiple Regression] [] [2008-11-27 10:28:34] [d9be4962be2d3234142c279ef29acbcf]
F   P     [Multiple Regression] [] [2008-11-27 12:00:57] [8767719db498704e1fee27044c098ad0] [Current]
Feedback Forum
2008-11-30 12:29:34 [Gert-Jan Geudens] [reply
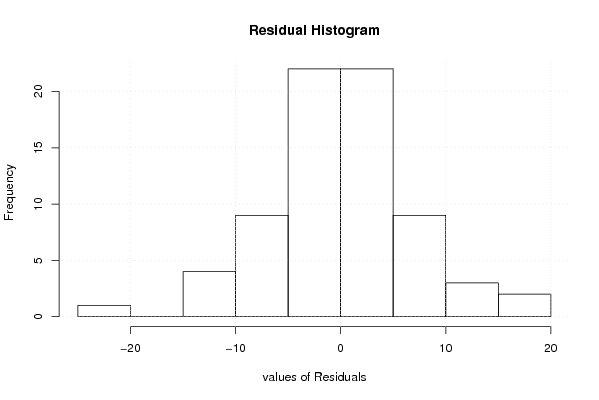
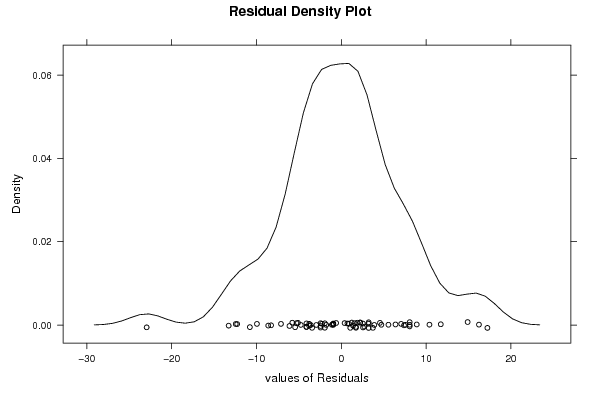
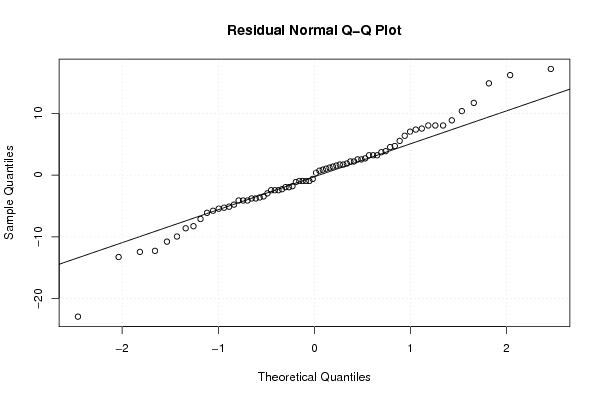
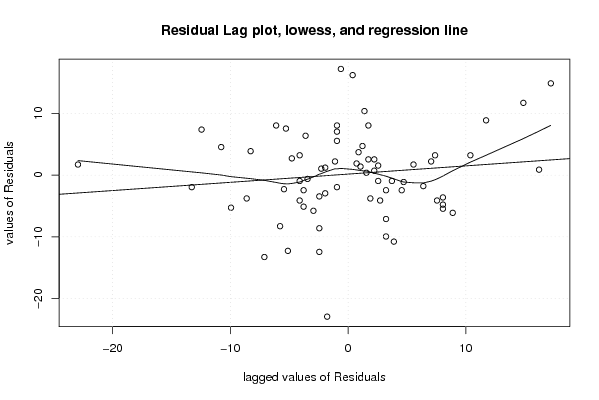
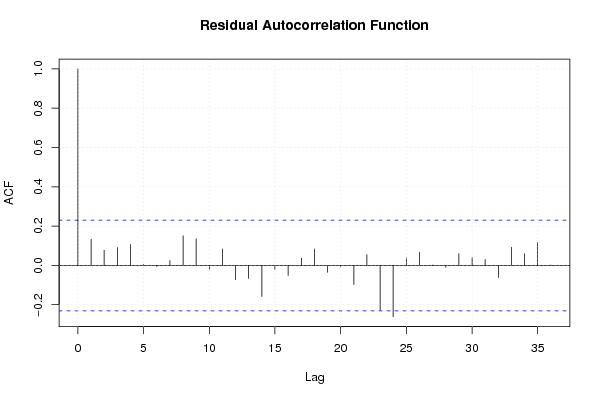
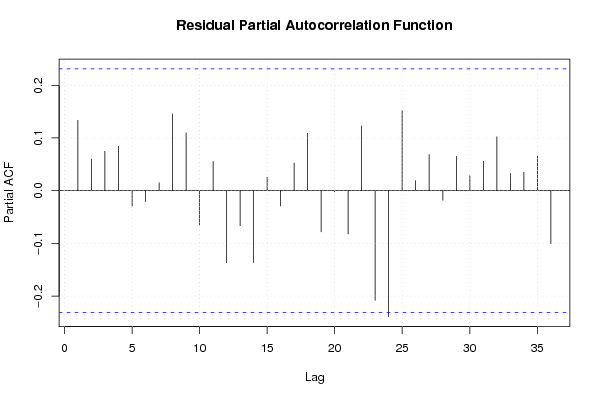
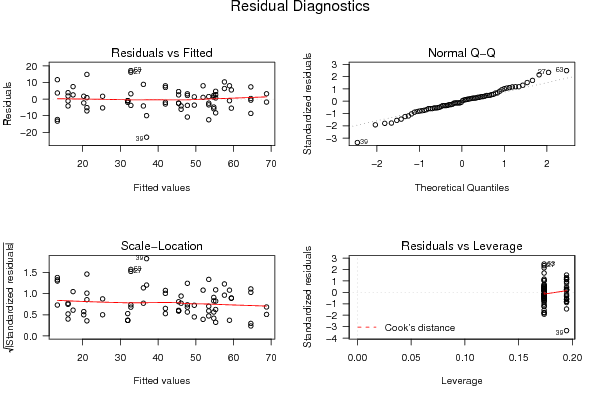
Idem aan de eerste berekening (zonder dummies en lineaire trend). Al moeten we opmerken dat de gemiddelde daling hier wel significant is. Ook uit de behorende grafieken, kunnen we afleiden dat er duidelijk nog niet aan alle assumpties voldaan is. Om het minst vertekend beeld te krijgen, moeten we naar de berekening mét dummies en lineaire trend kijken.
2008-12-01 16:52:24 [Anouk Greeve] [reply
Goede berekening, juiste interpretatie.

Post a new message
Dataseries X:
1	1
16	1
29	1
56	1
51	1
50	1
37	1
20	1
47	1
49	1
39	1
30	1
0	1
14	1
36	1
72	1
41	1
43	1
44	1
18	1
56	1
57	1
49	1
31	1
17	1
22	1
49	1
65	1
55	1
48	1
50	1
15	1
60	1
56	1
40	1
31	1
20	0
27	0
14	0
67	0
64	0
46	0
60	0
22	0
65	0
58	0
42	0
32	0
25	0
20	0
27	0
72	0
68	0
51	0
53	0
18	0
54	0
67	0
40	0
45	0
25	1
36	1
50	1
64	1
50	1
43	1
51	1
12	1
58	1
50	1
50	1
31	1


Summary of computational transaction
Raw Inputview raw input (R code)
Raw Outputview raw output of R engine
Computing time4 seconds
R Server'George Udny Yule' @ 72.249.76.132

\begin{tabular}{lllllllll}
\hline
Summary of computational transaction \tabularnewline
Raw Input & view raw input (R code)  \tabularnewline
Raw Output & view raw output of R engine  \tabularnewline
Computing time & 4 seconds \tabularnewline
R Server & 'George Udny Yule' @ 72.249.76.132 \tabularnewline
\hline
\end{tabular}
%Source: https://freestatistics.org/blog/index.php?pk=25764&T=0

[TABLE]
[ROW][C]Summary of computational transaction[/C][/ROW]
[ROW][C]Raw Input[/C][C]view raw input (R code) [/C][/ROW]
[ROW][C]Raw Output[/C][C]view raw output of R engine [/C][/ROW]
[ROW][C]Computing time[/C][C]4 seconds[/C][/ROW]
[ROW][C]R Server[/C][C]'George Udny Yule' @ 72.249.76.132[/C][/ROW]
[/TABLE]
Source: https://freestatistics.org/blog/index.php?pk=25764&T=0

Globally Unique Identifier (entire table): ba.freestatistics.org/blog/index.php?pk=25764&T=0

As an alternative you can also use a QR Code:  

The GUIDs for individual cells are displayed in the table below:

Summary of computational transaction
Raw Inputview raw input (R code)
Raw Outputview raw output of R engine
Computing time4 seconds
R Server'George Udny Yule' @ 72.249.76.132


Multiple Linear Regression - Estimated Regression Equation
S[t] = + 36.1111111111111 -4.16666666666667D[t] -18.6666666666667M1[t] -10.8333333333334M2[t] + 0.833333333333295M3[t] + 32.6666666666666M4[t] + 21.5M5[t] + 13.5M6[t] + 15.8333333333333M7[t] -15.8333333333334M8[t] + 23.3333333333333M9[t] + 22.8333333333333M10[t] + 9.99999999999999M11[t] + e[t]

\begin{tabular}{lllllllll}
\hline
Multiple Linear Regression - Estimated Regression Equation \tabularnewline
S[t] =  +  36.1111111111111 -4.16666666666667D[t] -18.6666666666667M1[t] -10.8333333333334M2[t] +  0.833333333333295M3[t] +  32.6666666666666M4[t] +  21.5M5[t] +  13.5M6[t] +  15.8333333333333M7[t] -15.8333333333334M8[t] +  23.3333333333333M9[t] +  22.8333333333333M10[t] +  9.99999999999999M11[t]  + e[t] \tabularnewline
\hline
\end{tabular}
%Source: https://freestatistics.org/blog/index.php?pk=25764&T=1

[TABLE]
[ROW][C]Multiple Linear Regression - Estimated Regression Equation[/C][/ROW]
[ROW][C]S[t] =  +  36.1111111111111 -4.16666666666667D[t] -18.6666666666667M1[t] -10.8333333333334M2[t] +  0.833333333333295M3[t] +  32.6666666666666M4[t] +  21.5M5[t] +  13.5M6[t] +  15.8333333333333M7[t] -15.8333333333334M8[t] +  23.3333333333333M9[t] +  22.8333333333333M10[t] +  9.99999999999999M11[t]  + e[t][/C][/ROW]
[/TABLE]
Source: https://freestatistics.org/blog/index.php?pk=25764&T=1

Globally Unique Identifier (entire table): ba.freestatistics.org/blog/index.php?pk=25764&T=1

As an alternative you can also use a QR Code:  

The GUIDs for individual cells are displayed in the table below:

Multiple Linear Regression - Estimated Regression Equation
S[t] = + 36.1111111111111 -4.16666666666667D[t] -18.6666666666667M1[t] -10.8333333333334M2[t] + 0.833333333333295M3[t] + 32.6666666666666M4[t] + 21.5M5[t] + 13.5M6[t] + 15.8333333333333M7[t] -15.8333333333334M8[t] + 23.3333333333333M9[t] + 22.8333333333333M10[t] + 9.99999999999999M11[t] + e[t]


Multiple Linear Regression - Ordinary Least Squares
VariableParameterS.D.T-STATH0: parameter = 02-tail p-value1-tail p-value
(Intercept)36.11111111111113.36251710.739300
D-4.166666666666671.906368-2.18570.0328220.016411
M1-18.66666666666674.402569-4.23998e-054e-05
M2-10.83333333333344.402569-2.46070.0168130.008407
M30.8333333333332954.4025690.18930.850520.42526
M432.66666666666664.4025697.419900
M521.54.4025694.88358e-064e-06
M613.54.4025693.06640.0032670.001634
M715.83333333333334.4025693.59640.000660.00033
M8-15.83333333333344.402569-3.59640.000660.00033
M923.33333333333334.4025695.29992e-061e-06
M1022.83333333333334.4025695.18643e-061e-06
M119.999999999999994.4025692.27140.0267850.013393

\begin{tabular}{lllllllll}
\hline
Multiple Linear Regression - Ordinary Least Squares \tabularnewline
Variable & Parameter & S.D. & T-STATH0: parameter = 0 & 2-tail p-value & 1-tail p-value \tabularnewline
(Intercept) & 36.1111111111111 & 3.362517 & 10.7393 & 0 & 0 \tabularnewline
D & -4.16666666666667 & 1.906368 & -2.1857 & 0.032822 & 0.016411 \tabularnewline
M1 & -18.6666666666667 & 4.402569 & -4.2399 & 8e-05 & 4e-05 \tabularnewline
M2 & -10.8333333333334 & 4.402569 & -2.4607 & 0.016813 & 0.008407 \tabularnewline
M3 & 0.833333333333295 & 4.402569 & 0.1893 & 0.85052 & 0.42526 \tabularnewline
M4 & 32.6666666666666 & 4.402569 & 7.4199 & 0 & 0 \tabularnewline
M5 & 21.5 & 4.402569 & 4.8835 & 8e-06 & 4e-06 \tabularnewline
M6 & 13.5 & 4.402569 & 3.0664 & 0.003267 & 0.001634 \tabularnewline
M7 & 15.8333333333333 & 4.402569 & 3.5964 & 0.00066 & 0.00033 \tabularnewline
M8 & -15.8333333333334 & 4.402569 & -3.5964 & 0.00066 & 0.00033 \tabularnewline
M9 & 23.3333333333333 & 4.402569 & 5.2999 & 2e-06 & 1e-06 \tabularnewline
M10 & 22.8333333333333 & 4.402569 & 5.1864 & 3e-06 & 1e-06 \tabularnewline
M11 & 9.99999999999999 & 4.402569 & 2.2714 & 0.026785 & 0.013393 \tabularnewline
\hline
\end{tabular}
%Source: https://freestatistics.org/blog/index.php?pk=25764&T=2

[TABLE]
[ROW][C]Multiple Linear Regression - Ordinary Least Squares[/C][/ROW]
[ROW][C]Variable[/C][C]Parameter[/C][C]S.D.[/C][C]T-STATH0: parameter = 0[/C][C]2-tail p-value[/C][C]1-tail p-value[/C][/ROW]
[ROW][C](Intercept)[/C][C]36.1111111111111[/C][C]3.362517[/C][C]10.7393[/C][C]0[/C][C]0[/C][/ROW]
[ROW][C]D[/C][C]-4.16666666666667[/C][C]1.906368[/C][C]-2.1857[/C][C]0.032822[/C][C]0.016411[/C][/ROW]
[ROW][C]M1[/C][C]-18.6666666666667[/C][C]4.402569[/C][C]-4.2399[/C][C]8e-05[/C][C]4e-05[/C][/ROW]
[ROW][C]M2[/C][C]-10.8333333333334[/C][C]4.402569[/C][C]-2.4607[/C][C]0.016813[/C][C]0.008407[/C][/ROW]
[ROW][C]M3[/C][C]0.833333333333295[/C][C]4.402569[/C][C]0.1893[/C][C]0.85052[/C][C]0.42526[/C][/ROW]
[ROW][C]M4[/C][C]32.6666666666666[/C][C]4.402569[/C][C]7.4199[/C][C]0[/C][C]0[/C][/ROW]
[ROW][C]M5[/C][C]21.5[/C][C]4.402569[/C][C]4.8835[/C][C]8e-06[/C][C]4e-06[/C][/ROW]
[ROW][C]M6[/C][C]13.5[/C][C]4.402569[/C][C]3.0664[/C][C]0.003267[/C][C]0.001634[/C][/ROW]
[ROW][C]M7[/C][C]15.8333333333333[/C][C]4.402569[/C][C]3.5964[/C][C]0.00066[/C][C]0.00033[/C][/ROW]
[ROW][C]M8[/C][C]-15.8333333333334[/C][C]4.402569[/C][C]-3.5964[/C][C]0.00066[/C][C]0.00033[/C][/ROW]
[ROW][C]M9[/C][C]23.3333333333333[/C][C]4.402569[/C][C]5.2999[/C][C]2e-06[/C][C]1e-06[/C][/ROW]
[ROW][C]M10[/C][C]22.8333333333333[/C][C]4.402569[/C][C]5.1864[/C][C]3e-06[/C][C]1e-06[/C][/ROW]
[ROW][C]M11[/C][C]9.99999999999999[/C][C]4.402569[/C][C]2.2714[/C][C]0.026785[/C][C]0.013393[/C][/ROW]
[/TABLE]
Source: https://freestatistics.org/blog/index.php?pk=25764&T=2

Globally Unique Identifier (entire table): ba.freestatistics.org/blog/index.php?pk=25764&T=2

As an alternative you can also use a QR Code:  

The GUIDs for individual cells are displayed in the table below:

Multiple Linear Regression - Ordinary Least Squares
VariableParameterS.D.T-STATH0: parameter = 02-tail p-value1-tail p-value
(Intercept)36.11111111111113.36251710.739300
D-4.166666666666671.906368-2.18570.0328220.016411
M1-18.66666666666674.402569-4.23998e-054e-05
M2-10.83333333333344.402569-2.46070.0168130.008407
M30.8333333333332954.4025690.18930.850520.42526
M432.66666666666664.4025697.419900
M521.54.4025694.88358e-064e-06
M613.54.4025693.06640.0032670.001634
M715.83333333333334.4025693.59640.000660.00033
M8-15.83333333333344.402569-3.59640.000660.00033
M923.33333333333334.4025695.29992e-061e-06
M1022.83333333333334.4025695.18643e-061e-06
M119.999999999999994.4025692.27140.0267850.013393


Multiple Linear Regression - Regression Statistics
Multiple R0.919686902962468
R-squared0.845823999480696
Adjusted R-squared0.8144661688666
F-TEST (value)26.9732944823194
F-TEST (DF numerator)12
F-TEST (DF denominator)59
p-value0
Multiple Linear Regression - Residual Statistics
Residual Standard Deviation7.62547272468749
Sum Squared Residuals3430.72222222222

\begin{tabular}{lllllllll}
\hline
Multiple Linear Regression - Regression Statistics \tabularnewline
Multiple R & 0.919686902962468 \tabularnewline
R-squared & 0.845823999480696 \tabularnewline
Adjusted R-squared & 0.8144661688666 \tabularnewline
F-TEST (value) & 26.9732944823194 \tabularnewline
F-TEST (DF numerator) & 12 \tabularnewline
F-TEST (DF denominator) & 59 \tabularnewline
p-value & 0 \tabularnewline
Multiple Linear Regression - Residual Statistics \tabularnewline
Residual Standard Deviation & 7.62547272468749 \tabularnewline
Sum Squared Residuals & 3430.72222222222 \tabularnewline
\hline
\end{tabular}
%Source: https://freestatistics.org/blog/index.php?pk=25764&T=3

[TABLE]
[ROW][C]Multiple Linear Regression - Regression Statistics[/C][/ROW]
[ROW][C]Multiple R[/C][C]0.919686902962468[/C][/ROW]
[ROW][C]R-squared[/C][C]0.845823999480696[/C][/ROW]
[ROW][C]Adjusted R-squared[/C][C]0.8144661688666[/C][/ROW]
[ROW][C]F-TEST (value)[/C][C]26.9732944823194[/C][/ROW]
[ROW][C]F-TEST (DF numerator)[/C][C]12[/C][/ROW]
[ROW][C]F-TEST (DF denominator)[/C][C]59[/C][/ROW]
[ROW][C]p-value[/C][C]0[/C][/ROW]
[ROW][C]Multiple Linear Regression - Residual Statistics[/C][/ROW]
[ROW][C]Residual Standard Deviation[/C][C]7.62547272468749[/C][/ROW]
[ROW][C]Sum Squared Residuals[/C][C]3430.72222222222[/C][/ROW]
[/TABLE]
Source: https://freestatistics.org/blog/index.php?pk=25764&T=3

Globally Unique Identifier (entire table): ba.freestatistics.org/blog/index.php?pk=25764&T=3

As an alternative you can also use a QR Code:  

The GUIDs for individual cells are displayed in the table below:

Multiple Linear Regression - Regression Statistics
Multiple R0.919686902962468
R-squared0.845823999480696
Adjusted R-squared0.8144661688666
F-TEST (value)26.9732944823194
F-TEST (DF numerator)12
F-TEST (DF denominator)59
p-value0
Multiple Linear Regression - Residual Statistics
Residual Standard Deviation7.62547272468749
Sum Squared Residuals3430.72222222222


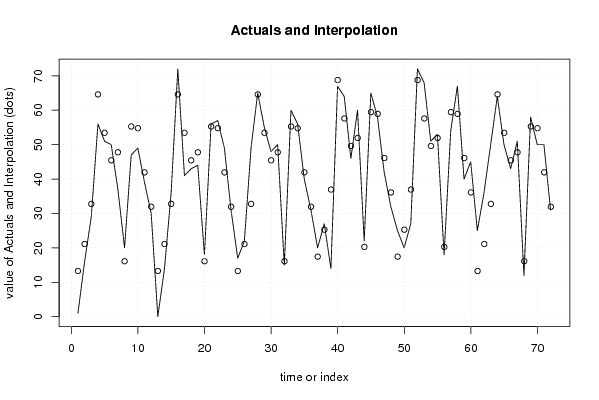
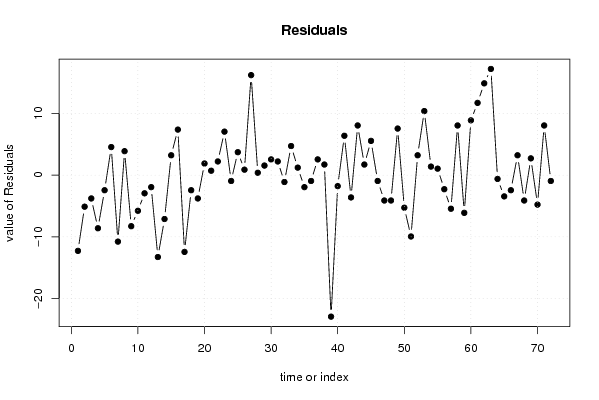
Multiple Linear Regression - Actuals, Interpolation, and Residuals
Time or IndexActualsInterpolationForecastResidualsPrediction Error
1113.2777777777777-12.2777777777777
21621.1111111111111-5.11111111111111
32932.7777777777778-3.77777777777781
45664.6111111111111-8.6111111111111
55153.4444444444444-2.44444444444441
65045.44444444444444.5555555555556
73747.7777777777778-10.7777777777778
82016.11111111111113.88888888888886
94755.2777777777778-8.27777777777779
104954.7777777777778-5.77777777777777
113941.9444444444444-2.94444444444443
123031.9444444444444-1.94444444444444
13013.2777777777778-13.2777777777778
141421.1111111111111-7.11111111111111
153632.77777777777783.22222222222223
167264.61111111111117.38888888888889
174153.4444444444444-12.4444444444445
184345.4444444444444-2.44444444444445
194447.7777777777778-3.77777777777777
201816.11111111111111.88888888888889
215655.27777777777780.722222222222227
225754.77777777777782.22222222222222
234941.94444444444447.05555555555556
243131.9444444444445-0.944444444444454
251713.27777777777783.72222222222221
262221.11111111111110.88888888888889
274932.777777777777816.2222222222222
286564.61111111111110.388888888888884
295553.44444444444441.55555555555555
304845.44444444444452.55555555555555
315047.77777777777782.22222222222223
321516.1111111111111-1.11111111111111
336055.27777777777784.72222222222222
345654.77777777777781.22222222222222
354041.9444444444444-1.94444444444444
363131.9444444444445-0.944444444444454
372017.44444444444452.55555555555554
382725.27777777777781.72222222222222
391436.9444444444444-22.9444444444444
406768.7777777777778-1.77777777777777
416457.61111111111116.38888888888888
424649.6111111111111-3.61111111111112
436051.94444444444448.05555555555557
442220.27777777777781.72222222222223
456559.44444444444445.55555555555556
465858.9444444444444-0.94444444444445
474246.1111111111111-4.11111111111112
483236.1111111111111-4.11111111111113
492517.44444444444457.55555555555554
502025.2777777777778-5.27777777777778
512736.9444444444444-9.94444444444444
527268.77777777777783.22222222222223
536857.611111111111110.3888888888889
545149.61111111111111.38888888888888
555351.94444444444441.05555555555557
561820.2777777777778-2.27777777777777
575459.4444444444444-5.44444444444444
586758.94444444444458.05555555555555
594046.1111111111111-6.11111111111112
604536.11111111111118.88888888888887
612513.277777777777811.7222222222222
623621.111111111111114.8888888888889
635032.777777777777817.2222222222222
646464.6111111111111-0.611111111111116
655053.4444444444444-3.44444444444445
664345.4444444444444-2.44444444444445
675147.77777777777783.22222222222223
681216.1111111111111-4.11111111111111
695855.27777777777782.72222222222223
705054.7777777777778-4.77777777777778
715041.94444444444448.05555555555556
723131.9444444444445-0.944444444444454

\begin{tabular}{lllllllll}
\hline
Multiple Linear Regression - Actuals, Interpolation, and Residuals \tabularnewline
Time or Index & Actuals & InterpolationForecast & ResidualsPrediction Error \tabularnewline
1 & 1 & 13.2777777777777 & -12.2777777777777 \tabularnewline
2 & 16 & 21.1111111111111 & -5.11111111111111 \tabularnewline
3 & 29 & 32.7777777777778 & -3.77777777777781 \tabularnewline
4 & 56 & 64.6111111111111 & -8.6111111111111 \tabularnewline
5 & 51 & 53.4444444444444 & -2.44444444444441 \tabularnewline
6 & 50 & 45.4444444444444 & 4.5555555555556 \tabularnewline
7 & 37 & 47.7777777777778 & -10.7777777777778 \tabularnewline
8 & 20 & 16.1111111111111 & 3.88888888888886 \tabularnewline
9 & 47 & 55.2777777777778 & -8.27777777777779 \tabularnewline
10 & 49 & 54.7777777777778 & -5.77777777777777 \tabularnewline
11 & 39 & 41.9444444444444 & -2.94444444444443 \tabularnewline
12 & 30 & 31.9444444444444 & -1.94444444444444 \tabularnewline
13 & 0 & 13.2777777777778 & -13.2777777777778 \tabularnewline
14 & 14 & 21.1111111111111 & -7.11111111111111 \tabularnewline
15 & 36 & 32.7777777777778 & 3.22222222222223 \tabularnewline
16 & 72 & 64.6111111111111 & 7.38888888888889 \tabularnewline
17 & 41 & 53.4444444444444 & -12.4444444444445 \tabularnewline
18 & 43 & 45.4444444444444 & -2.44444444444445 \tabularnewline
19 & 44 & 47.7777777777778 & -3.77777777777777 \tabularnewline
20 & 18 & 16.1111111111111 & 1.88888888888889 \tabularnewline
21 & 56 & 55.2777777777778 & 0.722222222222227 \tabularnewline
22 & 57 & 54.7777777777778 & 2.22222222222222 \tabularnewline
23 & 49 & 41.9444444444444 & 7.05555555555556 \tabularnewline
24 & 31 & 31.9444444444445 & -0.944444444444454 \tabularnewline
25 & 17 & 13.2777777777778 & 3.72222222222221 \tabularnewline
26 & 22 & 21.1111111111111 & 0.88888888888889 \tabularnewline
27 & 49 & 32.7777777777778 & 16.2222222222222 \tabularnewline
28 & 65 & 64.6111111111111 & 0.388888888888884 \tabularnewline
29 & 55 & 53.4444444444444 & 1.55555555555555 \tabularnewline
30 & 48 & 45.4444444444445 & 2.55555555555555 \tabularnewline
31 & 50 & 47.7777777777778 & 2.22222222222223 \tabularnewline
32 & 15 & 16.1111111111111 & -1.11111111111111 \tabularnewline
33 & 60 & 55.2777777777778 & 4.72222222222222 \tabularnewline
34 & 56 & 54.7777777777778 & 1.22222222222222 \tabularnewline
35 & 40 & 41.9444444444444 & -1.94444444444444 \tabularnewline
36 & 31 & 31.9444444444445 & -0.944444444444454 \tabularnewline
37 & 20 & 17.4444444444445 & 2.55555555555554 \tabularnewline
38 & 27 & 25.2777777777778 & 1.72222222222222 \tabularnewline
39 & 14 & 36.9444444444444 & -22.9444444444444 \tabularnewline
40 & 67 & 68.7777777777778 & -1.77777777777777 \tabularnewline
41 & 64 & 57.6111111111111 & 6.38888888888888 \tabularnewline
42 & 46 & 49.6111111111111 & -3.61111111111112 \tabularnewline
43 & 60 & 51.9444444444444 & 8.05555555555557 \tabularnewline
44 & 22 & 20.2777777777778 & 1.72222222222223 \tabularnewline
45 & 65 & 59.4444444444444 & 5.55555555555556 \tabularnewline
46 & 58 & 58.9444444444444 & -0.94444444444445 \tabularnewline
47 & 42 & 46.1111111111111 & -4.11111111111112 \tabularnewline
48 & 32 & 36.1111111111111 & -4.11111111111113 \tabularnewline
49 & 25 & 17.4444444444445 & 7.55555555555554 \tabularnewline
50 & 20 & 25.2777777777778 & -5.27777777777778 \tabularnewline
51 & 27 & 36.9444444444444 & -9.94444444444444 \tabularnewline
52 & 72 & 68.7777777777778 & 3.22222222222223 \tabularnewline
53 & 68 & 57.6111111111111 & 10.3888888888889 \tabularnewline
54 & 51 & 49.6111111111111 & 1.38888888888888 \tabularnewline
55 & 53 & 51.9444444444444 & 1.05555555555557 \tabularnewline
56 & 18 & 20.2777777777778 & -2.27777777777777 \tabularnewline
57 & 54 & 59.4444444444444 & -5.44444444444444 \tabularnewline
58 & 67 & 58.9444444444445 & 8.05555555555555 \tabularnewline
59 & 40 & 46.1111111111111 & -6.11111111111112 \tabularnewline
60 & 45 & 36.1111111111111 & 8.88888888888887 \tabularnewline
61 & 25 & 13.2777777777778 & 11.7222222222222 \tabularnewline
62 & 36 & 21.1111111111111 & 14.8888888888889 \tabularnewline
63 & 50 & 32.7777777777778 & 17.2222222222222 \tabularnewline
64 & 64 & 64.6111111111111 & -0.611111111111116 \tabularnewline
65 & 50 & 53.4444444444444 & -3.44444444444445 \tabularnewline
66 & 43 & 45.4444444444444 & -2.44444444444445 \tabularnewline
67 & 51 & 47.7777777777778 & 3.22222222222223 \tabularnewline
68 & 12 & 16.1111111111111 & -4.11111111111111 \tabularnewline
69 & 58 & 55.2777777777778 & 2.72222222222223 \tabularnewline
70 & 50 & 54.7777777777778 & -4.77777777777778 \tabularnewline
71 & 50 & 41.9444444444444 & 8.05555555555556 \tabularnewline
72 & 31 & 31.9444444444445 & -0.944444444444454 \tabularnewline
\hline
\end{tabular}
%Source: https://freestatistics.org/blog/index.php?pk=25764&T=4

[TABLE]
[ROW][C]Multiple Linear Regression - Actuals, Interpolation, and Residuals[/C][/ROW]
[ROW][C]Time or Index[/C][C]Actuals[/C][C]InterpolationForecast[/C][C]ResidualsPrediction Error[/C][/ROW]
[ROW][C]1[/C][C]1[/C][C]13.2777777777777[/C][C]-12.2777777777777[/C][/ROW]
[ROW][C]2[/C][C]16[/C][C]21.1111111111111[/C][C]-5.11111111111111[/C][/ROW]
[ROW][C]3[/C][C]29[/C][C]32.7777777777778[/C][C]-3.77777777777781[/C][/ROW]
[ROW][C]4[/C][C]56[/C][C]64.6111111111111[/C][C]-8.6111111111111[/C][/ROW]
[ROW][C]5[/C][C]51[/C][C]53.4444444444444[/C][C]-2.44444444444441[/C][/ROW]
[ROW][C]6[/C][C]50[/C][C]45.4444444444444[/C][C]4.5555555555556[/C][/ROW]
[ROW][C]7[/C][C]37[/C][C]47.7777777777778[/C][C]-10.7777777777778[/C][/ROW]
[ROW][C]8[/C][C]20[/C][C]16.1111111111111[/C][C]3.88888888888886[/C][/ROW]
[ROW][C]9[/C][C]47[/C][C]55.2777777777778[/C][C]-8.27777777777779[/C][/ROW]
[ROW][C]10[/C][C]49[/C][C]54.7777777777778[/C][C]-5.77777777777777[/C][/ROW]
[ROW][C]11[/C][C]39[/C][C]41.9444444444444[/C][C]-2.94444444444443[/C][/ROW]
[ROW][C]12[/C][C]30[/C][C]31.9444444444444[/C][C]-1.94444444444444[/C][/ROW]
[ROW][C]13[/C][C]0[/C][C]13.2777777777778[/C][C]-13.2777777777778[/C][/ROW]
[ROW][C]14[/C][C]14[/C][C]21.1111111111111[/C][C]-7.11111111111111[/C][/ROW]
[ROW][C]15[/C][C]36[/C][C]32.7777777777778[/C][C]3.22222222222223[/C][/ROW]
[ROW][C]16[/C][C]72[/C][C]64.6111111111111[/C][C]7.38888888888889[/C][/ROW]
[ROW][C]17[/C][C]41[/C][C]53.4444444444444[/C][C]-12.4444444444445[/C][/ROW]
[ROW][C]18[/C][C]43[/C][C]45.4444444444444[/C][C]-2.44444444444445[/C][/ROW]
[ROW][C]19[/C][C]44[/C][C]47.7777777777778[/C][C]-3.77777777777777[/C][/ROW]
[ROW][C]20[/C][C]18[/C][C]16.1111111111111[/C][C]1.88888888888889[/C][/ROW]
[ROW][C]21[/C][C]56[/C][C]55.2777777777778[/C][C]0.722222222222227[/C][/ROW]
[ROW][C]22[/C][C]57[/C][C]54.7777777777778[/C][C]2.22222222222222[/C][/ROW]
[ROW][C]23[/C][C]49[/C][C]41.9444444444444[/C][C]7.05555555555556[/C][/ROW]
[ROW][C]24[/C][C]31[/C][C]31.9444444444445[/C][C]-0.944444444444454[/C][/ROW]
[ROW][C]25[/C][C]17[/C][C]13.2777777777778[/C][C]3.72222222222221[/C][/ROW]
[ROW][C]26[/C][C]22[/C][C]21.1111111111111[/C][C]0.88888888888889[/C][/ROW]
[ROW][C]27[/C][C]49[/C][C]32.7777777777778[/C][C]16.2222222222222[/C][/ROW]
[ROW][C]28[/C][C]65[/C][C]64.6111111111111[/C][C]0.388888888888884[/C][/ROW]
[ROW][C]29[/C][C]55[/C][C]53.4444444444444[/C][C]1.55555555555555[/C][/ROW]
[ROW][C]30[/C][C]48[/C][C]45.4444444444445[/C][C]2.55555555555555[/C][/ROW]
[ROW][C]31[/C][C]50[/C][C]47.7777777777778[/C][C]2.22222222222223[/C][/ROW]
[ROW][C]32[/C][C]15[/C][C]16.1111111111111[/C][C]-1.11111111111111[/C][/ROW]
[ROW][C]33[/C][C]60[/C][C]55.2777777777778[/C][C]4.72222222222222[/C][/ROW]
[ROW][C]34[/C][C]56[/C][C]54.7777777777778[/C][C]1.22222222222222[/C][/ROW]
[ROW][C]35[/C][C]40[/C][C]41.9444444444444[/C][C]-1.94444444444444[/C][/ROW]
[ROW][C]36[/C][C]31[/C][C]31.9444444444445[/C][C]-0.944444444444454[/C][/ROW]
[ROW][C]37[/C][C]20[/C][C]17.4444444444445[/C][C]2.55555555555554[/C][/ROW]
[ROW][C]38[/C][C]27[/C][C]25.2777777777778[/C][C]1.72222222222222[/C][/ROW]
[ROW][C]39[/C][C]14[/C][C]36.9444444444444[/C][C]-22.9444444444444[/C][/ROW]
[ROW][C]40[/C][C]67[/C][C]68.7777777777778[/C][C]-1.77777777777777[/C][/ROW]
[ROW][C]41[/C][C]64[/C][C]57.6111111111111[/C][C]6.38888888888888[/C][/ROW]
[ROW][C]42[/C][C]46[/C][C]49.6111111111111[/C][C]-3.61111111111112[/C][/ROW]
[ROW][C]43[/C][C]60[/C][C]51.9444444444444[/C][C]8.05555555555557[/C][/ROW]
[ROW][C]44[/C][C]22[/C][C]20.2777777777778[/C][C]1.72222222222223[/C][/ROW]
[ROW][C]45[/C][C]65[/C][C]59.4444444444444[/C][C]5.55555555555556[/C][/ROW]
[ROW][C]46[/C][C]58[/C][C]58.9444444444444[/C][C]-0.94444444444445[/C][/ROW]
[ROW][C]47[/C][C]42[/C][C]46.1111111111111[/C][C]-4.11111111111112[/C][/ROW]
[ROW][C]48[/C][C]32[/C][C]36.1111111111111[/C][C]-4.11111111111113[/C][/ROW]
[ROW][C]49[/C][C]25[/C][C]17.4444444444445[/C][C]7.55555555555554[/C][/ROW]
[ROW][C]50[/C][C]20[/C][C]25.2777777777778[/C][C]-5.27777777777778[/C][/ROW]
[ROW][C]51[/C][C]27[/C][C]36.9444444444444[/C][C]-9.94444444444444[/C][/ROW]
[ROW][C]52[/C][C]72[/C][C]68.7777777777778[/C][C]3.22222222222223[/C][/ROW]
[ROW][C]53[/C][C]68[/C][C]57.6111111111111[/C][C]10.3888888888889[/C][/ROW]
[ROW][C]54[/C][C]51[/C][C]49.6111111111111[/C][C]1.38888888888888[/C][/ROW]
[ROW][C]55[/C][C]53[/C][C]51.9444444444444[/C][C]1.05555555555557[/C][/ROW]
[ROW][C]56[/C][C]18[/C][C]20.2777777777778[/C][C]-2.27777777777777[/C][/ROW]
[ROW][C]57[/C][C]54[/C][C]59.4444444444444[/C][C]-5.44444444444444[/C][/ROW]
[ROW][C]58[/C][C]67[/C][C]58.9444444444445[/C][C]8.05555555555555[/C][/ROW]
[ROW][C]59[/C][C]40[/C][C]46.1111111111111[/C][C]-6.11111111111112[/C][/ROW]
[ROW][C]60[/C][C]45[/C][C]36.1111111111111[/C][C]8.88888888888887[/C][/ROW]
[ROW][C]61[/C][C]25[/C][C]13.2777777777778[/C][C]11.7222222222222[/C][/ROW]
[ROW][C]62[/C][C]36[/C][C]21.1111111111111[/C][C]14.8888888888889[/C][/ROW]
[ROW][C]63[/C][C]50[/C][C]32.7777777777778[/C][C]17.2222222222222[/C][/ROW]
[ROW][C]64[/C][C]64[/C][C]64.6111111111111[/C][C]-0.611111111111116[/C][/ROW]
[ROW][C]65[/C][C]50[/C][C]53.4444444444444[/C][C]-3.44444444444445[/C][/ROW]
[ROW][C]66[/C][C]43[/C][C]45.4444444444444[/C][C]-2.44444444444445[/C][/ROW]
[ROW][C]67[/C][C]51[/C][C]47.7777777777778[/C][C]3.22222222222223[/C][/ROW]
[ROW][C]68[/C][C]12[/C][C]16.1111111111111[/C][C]-4.11111111111111[/C][/ROW]
[ROW][C]69[/C][C]58[/C][C]55.2777777777778[/C][C]2.72222222222223[/C][/ROW]
[ROW][C]70[/C][C]50[/C][C]54.7777777777778[/C][C]-4.77777777777778[/C][/ROW]
[ROW][C]71[/C][C]50[/C][C]41.9444444444444[/C][C]8.05555555555556[/C][/ROW]
[ROW][C]72[/C][C]31[/C][C]31.9444444444445[/C][C]-0.944444444444454[/C][/ROW]
[/TABLE]
Source: https://freestatistics.org/blog/index.php?pk=25764&T=4

Globally Unique Identifier (entire table): ba.freestatistics.org/blog/index.php?pk=25764&T=4

As an alternative you can also use a QR Code:  

The GUIDs for individual cells are displayed in the table below:

Multiple Linear Regression - Actuals, Interpolation, and Residuals
Time or IndexActualsInterpolationForecastResidualsPrediction Error
1113.2777777777777-12.2777777777777
21621.1111111111111-5.11111111111111
32932.7777777777778-3.77777777777781
45664.6111111111111-8.6111111111111
55153.4444444444444-2.44444444444441
65045.44444444444444.5555555555556
73747.7777777777778-10.7777777777778
82016.11111111111113.88888888888886
94755.2777777777778-8.27777777777779
104954.7777777777778-5.77777777777777
113941.9444444444444-2.94444444444443
123031.9444444444444-1.94444444444444
13013.2777777777778-13.2777777777778
141421.1111111111111-7.11111111111111
153632.77777777777783.22222222222223
167264.61111111111117.38888888888889
174153.4444444444444-12.4444444444445
184345.4444444444444-2.44444444444445
194447.7777777777778-3.77777777777777
201816.11111111111111.88888888888889
215655.27777777777780.722222222222227
225754.77777777777782.22222222222222
234941.94444444444447.05555555555556
243131.9444444444445-0.944444444444454
251713.27777777777783.72222222222221
262221.11111111111110.88888888888889
274932.777777777777816.2222222222222
286564.61111111111110.388888888888884
295553.44444444444441.55555555555555
304845.44444444444452.55555555555555
315047.77777777777782.22222222222223
321516.1111111111111-1.11111111111111
336055.27777777777784.72222222222222
345654.77777777777781.22222222222222
354041.9444444444444-1.94444444444444
363131.9444444444445-0.944444444444454
372017.44444444444452.55555555555554
382725.27777777777781.72222222222222
391436.9444444444444-22.9444444444444
406768.7777777777778-1.77777777777777
416457.61111111111116.38888888888888
424649.6111111111111-3.61111111111112
436051.94444444444448.05555555555557
442220.27777777777781.72222222222223
456559.44444444444445.55555555555556
465858.9444444444444-0.94444444444445
474246.1111111111111-4.11111111111112
483236.1111111111111-4.11111111111113
492517.44444444444457.55555555555554
502025.2777777777778-5.27777777777778
512736.9444444444444-9.94444444444444
527268.77777777777783.22222222222223
536857.611111111111110.3888888888889
545149.61111111111111.38888888888888
555351.94444444444441.05555555555557
561820.2777777777778-2.27777777777777
575459.4444444444444-5.44444444444444
586758.94444444444458.05555555555555
594046.1111111111111-6.11111111111112
604536.11111111111118.88888888888887
612513.277777777777811.7222222222222
623621.111111111111114.8888888888889
635032.777777777777817.2222222222222
646464.6111111111111-0.611111111111116
655053.4444444444444-3.44444444444445
664345.4444444444444-2.44444444444445
675147.77777777777783.22222222222223
681216.1111111111111-4.11111111111111
695855.27777777777782.72222222222223
705054.7777777777778-4.77777777777778
715041.94444444444448.05555555555556
723131.9444444444445-0.944444444444454


Goldfeld-Quandt test for Heteroskedasticity
p-valuesAlternative Hypothesis
breakpoint indexgreater2-sidedless
160.5858437659651630.8283124680696750.414156234034837
170.6090867619444860.7818264761110280.390913238055514
180.5258047149153390.9483905701693220.474195285084661
190.467374202415040.934748404830080.53262579758496
200.3483874974260540.6967749948521080.651612502573946
210.3257093546234270.6514187092468540.674290645376573
220.2855613670079840.5711227340159680.714438632992016
230.2884315513002270.5768631026004540.711568448699773
240.2078974011545020.4157948023090040.792102598845498
250.3873489059752750.774697811950550.612651094024725
260.3469540959934990.6939081919869970.653045904006501
270.6153470987910050.7693058024179890.384652901208995
280.5276142842591350.944771431481730.472385715740865
290.5073228424454630.9853543151090750.492677157554537
300.4228737281353890.8457474562707770.577126271864611
310.405340107325830.810680214651660.59465989267417
320.3344867025839590.6689734051679180.665513297416041
330.3015663271314780.6031326542629560.698433672868522
340.2364674915573710.4729349831147420.763532508442629
350.1857095782644340.3714191565288670.814290421735566
360.1390820136770960.2781640273541910.860917986322904
370.1024987819110240.2049975638220480.897501218088976
380.07200369427423540.1440073885484710.927996305725765
390.6194823906026860.7610352187946280.380517609397314
400.5402408307638290.9195183384723430.459759169236171
410.5311312960412250.937737407917550.468868703958775
420.4527854379070270.9055708758140540.547214562092973
430.4525972429902360.9051944859804720.547402757009764
440.3870160837703600.7740321675407190.61298391622964
450.3519198198048440.7038396396096880.648080180195156
460.2714356934632610.5428713869265220.728564306536739
470.2126594356141620.4253188712283240.787340564385838
480.1688677539236420.3377355078472840.831132246076358
490.1403758408865980.2807516817731960.859624159113402
500.1872893216636560.3745786433273110.812710678336344
510.6117563536462390.7764872927075220.388243646353761
520.4996300946098770.9992601892197540.500369905390123
530.5605079641491460.8789840717017080.439492035850854
540.4377867446080800.8755734892161610.56221325539192
550.3051002164638090.6102004329276180.694899783536191
560.1845665533249790.3691331066499570.815433446675021

\begin{tabular}{lllllllll}
\hline
Goldfeld-Quandt test for Heteroskedasticity \tabularnewline
p-values & Alternative Hypothesis \tabularnewline
breakpoint index & greater & 2-sided & less \tabularnewline
16 & 0.585843765965163 & 0.828312468069675 & 0.414156234034837 \tabularnewline
17 & 0.609086761944486 & 0.781826476111028 & 0.390913238055514 \tabularnewline
18 & 0.525804714915339 & 0.948390570169322 & 0.474195285084661 \tabularnewline
19 & 0.46737420241504 & 0.93474840483008 & 0.53262579758496 \tabularnewline
20 & 0.348387497426054 & 0.696774994852108 & 0.651612502573946 \tabularnewline
21 & 0.325709354623427 & 0.651418709246854 & 0.674290645376573 \tabularnewline
22 & 0.285561367007984 & 0.571122734015968 & 0.714438632992016 \tabularnewline
23 & 0.288431551300227 & 0.576863102600454 & 0.711568448699773 \tabularnewline
24 & 0.207897401154502 & 0.415794802309004 & 0.792102598845498 \tabularnewline
25 & 0.387348905975275 & 0.77469781195055 & 0.612651094024725 \tabularnewline
26 & 0.346954095993499 & 0.693908191986997 & 0.653045904006501 \tabularnewline
27 & 0.615347098791005 & 0.769305802417989 & 0.384652901208995 \tabularnewline
28 & 0.527614284259135 & 0.94477143148173 & 0.472385715740865 \tabularnewline
29 & 0.507322842445463 & 0.985354315109075 & 0.492677157554537 \tabularnewline
30 & 0.422873728135389 & 0.845747456270777 & 0.577126271864611 \tabularnewline
31 & 0.40534010732583 & 0.81068021465166 & 0.59465989267417 \tabularnewline
32 & 0.334486702583959 & 0.668973405167918 & 0.665513297416041 \tabularnewline
33 & 0.301566327131478 & 0.603132654262956 & 0.698433672868522 \tabularnewline
34 & 0.236467491557371 & 0.472934983114742 & 0.763532508442629 \tabularnewline
35 & 0.185709578264434 & 0.371419156528867 & 0.814290421735566 \tabularnewline
36 & 0.139082013677096 & 0.278164027354191 & 0.860917986322904 \tabularnewline
37 & 0.102498781911024 & 0.204997563822048 & 0.897501218088976 \tabularnewline
38 & 0.0720036942742354 & 0.144007388548471 & 0.927996305725765 \tabularnewline
39 & 0.619482390602686 & 0.761035218794628 & 0.380517609397314 \tabularnewline
40 & 0.540240830763829 & 0.919518338472343 & 0.459759169236171 \tabularnewline
41 & 0.531131296041225 & 0.93773740791755 & 0.468868703958775 \tabularnewline
42 & 0.452785437907027 & 0.905570875814054 & 0.547214562092973 \tabularnewline
43 & 0.452597242990236 & 0.905194485980472 & 0.547402757009764 \tabularnewline
44 & 0.387016083770360 & 0.774032167540719 & 0.61298391622964 \tabularnewline
45 & 0.351919819804844 & 0.703839639609688 & 0.648080180195156 \tabularnewline
46 & 0.271435693463261 & 0.542871386926522 & 0.728564306536739 \tabularnewline
47 & 0.212659435614162 & 0.425318871228324 & 0.787340564385838 \tabularnewline
48 & 0.168867753923642 & 0.337735507847284 & 0.831132246076358 \tabularnewline
49 & 0.140375840886598 & 0.280751681773196 & 0.859624159113402 \tabularnewline
50 & 0.187289321663656 & 0.374578643327311 & 0.812710678336344 \tabularnewline
51 & 0.611756353646239 & 0.776487292707522 & 0.388243646353761 \tabularnewline
52 & 0.499630094609877 & 0.999260189219754 & 0.500369905390123 \tabularnewline
53 & 0.560507964149146 & 0.878984071701708 & 0.439492035850854 \tabularnewline
54 & 0.437786744608080 & 0.875573489216161 & 0.56221325539192 \tabularnewline
55 & 0.305100216463809 & 0.610200432927618 & 0.694899783536191 \tabularnewline
56 & 0.184566553324979 & 0.369133106649957 & 0.815433446675021 \tabularnewline
\hline
\end{tabular}
%Source: https://freestatistics.org/blog/index.php?pk=25764&T=5

[TABLE]
[ROW][C]Goldfeld-Quandt test for Heteroskedasticity[/C][/ROW]
[ROW][C]p-values[/C][C]Alternative Hypothesis[/C][/ROW]
[ROW][C]breakpoint index[/C][C]greater[/C][C]2-sided[/C][C]less[/C][/ROW]
[ROW][C]16[/C][C]0.585843765965163[/C][C]0.828312468069675[/C][C]0.414156234034837[/C][/ROW]
[ROW][C]17[/C][C]0.609086761944486[/C][C]0.781826476111028[/C][C]0.390913238055514[/C][/ROW]
[ROW][C]18[/C][C]0.525804714915339[/C][C]0.948390570169322[/C][C]0.474195285084661[/C][/ROW]
[ROW][C]19[/C][C]0.46737420241504[/C][C]0.93474840483008[/C][C]0.53262579758496[/C][/ROW]
[ROW][C]20[/C][C]0.348387497426054[/C][C]0.696774994852108[/C][C]0.651612502573946[/C][/ROW]
[ROW][C]21[/C][C]0.325709354623427[/C][C]0.651418709246854[/C][C]0.674290645376573[/C][/ROW]
[ROW][C]22[/C][C]0.285561367007984[/C][C]0.571122734015968[/C][C]0.714438632992016[/C][/ROW]
[ROW][C]23[/C][C]0.288431551300227[/C][C]0.576863102600454[/C][C]0.711568448699773[/C][/ROW]
[ROW][C]24[/C][C]0.207897401154502[/C][C]0.415794802309004[/C][C]0.792102598845498[/C][/ROW]
[ROW][C]25[/C][C]0.387348905975275[/C][C]0.77469781195055[/C][C]0.612651094024725[/C][/ROW]
[ROW][C]26[/C][C]0.346954095993499[/C][C]0.693908191986997[/C][C]0.653045904006501[/C][/ROW]
[ROW][C]27[/C][C]0.615347098791005[/C][C]0.769305802417989[/C][C]0.384652901208995[/C][/ROW]
[ROW][C]28[/C][C]0.527614284259135[/C][C]0.94477143148173[/C][C]0.472385715740865[/C][/ROW]
[ROW][C]29[/C][C]0.507322842445463[/C][C]0.985354315109075[/C][C]0.492677157554537[/C][/ROW]
[ROW][C]30[/C][C]0.422873728135389[/C][C]0.845747456270777[/C][C]0.577126271864611[/C][/ROW]
[ROW][C]31[/C][C]0.40534010732583[/C][C]0.81068021465166[/C][C]0.59465989267417[/C][/ROW]
[ROW][C]32[/C][C]0.334486702583959[/C][C]0.668973405167918[/C][C]0.665513297416041[/C][/ROW]
[ROW][C]33[/C][C]0.301566327131478[/C][C]0.603132654262956[/C][C]0.698433672868522[/C][/ROW]
[ROW][C]34[/C][C]0.236467491557371[/C][C]0.472934983114742[/C][C]0.763532508442629[/C][/ROW]
[ROW][C]35[/C][C]0.185709578264434[/C][C]0.371419156528867[/C][C]0.814290421735566[/C][/ROW]
[ROW][C]36[/C][C]0.139082013677096[/C][C]0.278164027354191[/C][C]0.860917986322904[/C][/ROW]
[ROW][C]37[/C][C]0.102498781911024[/C][C]0.204997563822048[/C][C]0.897501218088976[/C][/ROW]
[ROW][C]38[/C][C]0.0720036942742354[/C][C]0.144007388548471[/C][C]0.927996305725765[/C][/ROW]
[ROW][C]39[/C][C]0.619482390602686[/C][C]0.761035218794628[/C][C]0.380517609397314[/C][/ROW]
[ROW][C]40[/C][C]0.540240830763829[/C][C]0.919518338472343[/C][C]0.459759169236171[/C][/ROW]
[ROW][C]41[/C][C]0.531131296041225[/C][C]0.93773740791755[/C][C]0.468868703958775[/C][/ROW]
[ROW][C]42[/C][C]0.452785437907027[/C][C]0.905570875814054[/C][C]0.547214562092973[/C][/ROW]
[ROW][C]43[/C][C]0.452597242990236[/C][C]0.905194485980472[/C][C]0.547402757009764[/C][/ROW]
[ROW][C]44[/C][C]0.387016083770360[/C][C]0.774032167540719[/C][C]0.61298391622964[/C][/ROW]
[ROW][C]45[/C][C]0.351919819804844[/C][C]0.703839639609688[/C][C]0.648080180195156[/C][/ROW]
[ROW][C]46[/C][C]0.271435693463261[/C][C]0.542871386926522[/C][C]0.728564306536739[/C][/ROW]
[ROW][C]47[/C][C]0.212659435614162[/C][C]0.425318871228324[/C][C]0.787340564385838[/C][/ROW]
[ROW][C]48[/C][C]0.168867753923642[/C][C]0.337735507847284[/C][C]0.831132246076358[/C][/ROW]
[ROW][C]49[/C][C]0.140375840886598[/C][C]0.280751681773196[/C][C]0.859624159113402[/C][/ROW]
[ROW][C]50[/C][C]0.187289321663656[/C][C]0.374578643327311[/C][C]0.812710678336344[/C][/ROW]
[ROW][C]51[/C][C]0.611756353646239[/C][C]0.776487292707522[/C][C]0.388243646353761[/C][/ROW]
[ROW][C]52[/C][C]0.499630094609877[/C][C]0.999260189219754[/C][C]0.500369905390123[/C][/ROW]
[ROW][C]53[/C][C]0.560507964149146[/C][C]0.878984071701708[/C][C]0.439492035850854[/C][/ROW]
[ROW][C]54[/C][C]0.437786744608080[/C][C]0.875573489216161[/C][C]0.56221325539192[/C][/ROW]
[ROW][C]55[/C][C]0.305100216463809[/C][C]0.610200432927618[/C][C]0.694899783536191[/C][/ROW]
[ROW][C]56[/C][C]0.184566553324979[/C][C]0.369133106649957[/C][C]0.815433446675021[/C][/ROW]
[/TABLE]
Source: https://freestatistics.org/blog/index.php?pk=25764&T=5

Globally Unique Identifier (entire table): ba.freestatistics.org/blog/index.php?pk=25764&T=5

As an alternative you can also use a QR Code:  

The GUIDs for individual cells are displayed in the table below:

Goldfeld-Quandt test for Heteroskedasticity
p-valuesAlternative Hypothesis
breakpoint indexgreater2-sidedless
160.5858437659651630.8283124680696750.414156234034837
170.6090867619444860.7818264761110280.390913238055514
180.5258047149153390.9483905701693220.474195285084661
190.467374202415040.934748404830080.53262579758496
200.3483874974260540.6967749948521080.651612502573946
210.3257093546234270.6514187092468540.674290645376573
220.2855613670079840.5711227340159680.714438632992016
230.2884315513002270.5768631026004540.711568448699773
240.2078974011545020.4157948023090040.792102598845498
250.3873489059752750.774697811950550.612651094024725
260.3469540959934990.6939081919869970.653045904006501
270.6153470987910050.7693058024179890.384652901208995
280.5276142842591350.944771431481730.472385715740865
290.5073228424454630.9853543151090750.492677157554537
300.4228737281353890.8457474562707770.577126271864611
310.405340107325830.810680214651660.59465989267417
320.3344867025839590.6689734051679180.665513297416041
330.3015663271314780.6031326542629560.698433672868522
340.2364674915573710.4729349831147420.763532508442629
350.1857095782644340.3714191565288670.814290421735566
360.1390820136770960.2781640273541910.860917986322904
370.1024987819110240.2049975638220480.897501218088976
380.07200369427423540.1440073885484710.927996305725765
390.6194823906026860.7610352187946280.380517609397314
400.5402408307638290.9195183384723430.459759169236171
410.5311312960412250.937737407917550.468868703958775
420.4527854379070270.9055708758140540.547214562092973
430.4525972429902360.9051944859804720.547402757009764
440.3870160837703600.7740321675407190.61298391622964
450.3519198198048440.7038396396096880.648080180195156
460.2714356934632610.5428713869265220.728564306536739
470.2126594356141620.4253188712283240.787340564385838
480.1688677539236420.3377355078472840.831132246076358
490.1403758408865980.2807516817731960.859624159113402
500.1872893216636560.3745786433273110.812710678336344
510.6117563536462390.7764872927075220.388243646353761
520.4996300946098770.9992601892197540.500369905390123
530.5605079641491460.8789840717017080.439492035850854
540.4377867446080800.8755734892161610.56221325539192
550.3051002164638090.6102004329276180.694899783536191
560.1845665533249790.3691331066499570.815433446675021


Meta Analysis of Goldfeld-Quandt test for Heteroskedasticity
Description# significant tests% significant testsOK/NOK
1% type I error level00OK
5% type I error level00OK
10% type I error level00OK

\begin{tabular}{lllllllll}
\hline
Meta Analysis of Goldfeld-Quandt test for Heteroskedasticity \tabularnewline
Description & # significant tests & % significant tests & OK/NOK \tabularnewline
1% type I error level & 0 & 0 & OK \tabularnewline
5% type I error level & 0 & 0 & OK \tabularnewline
10% type I error level & 0 & 0 & OK \tabularnewline
\hline
\end{tabular}
%Source: https://freestatistics.org/blog/index.php?pk=25764&T=6

[TABLE]
[ROW][C]Meta Analysis of Goldfeld-Quandt test for Heteroskedasticity[/C][/ROW]
[ROW][C]Description[/C][C]# significant tests[/C][C]% significant tests[/C][C]OK/NOK[/C][/ROW]
[ROW][C]1% type I error level[/C][C]0[/C][C]0[/C][C]OK[/C][/ROW]
[ROW][C]5% type I error level[/C][C]0[/C][C]0[/C][C]OK[/C][/ROW]
[ROW][C]10% type I error level[/C][C]0[/C][C]0[/C][C]OK[/C][/ROW]
[/TABLE]
Source: https://freestatistics.org/blog/index.php?pk=25764&T=6

Globally Unique Identifier (entire table): ba.freestatistics.org/blog/index.php?pk=25764&T=6

As an alternative you can also use a QR Code:  

The GUIDs for individual cells are displayed in the table below:

Meta Analysis of Goldfeld-Quandt test for Heteroskedasticity
Description# significant tests% significant testsOK/NOK
1% type I error level00OK
5% type I error level00OK
10% type I error level00OK


Parameters (Session):
par1 = 1 ; par2 = Include Monthly Dummies ; par3 = No Linear Trend ;
Parameters (R input):
par1 = 1 ; par2 = Include Monthly Dummies ; par3 = No Linear Trend ;
R code (references can be found in the software module):
library(lattice)
library(lmtest)
n25 <- 25 #minimum number of obs. for Goldfeld-Quandt test
par1 <- as.numeric(par1)
x <- t(y)
k <- length(x[1,])
n <- length(x[,1])
x1 <- cbind(x[,par1], x[,1:k!=par1])
mycolnames <- c(colnames(x)[par1], colnames(x)[1:k!=par1])
colnames(x1) <- mycolnames #colnames(x)[par1]
x <- x1
if (par3 == 'First Differences'){
x2 <- array(0, dim=c(n-1,k), dimnames=list(1:(n-1), paste('(1-B)',colnames(x),sep='')))
for (i in 1:n-1) {
for (j in 1:k) {
x2[i,j] <- x[i+1,j] - x[i,j]
}
}
x <- x2
}
if (par2 == 'Include Monthly Dummies'){
x2 <- array(0, dim=c(n,11), dimnames=list(1:n, paste('M', seq(1:11), sep ='')))
for (i in 1:11){
x2[seq(i,n,12),i] <- 1
}
x <- cbind(x, x2)
}
if (par2 == 'Include Quarterly Dummies'){
x2 <- array(0, dim=c(n,3), dimnames=list(1:n, paste('Q', seq(1:3), sep ='')))
for (i in 1:3){
x2[seq(i,n,4),i] <- 1
}
x <- cbind(x, x2)
}
k <- length(x[1,])
if (par3 == 'Linear Trend'){
x <- cbind(x, c(1:n))
colnames(x)[k+1] <- 't'
}
x
k <- length(x[1,])
df <- as.data.frame(x)
(mylm <- lm(df))
(mysum <- summary(mylm))
if (n > n25) {
kp3 <- k + 3
nmkm3 <- n - k - 3
gqarr <- array(NA, dim=c(nmkm3-kp3+1,3))
numgqtests <- 0
numsignificant1 <- 0
numsignificant5 <- 0
numsignificant10 <- 0
for (mypoint in kp3:nmkm3) {
j <- 0
numgqtests <- numgqtests + 1
for (myalt in c('greater', 'two.sided', 'less')) {
j <- j + 1
gqarr[mypoint-kp3+1,j] <- gqtest(mylm, point=mypoint, alternative=myalt)$p.value
}
if (gqarr[mypoint-kp3+1,2] < 0.01) numsignificant1 <- numsignificant1 + 1
if (gqarr[mypoint-kp3+1,2] < 0.05) numsignificant5 <- numsignificant5 + 1
if (gqarr[mypoint-kp3+1,2] < 0.10) numsignificant10 <- numsignificant10 + 1
}
gqarr
}
bitmap(file='test0.png')
plot(x[,1], type='l', main='Actuals and Interpolation', ylab='value of Actuals and Interpolation (dots)', xlab='time or index')
points(x[,1]-mysum$resid)
grid()
dev.off()
bitmap(file='test1.png')
plot(mysum$resid, type='b', pch=19, main='Residuals', ylab='value of Residuals', xlab='time or index')
grid()
dev.off()
bitmap(file='test2.png')
hist(mysum$resid, main='Residual Histogram', xlab='values of Residuals')
grid()
dev.off()
bitmap(file='test3.png')
densityplot(~mysum$resid,col='black',main='Residual Density Plot', xlab='values of Residuals')
dev.off()
bitmap(file='test4.png')
qqnorm(mysum$resid, main='Residual Normal Q-Q Plot')
qqline(mysum$resid)
grid()
dev.off()
(myerror <- as.ts(mysum$resid))
bitmap(file='test5.png')
dum <- cbind(lag(myerror,k=1),myerror)
dum
dum1 <- dum[2:length(myerror),]
dum1
z <- as.data.frame(dum1)
z
plot(z,main=paste('Residual Lag plot, lowess, and regression line'), ylab='values of Residuals', xlab='lagged values of Residuals')
lines(lowess(z))
abline(lm(z))
grid()
dev.off()
bitmap(file='test6.png')
acf(mysum$resid, lag.max=length(mysum$resid)/2, main='Residual Autocorrelation Function')
grid()
dev.off()
bitmap(file='test7.png')
pacf(mysum$resid, lag.max=length(mysum$resid)/2, main='Residual Partial Autocorrelation Function')
grid()
dev.off()
bitmap(file='test8.png')
opar <- par(mfrow = c(2,2), oma = c(0, 0, 1.1, 0))
plot(mylm, las = 1, sub='Residual Diagnostics')
par(opar)
dev.off()
if (n > n25) {
bitmap(file='test9.png')
plot(kp3:nmkm3,gqarr[,2], main='Goldfeld-Quandt test',ylab='2-sided p-value',xlab='breakpoint')
grid()
dev.off()
}
load(file='createtable')
a<-table.start()
a<-table.row.start(a)
a<-table.element(a, 'Multiple Linear Regression - Estimated Regression Equation', 1, TRUE)
a<-table.row.end(a)
myeq <- colnames(x)[1]
myeq <- paste(myeq, '[t] = ', sep='')
for (i in 1:k){
if (mysum$coefficients[i,1] > 0) myeq <- paste(myeq, '+', '')
myeq <- paste(myeq, mysum$coefficients[i,1], sep=' ')
if (rownames(mysum$coefficients)[i] != '(Intercept)') {
myeq <- paste(myeq, rownames(mysum$coefficients)[i], sep='')
if (rownames(mysum$coefficients)[i] != 't') myeq <- paste(myeq, '[t]', sep='')
}
}
myeq <- paste(myeq, ' + e[t]')
a<-table.row.start(a)
a<-table.element(a, myeq)
a<-table.row.end(a)
a<-table.end(a)
table.save(a,file='mytable1.tab')
a<-table.start()
a<-table.row.start(a)
a<-table.element(a,hyperlink('ols1.htm','Multiple Linear Regression - Ordinary Least Squares',''), 6, TRUE)
a<-table.row.end(a)
a<-table.row.start(a)
a<-table.element(a,'Variable',header=TRUE)
a<-table.element(a,'Parameter',header=TRUE)
a<-table.element(a,'S.D.',header=TRUE)
a<-table.element(a,'T-STAT
H0: parameter = 0',header=TRUE)
a<-table.element(a,'2-tail p-value',header=TRUE)
a<-table.element(a,'1-tail p-value',header=TRUE)
a<-table.row.end(a)
for (i in 1:k){
a<-table.row.start(a)
a<-table.element(a,rownames(mysum$coefficients)[i],header=TRUE)
a<-table.element(a,mysum$coefficients[i,1])
a<-table.element(a, round(mysum$coefficients[i,2],6))
a<-table.element(a, round(mysum$coefficients[i,3],4))
a<-table.element(a, round(mysum$coefficients[i,4],6))
a<-table.element(a, round(mysum$coefficients[i,4]/2,6))
a<-table.row.end(a)
}
a<-table.end(a)
table.save(a,file='mytable2.tab')
a<-table.start()
a<-table.row.start(a)
a<-table.element(a, 'Multiple Linear Regression - Regression Statistics', 2, TRUE)
a<-table.row.end(a)
a<-table.row.start(a)
a<-table.element(a, 'Multiple R',1,TRUE)
a<-table.element(a, sqrt(mysum$r.squared))
a<-table.row.end(a)
a<-table.row.start(a)
a<-table.element(a, 'R-squared',1,TRUE)
a<-table.element(a, mysum$r.squared)
a<-table.row.end(a)
a<-table.row.start(a)
a<-table.element(a, 'Adjusted R-squared',1,TRUE)
a<-table.element(a, mysum$adj.r.squared)
a<-table.row.end(a)
a<-table.row.start(a)
a<-table.element(a, 'F-TEST (value)',1,TRUE)
a<-table.element(a, mysum$fstatistic[1])
a<-table.row.end(a)
a<-table.row.start(a)
a<-table.element(a, 'F-TEST (DF numerator)',1,TRUE)
a<-table.element(a, mysum$fstatistic[2])
a<-table.row.end(a)
a<-table.row.start(a)
a<-table.element(a, 'F-TEST (DF denominator)',1,TRUE)
a<-table.element(a, mysum$fstatistic[3])
a<-table.row.end(a)
a<-table.row.start(a)
a<-table.element(a, 'p-value',1,TRUE)
a<-table.element(a, 1-pf(mysum$fstatistic[1],mysum$fstatistic[2],mysum$fstatistic[3]))
a<-table.row.end(a)
a<-table.row.start(a)
a<-table.element(a, 'Multiple Linear Regression - Residual Statistics', 2, TRUE)
a<-table.row.end(a)
a<-table.row.start(a)
a<-table.element(a, 'Residual Standard Deviation',1,TRUE)
a<-table.element(a, mysum$sigma)
a<-table.row.end(a)
a<-table.row.start(a)
a<-table.element(a, 'Sum Squared Residuals',1,TRUE)
a<-table.element(a, sum(myerror*myerror))
a<-table.row.end(a)
a<-table.end(a)
table.save(a,file='mytable3.tab')
a<-table.start()
a<-table.row.start(a)
a<-table.element(a, 'Multiple Linear Regression - Actuals, Interpolation, and Residuals', 4, TRUE)
a<-table.row.end(a)
a<-table.row.start(a)
a<-table.element(a, 'Time or Index', 1, TRUE)
a<-table.element(a, 'Actuals', 1, TRUE)
a<-table.element(a, 'Interpolation
Forecast', 1, TRUE)
a<-table.element(a, 'Residuals
Prediction Error', 1, TRUE)
a<-table.row.end(a)
for (i in 1:n) {
a<-table.row.start(a)
a<-table.element(a,i, 1, TRUE)
a<-table.element(a,x[i])
a<-table.element(a,x[i]-mysum$resid[i])
a<-table.element(a,mysum$resid[i])
a<-table.row.end(a)
}
a<-table.end(a)
table.save(a,file='mytable4.tab')
if (n > n25) {
a<-table.start()
a<-table.row.start(a)
a<-table.element(a,'Goldfeld-Quandt test for Heteroskedasticity',4,TRUE)
a<-table.row.end(a)
a<-table.row.start(a)
a<-table.element(a,'p-values',header=TRUE)
a<-table.element(a,'Alternative Hypothesis',3,header=TRUE)
a<-table.row.end(a)
a<-table.row.start(a)
a<-table.element(a,'breakpoint index',header=TRUE)
a<-table.element(a,'greater',header=TRUE)
a<-table.element(a,'2-sided',header=TRUE)
a<-table.element(a,'less',header=TRUE)
a<-table.row.end(a)
for (mypoint in kp3:nmkm3) {
a<-table.row.start(a)
a<-table.element(a,mypoint,header=TRUE)
a<-table.element(a,gqarr[mypoint-kp3+1,1])
a<-table.element(a,gqarr[mypoint-kp3+1,2])
a<-table.element(a,gqarr[mypoint-kp3+1,3])
a<-table.row.end(a)
}
a<-table.end(a)
table.save(a,file='mytable5.tab')
a<-table.start()
a<-table.row.start(a)
a<-table.element(a,'Meta Analysis of Goldfeld-Quandt test for Heteroskedasticity',4,TRUE)
a<-table.row.end(a)
a<-table.row.start(a)
a<-table.element(a,'Description',header=TRUE)
a<-table.element(a,'# significant tests',header=TRUE)
a<-table.element(a,'% significant tests',header=TRUE)
a<-table.element(a,'OK/NOK',header=TRUE)
a<-table.row.end(a)
a<-table.row.start(a)
a<-table.element(a,'1% type I error level',header=TRUE)
a<-table.element(a,numsignificant1)
a<-table.element(a,numsignificant1/numgqtests)
if (numsignificant1/numgqtests < 0.01) dum <- 'OK' else dum <- 'NOK'
a<-table.element(a,dum)
a<-table.row.end(a)
a<-table.row.start(a)
a<-table.element(a,'5% type I error level',header=TRUE)
a<-table.element(a,numsignificant5)
a<-table.element(a,numsignificant5/numgqtests)
if (numsignificant5/numgqtests < 0.05) dum <- 'OK' else dum <- 'NOK'
a<-table.element(a,dum)
a<-table.row.end(a)
a<-table.row.start(a)
a<-table.element(a,'10% type I error level',header=TRUE)
a<-table.element(a,numsignificant10)
a<-table.element(a,numsignificant10/numgqtests)
if (numsignificant10/numgqtests < 0.1) dum <- 'OK' else dum <- 'NOK'
a<-table.element(a,dum)
a<-table.row.end(a)
a<-table.end(a)
table.save(a,file='mytable6.tab')
}