Free Statistics

of Irreproducible Research!

Author's title

Author*The author of this computation has been verified*
R Software Modulerwasp_multipleregression.wasp
Title produced by softwareMultiple Regression
Date of computationWed, 26 Nov 2008 13:40:08 -0700
Cite this page as followsStatistical Computations at FreeStatistics.org, Office for Research Development and Education, URL https://freestatistics.org/blog/index.php?v=date/2008/Nov/26/t1227732225ag0tardrdu1u9kk.htm/, Retrieved Sun, 19 May 2024 07:49:56 +0000
Statistical Computations at FreeStatistics.org, Office for Research Development and Education, URL https://freestatistics.org/blog/index.php?pk=25713, Retrieved Sun, 19 May 2024 07:49:56 +0000
QR Codes:

Original text written by user:
IsPrivate?No (this computation is public)
User-defined keywordsQ3 zonder dummies
Estimated Impact165
Family? (F = Feedback message, R = changed R code, M = changed R Module, P = changed Parameters, D = changed Data)
F       [Multiple Regression] [Seatbelt Law] [2008-11-26 20:40:08] [da22167fec87ac24b182b1311f73761c] [Current]
-  M      [Multiple Regression] [] [2009-11-18 12:31:13] [072df11bdb18ed8d65d8164df87f26f2]
Feedback Forum
2008-11-30 09:46:26 [Maarten Van Gucht] [reply
de student heeft Q3 en Q4 gesplits, maar dit moest niet. Het behoort tot 1 oefening. Ik ga ze daarom ook tot 1 geheel verbeteren.
Om onze tijdreeks te kunnen uitleggen / verklaren moeten we bij de berekening
rekening houden met seasonal dummies (monthly) en een linear trend.
De student zegt de ene keer dat het een significant verschil heeft, en de andere keer niet. dit klopt niet. in de tabel kun je zien dat de p-waarde 0 is .. dus Dit wil zeggen dat onze bevindingen toeval kunnen zijn. Als we een alfa fout van 5% nemen, kunnen we stellen dat er geen significant verschil is en dat we het effect van onze gebeurtenis aan het toeval kunnen toeschrijven. We kunnen dus besluiten dat we de nulhypothese aanvaarden.
Null – hypothese: we stellen de parameters gelijk aan nul, dwz dat de gebeurtenis geen effect heeft op het indexcijfer, tenzij het tegendeel bewezen wordt.

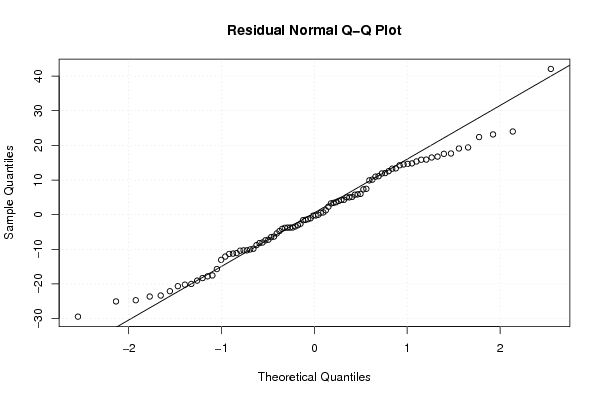
Het model is nog niet helemaal in orde. Om aan de assumpties te voldoen:
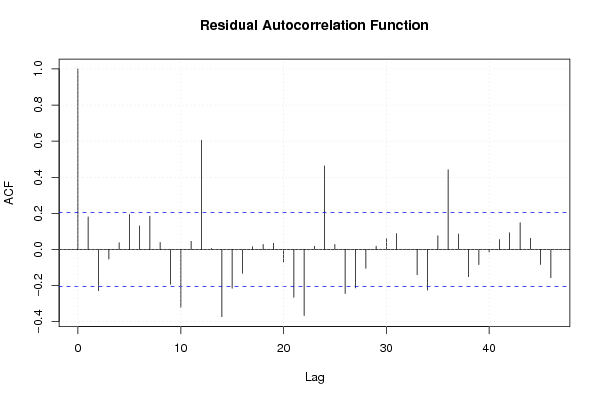
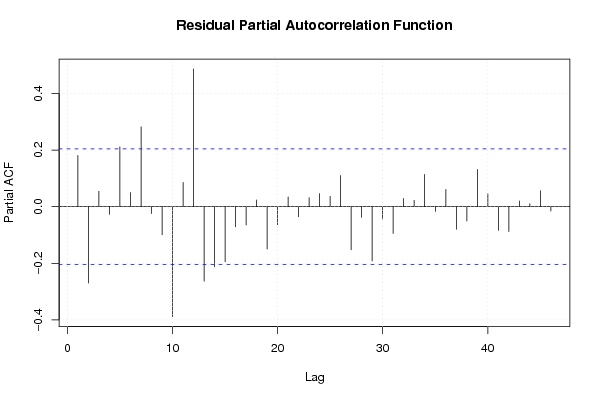
mag er geen patroon of geen autocorrelatie zijn. Aan deze assumptie is voldaan (grafiek 7)
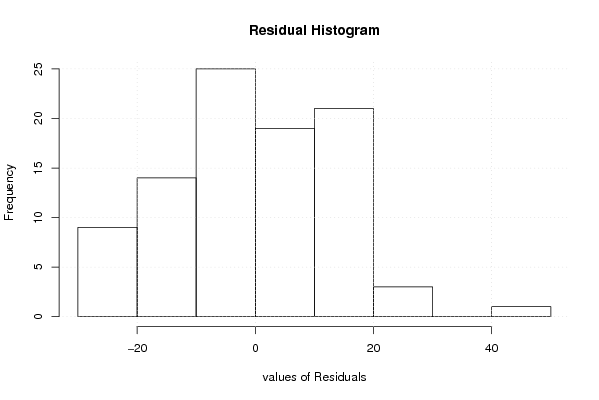
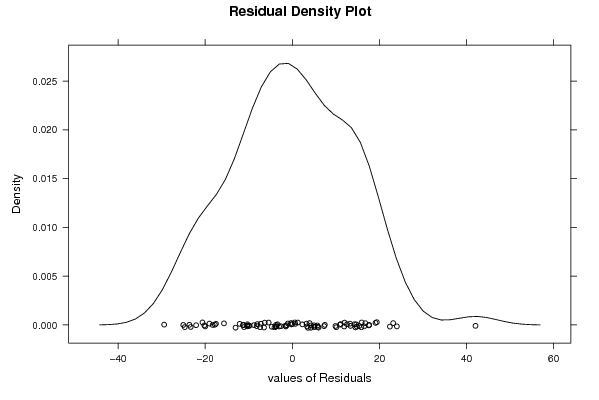
moet het gemiddelde constant en nul zijn. Aan deze assumptie is niet voldaan (grafiek 2)
2008-12-01 11:10:23 [Li Tang Hu] [reply
vraag 3 heeft de student in 2 delen gesplitst. het eerste zijnde zonder dummies en trend. dit is geen goed model, want slechts 8% kan hiermee veklaard worden (Adjusted R-squared 0.0808030057259546)
volgende deel is vraag 4 bij de student (comment zie bij bijhorende URL van de student)

Post a new message
Dataseries X:
98,5	0
96,7	0
113,1	0
100	0
104,7	0
108,5	0
90,5	0
88,6	0
105,4	0
119,9	0
107,2	0
84,1	0
101,4	0
105,1	0
118,7	0
113,8	0
113,8	0
118,9	0
98,5	0
91	0
120,7	0
127,9	0
112,4	0
93,1	0
107,5	0
107,3	0
114,8	0
120,8	0
112,2	0
123,3	0
100,6	0
86,7	0
123,6	0
125,3	0
111,1	0
98,4	0
102,3	0
105	0
128,2	0
124,7	0
116,1	0
131,2	0
97,7	0
88,8	0
132,8	0
113,9	0
112,6	1
104,3	1
107,5	1
106	1
117,3	1
123,1	1
114,3	1
132	1
92,3	1
93,7	1
121,3	1
113,6	1
116,3	1
98,3	1
111,9	1
109,3	1
133,2	1
118	1
131,6	1
134,1	1
96,7	1
99,8	1
128,3	1
134,9	1
130,7	1
107,3	1
121,6	1
120,6	1
140,5	1
124,8	1
129,9	1
159,4	1
111	1
110,1	1
132,7	1
135	1
118,6	1
94	1
117,9	1
114,7	1
113,6	1
130,6	1
117,1	1
123,2	1
106,1	1
87,9	1


Summary of computational transaction
Raw Inputview raw input (R code)
Raw Outputview raw output of R engine
Computing time6 seconds
R Server'Sir Ronald Aylmer Fisher' @ 193.190.124.24

\begin{tabular}{lllllllll}
\hline
Summary of computational transaction \tabularnewline
Raw Input & view raw input (R code)  \tabularnewline
Raw Output & view raw output of R engine  \tabularnewline
Computing time & 6 seconds \tabularnewline
R Server & 'Sir Ronald Aylmer Fisher' @ 193.190.124.24 \tabularnewline
\hline
\end{tabular}
%Source: https://freestatistics.org/blog/index.php?pk=25713&T=0

[TABLE]
[ROW][C]Summary of computational transaction[/C][/ROW]
[ROW][C]Raw Input[/C][C]view raw input (R code) [/C][/ROW]
[ROW][C]Raw Output[/C][C]view raw output of R engine [/C][/ROW]
[ROW][C]Computing time[/C][C]6 seconds[/C][/ROW]
[ROW][C]R Server[/C][C]'Sir Ronald Aylmer Fisher' @ 193.190.124.24[/C][/ROW]
[/TABLE]
Source: https://freestatistics.org/blog/index.php?pk=25713&T=0

Globally Unique Identifier (entire table): ba.freestatistics.org/blog/index.php?pk=25713&T=0

As an alternative you can also use a QR Code:  

The GUIDs for individual cells are displayed in the table below:

Summary of computational transaction
Raw Inputview raw input (R code)
Raw Outputview raw output of R engine
Computing time6 seconds
R Server'Sir Ronald Aylmer Fisher' @ 193.190.124.24


Multiple Linear Regression - Estimated Regression Equation
Y[t] = + 108.8 + 8.54130434782609X[t] + e[t]

\begin{tabular}{lllllllll}
\hline
Multiple Linear Regression - Estimated Regression Equation \tabularnewline
Y[t] =  +  108.8 +  8.54130434782609X[t]  + e[t] \tabularnewline
\hline
\end{tabular}
%Source: https://freestatistics.org/blog/index.php?pk=25713&T=1

[TABLE]
[ROW][C]Multiple Linear Regression - Estimated Regression Equation[/C][/ROW]
[ROW][C]Y[t] =  +  108.8 +  8.54130434782609X[t]  + e[t][/C][/ROW]
[/TABLE]
Source: https://freestatistics.org/blog/index.php?pk=25713&T=1

Globally Unique Identifier (entire table): ba.freestatistics.org/blog/index.php?pk=25713&T=1

As an alternative you can also use a QR Code:  

The GUIDs for individual cells are displayed in the table below:

Multiple Linear Regression - Estimated Regression Equation
Y[t] = + 108.8 + 8.54130434782609X[t] + e[t]


Multiple Linear Regression - Ordinary Least Squares
VariableParameterS.D.T-STATH0: parameter = 02-tail p-value1-tail p-value
(Intercept)108.82.01326654.041500
X8.541304347826092.8471882.99990.0034930.001746

\begin{tabular}{lllllllll}
\hline
Multiple Linear Regression - Ordinary Least Squares \tabularnewline
Variable & Parameter & S.D. & T-STATH0: parameter = 0 & 2-tail p-value & 1-tail p-value \tabularnewline
(Intercept) & 108.8 & 2.013266 & 54.0415 & 0 & 0 \tabularnewline
X & 8.54130434782609 & 2.847188 & 2.9999 & 0.003493 & 0.001746 \tabularnewline
\hline
\end{tabular}
%Source: https://freestatistics.org/blog/index.php?pk=25713&T=2

[TABLE]
[ROW][C]Multiple Linear Regression - Ordinary Least Squares[/C][/ROW]
[ROW][C]Variable[/C][C]Parameter[/C][C]S.D.[/C][C]T-STATH0: parameter = 0[/C][C]2-tail p-value[/C][C]1-tail p-value[/C][/ROW]
[ROW][C](Intercept)[/C][C]108.8[/C][C]2.013266[/C][C]54.0415[/C][C]0[/C][C]0[/C][/ROW]
[ROW][C]X[/C][C]8.54130434782609[/C][C]2.847188[/C][C]2.9999[/C][C]0.003493[/C][C]0.001746[/C][/ROW]
[/TABLE]
Source: https://freestatistics.org/blog/index.php?pk=25713&T=2

Globally Unique Identifier (entire table): ba.freestatistics.org/blog/index.php?pk=25713&T=2

As an alternative you can also use a QR Code:  

The GUIDs for individual cells are displayed in the table below:

Multiple Linear Regression - Ordinary Least Squares
VariableParameterS.D.T-STATH0: parameter = 02-tail p-value1-tail p-value
(Intercept)108.82.01326654.041500
X8.541304347826092.8471882.99990.0034930.001746


Multiple Linear Regression - Regression Statistics
Multiple R0.301503020875576
R-squared0.0909040715970979
Adjusted R-squared0.0808030057259546
F-TEST (value)8.99945339994187
F-TEST (DF numerator)1
F-TEST (DF denominator)90
p-value0.00349286262717896
Multiple Linear Regression - Residual Statistics
Residual Standard Deviation13.6546335325490
Sum Squared Residuals16780.4115217391

\begin{tabular}{lllllllll}
\hline
Multiple Linear Regression - Regression Statistics \tabularnewline
Multiple R & 0.301503020875576 \tabularnewline
R-squared & 0.0909040715970979 \tabularnewline
Adjusted R-squared & 0.0808030057259546 \tabularnewline
F-TEST (value) & 8.99945339994187 \tabularnewline
F-TEST (DF numerator) & 1 \tabularnewline
F-TEST (DF denominator) & 90 \tabularnewline
p-value & 0.00349286262717896 \tabularnewline
Multiple Linear Regression - Residual Statistics \tabularnewline
Residual Standard Deviation & 13.6546335325490 \tabularnewline
Sum Squared Residuals & 16780.4115217391 \tabularnewline
\hline
\end{tabular}
%Source: https://freestatistics.org/blog/index.php?pk=25713&T=3

[TABLE]
[ROW][C]Multiple Linear Regression - Regression Statistics[/C][/ROW]
[ROW][C]Multiple R[/C][C]0.301503020875576[/C][/ROW]
[ROW][C]R-squared[/C][C]0.0909040715970979[/C][/ROW]
[ROW][C]Adjusted R-squared[/C][C]0.0808030057259546[/C][/ROW]
[ROW][C]F-TEST (value)[/C][C]8.99945339994187[/C][/ROW]
[ROW][C]F-TEST (DF numerator)[/C][C]1[/C][/ROW]
[ROW][C]F-TEST (DF denominator)[/C][C]90[/C][/ROW]
[ROW][C]p-value[/C][C]0.00349286262717896[/C][/ROW]
[ROW][C]Multiple Linear Regression - Residual Statistics[/C][/ROW]
[ROW][C]Residual Standard Deviation[/C][C]13.6546335325490[/C][/ROW]
[ROW][C]Sum Squared Residuals[/C][C]16780.4115217391[/C][/ROW]
[/TABLE]
Source: https://freestatistics.org/blog/index.php?pk=25713&T=3

Globally Unique Identifier (entire table): ba.freestatistics.org/blog/index.php?pk=25713&T=3

As an alternative you can also use a QR Code:  

The GUIDs for individual cells are displayed in the table below:

Multiple Linear Regression - Regression Statistics
Multiple R0.301503020875576
R-squared0.0909040715970979
Adjusted R-squared0.0808030057259546
F-TEST (value)8.99945339994187
F-TEST (DF numerator)1
F-TEST (DF denominator)90
p-value0.00349286262717896
Multiple Linear Regression - Residual Statistics
Residual Standard Deviation13.6546335325490
Sum Squared Residuals16780.4115217391


Multiple Linear Regression - Actuals, Interpolation, and Residuals
Time or IndexActualsInterpolationForecastResidualsPrediction Error
198.5108.8-10.3000000000001
296.7108.8-12.1
3113.1108.84.3
4100108.8-8.8
5104.7108.8-4.1
6108.5108.8-0.299999999999998
790.5108.8-18.3
888.6108.8-20.2
9105.4108.8-3.39999999999999
10119.9108.811.1
11107.2108.8-1.60000000000000
1284.1108.8-24.7
13101.4108.8-7.4
14105.1108.8-3.70000000000000
15118.7108.89.9
16113.8108.85
17113.8108.85
18118.9108.810.1
1998.5108.8-10.3
2091108.8-17.8
21120.7108.811.9
22127.9108.819.1
23112.4108.83.60000000000001
2493.1108.8-15.7
25107.5108.8-1.30000000000000
26107.3108.8-1.5
27114.8108.86
28120.8108.812
29112.2108.83.40000000000000
30123.3108.814.5
31100.6108.8-8.2
3286.7108.8-22.1
33123.6108.814.8
34125.3108.816.5
35111.1108.82.30000000000000
3698.4108.8-10.4
37102.3108.8-6.5
38105108.8-3.8
39128.2108.819.4
40124.7108.815.9
41116.1108.87.3
42131.2108.822.4
4397.7108.8-11.1
4488.8108.8-20
45132.8108.824
46113.9108.85.10000000000001
47112.6117.341304347826-4.74130434782609
48104.3117.341304347826-13.0413043478261
49107.5117.341304347826-9.84130434782609
50106117.341304347826-11.3413043478261
51117.3117.341304347826-0.0413043478260883
52123.1117.3413043478265.75869565217391
53114.3117.341304347826-3.04130434782609
54132117.34130434782614.6586956521739
5592.3117.341304347826-25.0413043478261
5693.7117.341304347826-23.6413043478261
57121.3117.3413043478263.95869565217391
58113.6117.341304347826-3.74130434782609
59116.3117.341304347826-1.04130434782609
6098.3117.341304347826-19.0413043478261
61111.9117.341304347826-5.44130434782608
62109.3117.341304347826-8.04130434782609
63133.2117.34130434782615.8586956521739
64118117.3413043478260.658695652173915
65131.6117.34130434782614.2586956521739
66134.1117.34130434782616.7586956521739
6796.7117.341304347826-20.6413043478261
6899.8117.341304347826-17.5413043478261
69128.3117.34130434782610.9586956521739
70134.9117.34130434782617.5586956521739
71130.7117.34130434782613.3586956521739
72107.3117.341304347826-10.0413043478261
73121.6117.3413043478264.25869565217391
74120.6117.3413043478263.25869565217391
75140.5117.34130434782623.1586956521739
76124.8117.3413043478267.45869565217391
77129.9117.34130434782612.5586956521739
78159.4117.34130434782642.0586956521739
79111117.341304347826-6.34130434782609
80110.1117.341304347826-7.24130434782609
81132.7117.34130434782615.3586956521739
82135117.34130434782617.6586956521739
83118.6117.3413043478261.25869565217391
8494117.341304347826-23.3413043478261
85117.9117.3413043478260.55869565217392
86114.7117.341304347826-2.64130434782608
87113.6117.341304347826-3.74130434782609
88130.6117.34130434782613.2586956521739
89117.1117.341304347826-0.241304347826091
90123.2117.3413043478265.85869565217392
91106.1117.341304347826-11.2413043478261
9287.9117.341304347826-29.4413043478261

\begin{tabular}{lllllllll}
\hline
Multiple Linear Regression - Actuals, Interpolation, and Residuals \tabularnewline
Time or Index & Actuals & InterpolationForecast & ResidualsPrediction Error \tabularnewline
1 & 98.5 & 108.8 & -10.3000000000001 \tabularnewline
2 & 96.7 & 108.8 & -12.1 \tabularnewline
3 & 113.1 & 108.8 & 4.3 \tabularnewline
4 & 100 & 108.8 & -8.8 \tabularnewline
5 & 104.7 & 108.8 & -4.1 \tabularnewline
6 & 108.5 & 108.8 & -0.299999999999998 \tabularnewline
7 & 90.5 & 108.8 & -18.3 \tabularnewline
8 & 88.6 & 108.8 & -20.2 \tabularnewline
9 & 105.4 & 108.8 & -3.39999999999999 \tabularnewline
10 & 119.9 & 108.8 & 11.1 \tabularnewline
11 & 107.2 & 108.8 & -1.60000000000000 \tabularnewline
12 & 84.1 & 108.8 & -24.7 \tabularnewline
13 & 101.4 & 108.8 & -7.4 \tabularnewline
14 & 105.1 & 108.8 & -3.70000000000000 \tabularnewline
15 & 118.7 & 108.8 & 9.9 \tabularnewline
16 & 113.8 & 108.8 & 5 \tabularnewline
17 & 113.8 & 108.8 & 5 \tabularnewline
18 & 118.9 & 108.8 & 10.1 \tabularnewline
19 & 98.5 & 108.8 & -10.3 \tabularnewline
20 & 91 & 108.8 & -17.8 \tabularnewline
21 & 120.7 & 108.8 & 11.9 \tabularnewline
22 & 127.9 & 108.8 & 19.1 \tabularnewline
23 & 112.4 & 108.8 & 3.60000000000001 \tabularnewline
24 & 93.1 & 108.8 & -15.7 \tabularnewline
25 & 107.5 & 108.8 & -1.30000000000000 \tabularnewline
26 & 107.3 & 108.8 & -1.5 \tabularnewline
27 & 114.8 & 108.8 & 6 \tabularnewline
28 & 120.8 & 108.8 & 12 \tabularnewline
29 & 112.2 & 108.8 & 3.40000000000000 \tabularnewline
30 & 123.3 & 108.8 & 14.5 \tabularnewline
31 & 100.6 & 108.8 & -8.2 \tabularnewline
32 & 86.7 & 108.8 & -22.1 \tabularnewline
33 & 123.6 & 108.8 & 14.8 \tabularnewline
34 & 125.3 & 108.8 & 16.5 \tabularnewline
35 & 111.1 & 108.8 & 2.30000000000000 \tabularnewline
36 & 98.4 & 108.8 & -10.4 \tabularnewline
37 & 102.3 & 108.8 & -6.5 \tabularnewline
38 & 105 & 108.8 & -3.8 \tabularnewline
39 & 128.2 & 108.8 & 19.4 \tabularnewline
40 & 124.7 & 108.8 & 15.9 \tabularnewline
41 & 116.1 & 108.8 & 7.3 \tabularnewline
42 & 131.2 & 108.8 & 22.4 \tabularnewline
43 & 97.7 & 108.8 & -11.1 \tabularnewline
44 & 88.8 & 108.8 & -20 \tabularnewline
45 & 132.8 & 108.8 & 24 \tabularnewline
46 & 113.9 & 108.8 & 5.10000000000001 \tabularnewline
47 & 112.6 & 117.341304347826 & -4.74130434782609 \tabularnewline
48 & 104.3 & 117.341304347826 & -13.0413043478261 \tabularnewline
49 & 107.5 & 117.341304347826 & -9.84130434782609 \tabularnewline
50 & 106 & 117.341304347826 & -11.3413043478261 \tabularnewline
51 & 117.3 & 117.341304347826 & -0.0413043478260883 \tabularnewline
52 & 123.1 & 117.341304347826 & 5.75869565217391 \tabularnewline
53 & 114.3 & 117.341304347826 & -3.04130434782609 \tabularnewline
54 & 132 & 117.341304347826 & 14.6586956521739 \tabularnewline
55 & 92.3 & 117.341304347826 & -25.0413043478261 \tabularnewline
56 & 93.7 & 117.341304347826 & -23.6413043478261 \tabularnewline
57 & 121.3 & 117.341304347826 & 3.95869565217391 \tabularnewline
58 & 113.6 & 117.341304347826 & -3.74130434782609 \tabularnewline
59 & 116.3 & 117.341304347826 & -1.04130434782609 \tabularnewline
60 & 98.3 & 117.341304347826 & -19.0413043478261 \tabularnewline
61 & 111.9 & 117.341304347826 & -5.44130434782608 \tabularnewline
62 & 109.3 & 117.341304347826 & -8.04130434782609 \tabularnewline
63 & 133.2 & 117.341304347826 & 15.8586956521739 \tabularnewline
64 & 118 & 117.341304347826 & 0.658695652173915 \tabularnewline
65 & 131.6 & 117.341304347826 & 14.2586956521739 \tabularnewline
66 & 134.1 & 117.341304347826 & 16.7586956521739 \tabularnewline
67 & 96.7 & 117.341304347826 & -20.6413043478261 \tabularnewline
68 & 99.8 & 117.341304347826 & -17.5413043478261 \tabularnewline
69 & 128.3 & 117.341304347826 & 10.9586956521739 \tabularnewline
70 & 134.9 & 117.341304347826 & 17.5586956521739 \tabularnewline
71 & 130.7 & 117.341304347826 & 13.3586956521739 \tabularnewline
72 & 107.3 & 117.341304347826 & -10.0413043478261 \tabularnewline
73 & 121.6 & 117.341304347826 & 4.25869565217391 \tabularnewline
74 & 120.6 & 117.341304347826 & 3.25869565217391 \tabularnewline
75 & 140.5 & 117.341304347826 & 23.1586956521739 \tabularnewline
76 & 124.8 & 117.341304347826 & 7.45869565217391 \tabularnewline
77 & 129.9 & 117.341304347826 & 12.5586956521739 \tabularnewline
78 & 159.4 & 117.341304347826 & 42.0586956521739 \tabularnewline
79 & 111 & 117.341304347826 & -6.34130434782609 \tabularnewline
80 & 110.1 & 117.341304347826 & -7.24130434782609 \tabularnewline
81 & 132.7 & 117.341304347826 & 15.3586956521739 \tabularnewline
82 & 135 & 117.341304347826 & 17.6586956521739 \tabularnewline
83 & 118.6 & 117.341304347826 & 1.25869565217391 \tabularnewline
84 & 94 & 117.341304347826 & -23.3413043478261 \tabularnewline
85 & 117.9 & 117.341304347826 & 0.55869565217392 \tabularnewline
86 & 114.7 & 117.341304347826 & -2.64130434782608 \tabularnewline
87 & 113.6 & 117.341304347826 & -3.74130434782609 \tabularnewline
88 & 130.6 & 117.341304347826 & 13.2586956521739 \tabularnewline
89 & 117.1 & 117.341304347826 & -0.241304347826091 \tabularnewline
90 & 123.2 & 117.341304347826 & 5.85869565217392 \tabularnewline
91 & 106.1 & 117.341304347826 & -11.2413043478261 \tabularnewline
92 & 87.9 & 117.341304347826 & -29.4413043478261 \tabularnewline
\hline
\end{tabular}
%Source: https://freestatistics.org/blog/index.php?pk=25713&T=4

[TABLE]
[ROW][C]Multiple Linear Regression - Actuals, Interpolation, and Residuals[/C][/ROW]
[ROW][C]Time or Index[/C][C]Actuals[/C][C]InterpolationForecast[/C][C]ResidualsPrediction Error[/C][/ROW]
[ROW][C]1[/C][C]98.5[/C][C]108.8[/C][C]-10.3000000000001[/C][/ROW]
[ROW][C]2[/C][C]96.7[/C][C]108.8[/C][C]-12.1[/C][/ROW]
[ROW][C]3[/C][C]113.1[/C][C]108.8[/C][C]4.3[/C][/ROW]
[ROW][C]4[/C][C]100[/C][C]108.8[/C][C]-8.8[/C][/ROW]
[ROW][C]5[/C][C]104.7[/C][C]108.8[/C][C]-4.1[/C][/ROW]
[ROW][C]6[/C][C]108.5[/C][C]108.8[/C][C]-0.299999999999998[/C][/ROW]
[ROW][C]7[/C][C]90.5[/C][C]108.8[/C][C]-18.3[/C][/ROW]
[ROW][C]8[/C][C]88.6[/C][C]108.8[/C][C]-20.2[/C][/ROW]
[ROW][C]9[/C][C]105.4[/C][C]108.8[/C][C]-3.39999999999999[/C][/ROW]
[ROW][C]10[/C][C]119.9[/C][C]108.8[/C][C]11.1[/C][/ROW]
[ROW][C]11[/C][C]107.2[/C][C]108.8[/C][C]-1.60000000000000[/C][/ROW]
[ROW][C]12[/C][C]84.1[/C][C]108.8[/C][C]-24.7[/C][/ROW]
[ROW][C]13[/C][C]101.4[/C][C]108.8[/C][C]-7.4[/C][/ROW]
[ROW][C]14[/C][C]105.1[/C][C]108.8[/C][C]-3.70000000000000[/C][/ROW]
[ROW][C]15[/C][C]118.7[/C][C]108.8[/C][C]9.9[/C][/ROW]
[ROW][C]16[/C][C]113.8[/C][C]108.8[/C][C]5[/C][/ROW]
[ROW][C]17[/C][C]113.8[/C][C]108.8[/C][C]5[/C][/ROW]
[ROW][C]18[/C][C]118.9[/C][C]108.8[/C][C]10.1[/C][/ROW]
[ROW][C]19[/C][C]98.5[/C][C]108.8[/C][C]-10.3[/C][/ROW]
[ROW][C]20[/C][C]91[/C][C]108.8[/C][C]-17.8[/C][/ROW]
[ROW][C]21[/C][C]120.7[/C][C]108.8[/C][C]11.9[/C][/ROW]
[ROW][C]22[/C][C]127.9[/C][C]108.8[/C][C]19.1[/C][/ROW]
[ROW][C]23[/C][C]112.4[/C][C]108.8[/C][C]3.60000000000001[/C][/ROW]
[ROW][C]24[/C][C]93.1[/C][C]108.8[/C][C]-15.7[/C][/ROW]
[ROW][C]25[/C][C]107.5[/C][C]108.8[/C][C]-1.30000000000000[/C][/ROW]
[ROW][C]26[/C][C]107.3[/C][C]108.8[/C][C]-1.5[/C][/ROW]
[ROW][C]27[/C][C]114.8[/C][C]108.8[/C][C]6[/C][/ROW]
[ROW][C]28[/C][C]120.8[/C][C]108.8[/C][C]12[/C][/ROW]
[ROW][C]29[/C][C]112.2[/C][C]108.8[/C][C]3.40000000000000[/C][/ROW]
[ROW][C]30[/C][C]123.3[/C][C]108.8[/C][C]14.5[/C][/ROW]
[ROW][C]31[/C][C]100.6[/C][C]108.8[/C][C]-8.2[/C][/ROW]
[ROW][C]32[/C][C]86.7[/C][C]108.8[/C][C]-22.1[/C][/ROW]
[ROW][C]33[/C][C]123.6[/C][C]108.8[/C][C]14.8[/C][/ROW]
[ROW][C]34[/C][C]125.3[/C][C]108.8[/C][C]16.5[/C][/ROW]
[ROW][C]35[/C][C]111.1[/C][C]108.8[/C][C]2.30000000000000[/C][/ROW]
[ROW][C]36[/C][C]98.4[/C][C]108.8[/C][C]-10.4[/C][/ROW]
[ROW][C]37[/C][C]102.3[/C][C]108.8[/C][C]-6.5[/C][/ROW]
[ROW][C]38[/C][C]105[/C][C]108.8[/C][C]-3.8[/C][/ROW]
[ROW][C]39[/C][C]128.2[/C][C]108.8[/C][C]19.4[/C][/ROW]
[ROW][C]40[/C][C]124.7[/C][C]108.8[/C][C]15.9[/C][/ROW]
[ROW][C]41[/C][C]116.1[/C][C]108.8[/C][C]7.3[/C][/ROW]
[ROW][C]42[/C][C]131.2[/C][C]108.8[/C][C]22.4[/C][/ROW]
[ROW][C]43[/C][C]97.7[/C][C]108.8[/C][C]-11.1[/C][/ROW]
[ROW][C]44[/C][C]88.8[/C][C]108.8[/C][C]-20[/C][/ROW]
[ROW][C]45[/C][C]132.8[/C][C]108.8[/C][C]24[/C][/ROW]
[ROW][C]46[/C][C]113.9[/C][C]108.8[/C][C]5.10000000000001[/C][/ROW]
[ROW][C]47[/C][C]112.6[/C][C]117.341304347826[/C][C]-4.74130434782609[/C][/ROW]
[ROW][C]48[/C][C]104.3[/C][C]117.341304347826[/C][C]-13.0413043478261[/C][/ROW]
[ROW][C]49[/C][C]107.5[/C][C]117.341304347826[/C][C]-9.84130434782609[/C][/ROW]
[ROW][C]50[/C][C]106[/C][C]117.341304347826[/C][C]-11.3413043478261[/C][/ROW]
[ROW][C]51[/C][C]117.3[/C][C]117.341304347826[/C][C]-0.0413043478260883[/C][/ROW]
[ROW][C]52[/C][C]123.1[/C][C]117.341304347826[/C][C]5.75869565217391[/C][/ROW]
[ROW][C]53[/C][C]114.3[/C][C]117.341304347826[/C][C]-3.04130434782609[/C][/ROW]
[ROW][C]54[/C][C]132[/C][C]117.341304347826[/C][C]14.6586956521739[/C][/ROW]
[ROW][C]55[/C][C]92.3[/C][C]117.341304347826[/C][C]-25.0413043478261[/C][/ROW]
[ROW][C]56[/C][C]93.7[/C][C]117.341304347826[/C][C]-23.6413043478261[/C][/ROW]
[ROW][C]57[/C][C]121.3[/C][C]117.341304347826[/C][C]3.95869565217391[/C][/ROW]
[ROW][C]58[/C][C]113.6[/C][C]117.341304347826[/C][C]-3.74130434782609[/C][/ROW]
[ROW][C]59[/C][C]116.3[/C][C]117.341304347826[/C][C]-1.04130434782609[/C][/ROW]
[ROW][C]60[/C][C]98.3[/C][C]117.341304347826[/C][C]-19.0413043478261[/C][/ROW]
[ROW][C]61[/C][C]111.9[/C][C]117.341304347826[/C][C]-5.44130434782608[/C][/ROW]
[ROW][C]62[/C][C]109.3[/C][C]117.341304347826[/C][C]-8.04130434782609[/C][/ROW]
[ROW][C]63[/C][C]133.2[/C][C]117.341304347826[/C][C]15.8586956521739[/C][/ROW]
[ROW][C]64[/C][C]118[/C][C]117.341304347826[/C][C]0.658695652173915[/C][/ROW]
[ROW][C]65[/C][C]131.6[/C][C]117.341304347826[/C][C]14.2586956521739[/C][/ROW]
[ROW][C]66[/C][C]134.1[/C][C]117.341304347826[/C][C]16.7586956521739[/C][/ROW]
[ROW][C]67[/C][C]96.7[/C][C]117.341304347826[/C][C]-20.6413043478261[/C][/ROW]
[ROW][C]68[/C][C]99.8[/C][C]117.341304347826[/C][C]-17.5413043478261[/C][/ROW]
[ROW][C]69[/C][C]128.3[/C][C]117.341304347826[/C][C]10.9586956521739[/C][/ROW]
[ROW][C]70[/C][C]134.9[/C][C]117.341304347826[/C][C]17.5586956521739[/C][/ROW]
[ROW][C]71[/C][C]130.7[/C][C]117.341304347826[/C][C]13.3586956521739[/C][/ROW]
[ROW][C]72[/C][C]107.3[/C][C]117.341304347826[/C][C]-10.0413043478261[/C][/ROW]
[ROW][C]73[/C][C]121.6[/C][C]117.341304347826[/C][C]4.25869565217391[/C][/ROW]
[ROW][C]74[/C][C]120.6[/C][C]117.341304347826[/C][C]3.25869565217391[/C][/ROW]
[ROW][C]75[/C][C]140.5[/C][C]117.341304347826[/C][C]23.1586956521739[/C][/ROW]
[ROW][C]76[/C][C]124.8[/C][C]117.341304347826[/C][C]7.45869565217391[/C][/ROW]
[ROW][C]77[/C][C]129.9[/C][C]117.341304347826[/C][C]12.5586956521739[/C][/ROW]
[ROW][C]78[/C][C]159.4[/C][C]117.341304347826[/C][C]42.0586956521739[/C][/ROW]
[ROW][C]79[/C][C]111[/C][C]117.341304347826[/C][C]-6.34130434782609[/C][/ROW]
[ROW][C]80[/C][C]110.1[/C][C]117.341304347826[/C][C]-7.24130434782609[/C][/ROW]
[ROW][C]81[/C][C]132.7[/C][C]117.341304347826[/C][C]15.3586956521739[/C][/ROW]
[ROW][C]82[/C][C]135[/C][C]117.341304347826[/C][C]17.6586956521739[/C][/ROW]
[ROW][C]83[/C][C]118.6[/C][C]117.341304347826[/C][C]1.25869565217391[/C][/ROW]
[ROW][C]84[/C][C]94[/C][C]117.341304347826[/C][C]-23.3413043478261[/C][/ROW]
[ROW][C]85[/C][C]117.9[/C][C]117.341304347826[/C][C]0.55869565217392[/C][/ROW]
[ROW][C]86[/C][C]114.7[/C][C]117.341304347826[/C][C]-2.64130434782608[/C][/ROW]
[ROW][C]87[/C][C]113.6[/C][C]117.341304347826[/C][C]-3.74130434782609[/C][/ROW]
[ROW][C]88[/C][C]130.6[/C][C]117.341304347826[/C][C]13.2586956521739[/C][/ROW]
[ROW][C]89[/C][C]117.1[/C][C]117.341304347826[/C][C]-0.241304347826091[/C][/ROW]
[ROW][C]90[/C][C]123.2[/C][C]117.341304347826[/C][C]5.85869565217392[/C][/ROW]
[ROW][C]91[/C][C]106.1[/C][C]117.341304347826[/C][C]-11.2413043478261[/C][/ROW]
[ROW][C]92[/C][C]87.9[/C][C]117.341304347826[/C][C]-29.4413043478261[/C][/ROW]
[/TABLE]
Source: https://freestatistics.org/blog/index.php?pk=25713&T=4

Globally Unique Identifier (entire table): ba.freestatistics.org/blog/index.php?pk=25713&T=4

As an alternative you can also use a QR Code:  

The GUIDs for individual cells are displayed in the table below:

Multiple Linear Regression - Actuals, Interpolation, and Residuals
Time or IndexActualsInterpolationForecastResidualsPrediction Error
198.5108.8-10.3000000000001
296.7108.8-12.1
3113.1108.84.3
4100108.8-8.8
5104.7108.8-4.1
6108.5108.8-0.299999999999998
790.5108.8-18.3
888.6108.8-20.2
9105.4108.8-3.39999999999999
10119.9108.811.1
11107.2108.8-1.60000000000000
1284.1108.8-24.7
13101.4108.8-7.4
14105.1108.8-3.70000000000000
15118.7108.89.9
16113.8108.85
17113.8108.85
18118.9108.810.1
1998.5108.8-10.3
2091108.8-17.8
21120.7108.811.9
22127.9108.819.1
23112.4108.83.60000000000001
2493.1108.8-15.7
25107.5108.8-1.30000000000000
26107.3108.8-1.5
27114.8108.86
28120.8108.812
29112.2108.83.40000000000000
30123.3108.814.5
31100.6108.8-8.2
3286.7108.8-22.1
33123.6108.814.8
34125.3108.816.5
35111.1108.82.30000000000000
3698.4108.8-10.4
37102.3108.8-6.5
38105108.8-3.8
39128.2108.819.4
40124.7108.815.9
41116.1108.87.3
42131.2108.822.4
4397.7108.8-11.1
4488.8108.8-20
45132.8108.824
46113.9108.85.10000000000001
47112.6117.341304347826-4.74130434782609
48104.3117.341304347826-13.0413043478261
49107.5117.341304347826-9.84130434782609
50106117.341304347826-11.3413043478261
51117.3117.341304347826-0.0413043478260883
52123.1117.3413043478265.75869565217391
53114.3117.341304347826-3.04130434782609
54132117.34130434782614.6586956521739
5592.3117.341304347826-25.0413043478261
5693.7117.341304347826-23.6413043478261
57121.3117.3413043478263.95869565217391
58113.6117.341304347826-3.74130434782609
59116.3117.341304347826-1.04130434782609
6098.3117.341304347826-19.0413043478261
61111.9117.341304347826-5.44130434782608
62109.3117.341304347826-8.04130434782609
63133.2117.34130434782615.8586956521739
64118117.3413043478260.658695652173915
65131.6117.34130434782614.2586956521739
66134.1117.34130434782616.7586956521739
6796.7117.341304347826-20.6413043478261
6899.8117.341304347826-17.5413043478261
69128.3117.34130434782610.9586956521739
70134.9117.34130434782617.5586956521739
71130.7117.34130434782613.3586956521739
72107.3117.341304347826-10.0413043478261
73121.6117.3413043478264.25869565217391
74120.6117.3413043478263.25869565217391
75140.5117.34130434782623.1586956521739
76124.8117.3413043478267.45869565217391
77129.9117.34130434782612.5586956521739
78159.4117.34130434782642.0586956521739
79111117.341304347826-6.34130434782609
80110.1117.341304347826-7.24130434782609
81132.7117.34130434782615.3586956521739
82135117.34130434782617.6586956521739
83118.6117.3413043478261.25869565217391
8494117.341304347826-23.3413043478261
85117.9117.3413043478260.55869565217392
86114.7117.341304347826-2.64130434782608
87113.6117.341304347826-3.74130434782609
88130.6117.34130434782613.2586956521739
89117.1117.341304347826-0.241304347826091
90123.2117.3413043478265.85869565217392
91106.1117.341304347826-11.2413043478261
9287.9117.341304347826-29.4413043478261


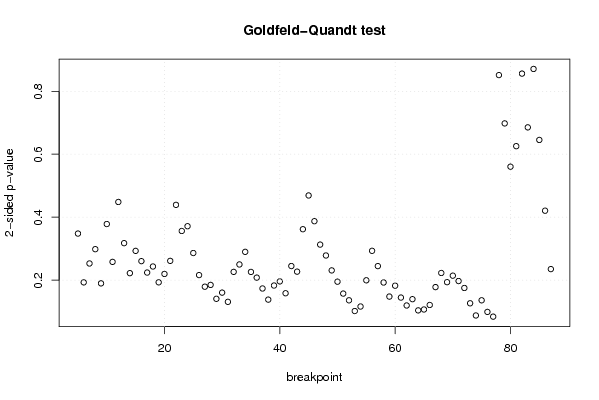
Goldfeld-Quandt test for Heteroskedasticity
p-valuesAlternative Hypothesis
breakpoint indexgreater2-sidedless
50.1740469289434830.3480938578869670.825953071056517
60.09653175632655980.1930635126531200.90346824367344
70.1265435599257660.2530871198515320.873456440074234
80.1492550595551770.2985101191103530.850744940444823
90.09497679438148010.1899535887629600.90502320561852
100.1891674161712380.3783348323424750.810832583828762
110.1290926722967640.2581853445935280.870907327703236
120.2242075009698550.4484150019397110.775792499030145
130.1587961852100580.3175923704201150.841203814789942
140.1111442550155120.2222885100310230.888855744984488
150.1465315777594460.2930631555188920.853468422240554
160.1302414602713870.2604829205427740.869758539728613
170.1121149543235160.2242299086470330.887885045676484
180.1217418040006380.2434836080012750.878258195999362
190.09660197324244880.1932039464848980.903398026757551
200.1099284332475290.2198568664950570.890071566752471
210.1306988594880260.2613977189760510.869301140511974
220.2196025241675240.4392050483350480.780397475832476
230.1781273024817590.3562546049635190.82187269751824
240.1856942851613630.3713885703227250.814305714838637
250.1431371968634200.2862743937268410.85686280313658
260.1081114906972150.2162229813944300.891888509302785
270.08963894154271840.1792778830854370.910361058457282
280.09249156821384250.1849831364276850.907508431786157
290.07043815397038160.1408763079407630.929561846029618
300.08023817700741840.1604763540148370.919761822992582
310.06561441933598430.1312288386719690.934385580664016
320.1131910462498120.2263820924996250.886808953750188
330.1249835719538950.2499671439077910.875016428046105
340.1450076433191590.2900152866383180.854992356680841
350.1131051765501780.2262103531003550.886894823449822
360.1040589608241410.2081179216482830.895941039175859
370.08683319429598140.1736663885919630.913166805704019
380.06910843291830810.1382168658366160.930891567081692
390.09151562431632840.1830312486326570.908484375683672
400.09809316200868880.1961863240173780.901906837991311
410.07925634931482520.1585126986296500.920743650685175
420.1224622239189220.2449244478378440.877537776081078
430.1135678130944900.2271356261889810.88643218690551
440.1809336275037050.3618672550074090.819066372496295
450.2345268715506960.4690537431013910.765473128449304
460.193658873281750.38731774656350.80634112671825
470.1565111016470590.3130222032941180.843488898352941
480.1392371137204560.2784742274409120.860762886279544
490.1155500760929800.2311001521859610.88444992390702
500.09762230343482110.1952446068696420.902377696565179
510.07872141948323820.1574428389664760.921278580516762
520.06807257796791440.1361451559358290.931927422032086
530.05100613592613390.1020122718522680.948993864073866
540.05819115358882480.1163823071776500.941808846411175
550.09984435023469940.1996887004693990.9001556497653
560.1466385586809780.2932771173619550.853361441319022
570.122393076615630.244786153231260.87760692338437
580.09633701601664280.1926740320332860.903662983983357
590.07397824386768710.1479564877353740.926021756132313
600.09126590045952840.1825318009190570.908734099540472
610.07240537622876680.1448107524575340.927594623771233
620.05984280253743330.1196856050748670.940157197462567
630.06983828747785170.1396765749557030.930161712522148
640.05207699290166170.1041539858033230.947923007098338
650.05346753773278010.1069350754655600.94653246226722
660.06063286543341250.1212657308668250.939367134566587
670.08902351798582930.1780470359716590.91097648201417
680.1114641224240790.2229282448481570.888535877575921
690.09688281322516770.1937656264503350.903117186774832
700.1071703717373470.2143407434746950.892829628262653
710.09865746514673350.1973149302934670.901342534853266
720.08762043885337580.1752408777067520.912379561146624
730.06333780154153090.1266756030830620.93666219845847
740.04398122312624450.0879624462524890.956018776873755
750.06808849638923330.1361769927784670.931911503610767
760.04964827586215150.0992965517243030.950351724137849
770.04210177561819790.08420355123639580.957898224381802
780.4256874262533810.8513748525067630.574312573746619
790.3489555801107830.6979111602215660.651044419889217
800.2802274868843040.5604549737686090.719772513115696
810.3127950228244130.6255900456488250.687204977175587
820.4280330494578810.8560660989157630.571966950542119
830.3426892985063920.6853785970127830.657310701493608
840.4354200943685150.870840188737030.564579905631485
850.3226940882106080.6453881764212160.677305911789392
860.2103421358931940.4206842717863880.789657864106806
870.1175911535654250.2351823071308510.882408846434575

\begin{tabular}{lllllllll}
\hline
Goldfeld-Quandt test for Heteroskedasticity \tabularnewline
p-values & Alternative Hypothesis \tabularnewline
breakpoint index & greater & 2-sided & less \tabularnewline
5 & 0.174046928943483 & 0.348093857886967 & 0.825953071056517 \tabularnewline
6 & 0.0965317563265598 & 0.193063512653120 & 0.90346824367344 \tabularnewline
7 & 0.126543559925766 & 0.253087119851532 & 0.873456440074234 \tabularnewline
8 & 0.149255059555177 & 0.298510119110353 & 0.850744940444823 \tabularnewline
9 & 0.0949767943814801 & 0.189953588762960 & 0.90502320561852 \tabularnewline
10 & 0.189167416171238 & 0.378334832342475 & 0.810832583828762 \tabularnewline
11 & 0.129092672296764 & 0.258185344593528 & 0.870907327703236 \tabularnewline
12 & 0.224207500969855 & 0.448415001939711 & 0.775792499030145 \tabularnewline
13 & 0.158796185210058 & 0.317592370420115 & 0.841203814789942 \tabularnewline
14 & 0.111144255015512 & 0.222288510031023 & 0.888855744984488 \tabularnewline
15 & 0.146531577759446 & 0.293063155518892 & 0.853468422240554 \tabularnewline
16 & 0.130241460271387 & 0.260482920542774 & 0.869758539728613 \tabularnewline
17 & 0.112114954323516 & 0.224229908647033 & 0.887885045676484 \tabularnewline
18 & 0.121741804000638 & 0.243483608001275 & 0.878258195999362 \tabularnewline
19 & 0.0966019732424488 & 0.193203946484898 & 0.903398026757551 \tabularnewline
20 & 0.109928433247529 & 0.219856866495057 & 0.890071566752471 \tabularnewline
21 & 0.130698859488026 & 0.261397718976051 & 0.869301140511974 \tabularnewline
22 & 0.219602524167524 & 0.439205048335048 & 0.780397475832476 \tabularnewline
23 & 0.178127302481759 & 0.356254604963519 & 0.82187269751824 \tabularnewline
24 & 0.185694285161363 & 0.371388570322725 & 0.814305714838637 \tabularnewline
25 & 0.143137196863420 & 0.286274393726841 & 0.85686280313658 \tabularnewline
26 & 0.108111490697215 & 0.216222981394430 & 0.891888509302785 \tabularnewline
27 & 0.0896389415427184 & 0.179277883085437 & 0.910361058457282 \tabularnewline
28 & 0.0924915682138425 & 0.184983136427685 & 0.907508431786157 \tabularnewline
29 & 0.0704381539703816 & 0.140876307940763 & 0.929561846029618 \tabularnewline
30 & 0.0802381770074184 & 0.160476354014837 & 0.919761822992582 \tabularnewline
31 & 0.0656144193359843 & 0.131228838671969 & 0.934385580664016 \tabularnewline
32 & 0.113191046249812 & 0.226382092499625 & 0.886808953750188 \tabularnewline
33 & 0.124983571953895 & 0.249967143907791 & 0.875016428046105 \tabularnewline
34 & 0.145007643319159 & 0.290015286638318 & 0.854992356680841 \tabularnewline
35 & 0.113105176550178 & 0.226210353100355 & 0.886894823449822 \tabularnewline
36 & 0.104058960824141 & 0.208117921648283 & 0.895941039175859 \tabularnewline
37 & 0.0868331942959814 & 0.173666388591963 & 0.913166805704019 \tabularnewline
38 & 0.0691084329183081 & 0.138216865836616 & 0.930891567081692 \tabularnewline
39 & 0.0915156243163284 & 0.183031248632657 & 0.908484375683672 \tabularnewline
40 & 0.0980931620086888 & 0.196186324017378 & 0.901906837991311 \tabularnewline
41 & 0.0792563493148252 & 0.158512698629650 & 0.920743650685175 \tabularnewline
42 & 0.122462223918922 & 0.244924447837844 & 0.877537776081078 \tabularnewline
43 & 0.113567813094490 & 0.227135626188981 & 0.88643218690551 \tabularnewline
44 & 0.180933627503705 & 0.361867255007409 & 0.819066372496295 \tabularnewline
45 & 0.234526871550696 & 0.469053743101391 & 0.765473128449304 \tabularnewline
46 & 0.19365887328175 & 0.3873177465635 & 0.80634112671825 \tabularnewline
47 & 0.156511101647059 & 0.313022203294118 & 0.843488898352941 \tabularnewline
48 & 0.139237113720456 & 0.278474227440912 & 0.860762886279544 \tabularnewline
49 & 0.115550076092980 & 0.231100152185961 & 0.88444992390702 \tabularnewline
50 & 0.0976223034348211 & 0.195244606869642 & 0.902377696565179 \tabularnewline
51 & 0.0787214194832382 & 0.157442838966476 & 0.921278580516762 \tabularnewline
52 & 0.0680725779679144 & 0.136145155935829 & 0.931927422032086 \tabularnewline
53 & 0.0510061359261339 & 0.102012271852268 & 0.948993864073866 \tabularnewline
54 & 0.0581911535888248 & 0.116382307177650 & 0.941808846411175 \tabularnewline
55 & 0.0998443502346994 & 0.199688700469399 & 0.9001556497653 \tabularnewline
56 & 0.146638558680978 & 0.293277117361955 & 0.853361441319022 \tabularnewline
57 & 0.12239307661563 & 0.24478615323126 & 0.87760692338437 \tabularnewline
58 & 0.0963370160166428 & 0.192674032033286 & 0.903662983983357 \tabularnewline
59 & 0.0739782438676871 & 0.147956487735374 & 0.926021756132313 \tabularnewline
60 & 0.0912659004595284 & 0.182531800919057 & 0.908734099540472 \tabularnewline
61 & 0.0724053762287668 & 0.144810752457534 & 0.927594623771233 \tabularnewline
62 & 0.0598428025374333 & 0.119685605074867 & 0.940157197462567 \tabularnewline
63 & 0.0698382874778517 & 0.139676574955703 & 0.930161712522148 \tabularnewline
64 & 0.0520769929016617 & 0.104153985803323 & 0.947923007098338 \tabularnewline
65 & 0.0534675377327801 & 0.106935075465560 & 0.94653246226722 \tabularnewline
66 & 0.0606328654334125 & 0.121265730866825 & 0.939367134566587 \tabularnewline
67 & 0.0890235179858293 & 0.178047035971659 & 0.91097648201417 \tabularnewline
68 & 0.111464122424079 & 0.222928244848157 & 0.888535877575921 \tabularnewline
69 & 0.0968828132251677 & 0.193765626450335 & 0.903117186774832 \tabularnewline
70 & 0.107170371737347 & 0.214340743474695 & 0.892829628262653 \tabularnewline
71 & 0.0986574651467335 & 0.197314930293467 & 0.901342534853266 \tabularnewline
72 & 0.0876204388533758 & 0.175240877706752 & 0.912379561146624 \tabularnewline
73 & 0.0633378015415309 & 0.126675603083062 & 0.93666219845847 \tabularnewline
74 & 0.0439812231262445 & 0.087962446252489 & 0.956018776873755 \tabularnewline
75 & 0.0680884963892333 & 0.136176992778467 & 0.931911503610767 \tabularnewline
76 & 0.0496482758621515 & 0.099296551724303 & 0.950351724137849 \tabularnewline
77 & 0.0421017756181979 & 0.0842035512363958 & 0.957898224381802 \tabularnewline
78 & 0.425687426253381 & 0.851374852506763 & 0.574312573746619 \tabularnewline
79 & 0.348955580110783 & 0.697911160221566 & 0.651044419889217 \tabularnewline
80 & 0.280227486884304 & 0.560454973768609 & 0.719772513115696 \tabularnewline
81 & 0.312795022824413 & 0.625590045648825 & 0.687204977175587 \tabularnewline
82 & 0.428033049457881 & 0.856066098915763 & 0.571966950542119 \tabularnewline
83 & 0.342689298506392 & 0.685378597012783 & 0.657310701493608 \tabularnewline
84 & 0.435420094368515 & 0.87084018873703 & 0.564579905631485 \tabularnewline
85 & 0.322694088210608 & 0.645388176421216 & 0.677305911789392 \tabularnewline
86 & 0.210342135893194 & 0.420684271786388 & 0.789657864106806 \tabularnewline
87 & 0.117591153565425 & 0.235182307130851 & 0.882408846434575 \tabularnewline
\hline
\end{tabular}
%Source: https://freestatistics.org/blog/index.php?pk=25713&T=5

[TABLE]
[ROW][C]Goldfeld-Quandt test for Heteroskedasticity[/C][/ROW]
[ROW][C]p-values[/C][C]Alternative Hypothesis[/C][/ROW]
[ROW][C]breakpoint index[/C][C]greater[/C][C]2-sided[/C][C]less[/C][/ROW]
[ROW][C]5[/C][C]0.174046928943483[/C][C]0.348093857886967[/C][C]0.825953071056517[/C][/ROW]
[ROW][C]6[/C][C]0.0965317563265598[/C][C]0.193063512653120[/C][C]0.90346824367344[/C][/ROW]
[ROW][C]7[/C][C]0.126543559925766[/C][C]0.253087119851532[/C][C]0.873456440074234[/C][/ROW]
[ROW][C]8[/C][C]0.149255059555177[/C][C]0.298510119110353[/C][C]0.850744940444823[/C][/ROW]
[ROW][C]9[/C][C]0.0949767943814801[/C][C]0.189953588762960[/C][C]0.90502320561852[/C][/ROW]
[ROW][C]10[/C][C]0.189167416171238[/C][C]0.378334832342475[/C][C]0.810832583828762[/C][/ROW]
[ROW][C]11[/C][C]0.129092672296764[/C][C]0.258185344593528[/C][C]0.870907327703236[/C][/ROW]
[ROW][C]12[/C][C]0.224207500969855[/C][C]0.448415001939711[/C][C]0.775792499030145[/C][/ROW]
[ROW][C]13[/C][C]0.158796185210058[/C][C]0.317592370420115[/C][C]0.841203814789942[/C][/ROW]
[ROW][C]14[/C][C]0.111144255015512[/C][C]0.222288510031023[/C][C]0.888855744984488[/C][/ROW]
[ROW][C]15[/C][C]0.146531577759446[/C][C]0.293063155518892[/C][C]0.853468422240554[/C][/ROW]
[ROW][C]16[/C][C]0.130241460271387[/C][C]0.260482920542774[/C][C]0.869758539728613[/C][/ROW]
[ROW][C]17[/C][C]0.112114954323516[/C][C]0.224229908647033[/C][C]0.887885045676484[/C][/ROW]
[ROW][C]18[/C][C]0.121741804000638[/C][C]0.243483608001275[/C][C]0.878258195999362[/C][/ROW]
[ROW][C]19[/C][C]0.0966019732424488[/C][C]0.193203946484898[/C][C]0.903398026757551[/C][/ROW]
[ROW][C]20[/C][C]0.109928433247529[/C][C]0.219856866495057[/C][C]0.890071566752471[/C][/ROW]
[ROW][C]21[/C][C]0.130698859488026[/C][C]0.261397718976051[/C][C]0.869301140511974[/C][/ROW]
[ROW][C]22[/C][C]0.219602524167524[/C][C]0.439205048335048[/C][C]0.780397475832476[/C][/ROW]
[ROW][C]23[/C][C]0.178127302481759[/C][C]0.356254604963519[/C][C]0.82187269751824[/C][/ROW]
[ROW][C]24[/C][C]0.185694285161363[/C][C]0.371388570322725[/C][C]0.814305714838637[/C][/ROW]
[ROW][C]25[/C][C]0.143137196863420[/C][C]0.286274393726841[/C][C]0.85686280313658[/C][/ROW]
[ROW][C]26[/C][C]0.108111490697215[/C][C]0.216222981394430[/C][C]0.891888509302785[/C][/ROW]
[ROW][C]27[/C][C]0.0896389415427184[/C][C]0.179277883085437[/C][C]0.910361058457282[/C][/ROW]
[ROW][C]28[/C][C]0.0924915682138425[/C][C]0.184983136427685[/C][C]0.907508431786157[/C][/ROW]
[ROW][C]29[/C][C]0.0704381539703816[/C][C]0.140876307940763[/C][C]0.929561846029618[/C][/ROW]
[ROW][C]30[/C][C]0.0802381770074184[/C][C]0.160476354014837[/C][C]0.919761822992582[/C][/ROW]
[ROW][C]31[/C][C]0.0656144193359843[/C][C]0.131228838671969[/C][C]0.934385580664016[/C][/ROW]
[ROW][C]32[/C][C]0.113191046249812[/C][C]0.226382092499625[/C][C]0.886808953750188[/C][/ROW]
[ROW][C]33[/C][C]0.124983571953895[/C][C]0.249967143907791[/C][C]0.875016428046105[/C][/ROW]
[ROW][C]34[/C][C]0.145007643319159[/C][C]0.290015286638318[/C][C]0.854992356680841[/C][/ROW]
[ROW][C]35[/C][C]0.113105176550178[/C][C]0.226210353100355[/C][C]0.886894823449822[/C][/ROW]
[ROW][C]36[/C][C]0.104058960824141[/C][C]0.208117921648283[/C][C]0.895941039175859[/C][/ROW]
[ROW][C]37[/C][C]0.0868331942959814[/C][C]0.173666388591963[/C][C]0.913166805704019[/C][/ROW]
[ROW][C]38[/C][C]0.0691084329183081[/C][C]0.138216865836616[/C][C]0.930891567081692[/C][/ROW]
[ROW][C]39[/C][C]0.0915156243163284[/C][C]0.183031248632657[/C][C]0.908484375683672[/C][/ROW]
[ROW][C]40[/C][C]0.0980931620086888[/C][C]0.196186324017378[/C][C]0.901906837991311[/C][/ROW]
[ROW][C]41[/C][C]0.0792563493148252[/C][C]0.158512698629650[/C][C]0.920743650685175[/C][/ROW]
[ROW][C]42[/C][C]0.122462223918922[/C][C]0.244924447837844[/C][C]0.877537776081078[/C][/ROW]
[ROW][C]43[/C][C]0.113567813094490[/C][C]0.227135626188981[/C][C]0.88643218690551[/C][/ROW]
[ROW][C]44[/C][C]0.180933627503705[/C][C]0.361867255007409[/C][C]0.819066372496295[/C][/ROW]
[ROW][C]45[/C][C]0.234526871550696[/C][C]0.469053743101391[/C][C]0.765473128449304[/C][/ROW]
[ROW][C]46[/C][C]0.19365887328175[/C][C]0.3873177465635[/C][C]0.80634112671825[/C][/ROW]
[ROW][C]47[/C][C]0.156511101647059[/C][C]0.313022203294118[/C][C]0.843488898352941[/C][/ROW]
[ROW][C]48[/C][C]0.139237113720456[/C][C]0.278474227440912[/C][C]0.860762886279544[/C][/ROW]
[ROW][C]49[/C][C]0.115550076092980[/C][C]0.231100152185961[/C][C]0.88444992390702[/C][/ROW]
[ROW][C]50[/C][C]0.0976223034348211[/C][C]0.195244606869642[/C][C]0.902377696565179[/C][/ROW]
[ROW][C]51[/C][C]0.0787214194832382[/C][C]0.157442838966476[/C][C]0.921278580516762[/C][/ROW]
[ROW][C]52[/C][C]0.0680725779679144[/C][C]0.136145155935829[/C][C]0.931927422032086[/C][/ROW]
[ROW][C]53[/C][C]0.0510061359261339[/C][C]0.102012271852268[/C][C]0.948993864073866[/C][/ROW]
[ROW][C]54[/C][C]0.0581911535888248[/C][C]0.116382307177650[/C][C]0.941808846411175[/C][/ROW]
[ROW][C]55[/C][C]0.0998443502346994[/C][C]0.199688700469399[/C][C]0.9001556497653[/C][/ROW]
[ROW][C]56[/C][C]0.146638558680978[/C][C]0.293277117361955[/C][C]0.853361441319022[/C][/ROW]
[ROW][C]57[/C][C]0.12239307661563[/C][C]0.24478615323126[/C][C]0.87760692338437[/C][/ROW]
[ROW][C]58[/C][C]0.0963370160166428[/C][C]0.192674032033286[/C][C]0.903662983983357[/C][/ROW]
[ROW][C]59[/C][C]0.0739782438676871[/C][C]0.147956487735374[/C][C]0.926021756132313[/C][/ROW]
[ROW][C]60[/C][C]0.0912659004595284[/C][C]0.182531800919057[/C][C]0.908734099540472[/C][/ROW]
[ROW][C]61[/C][C]0.0724053762287668[/C][C]0.144810752457534[/C][C]0.927594623771233[/C][/ROW]
[ROW][C]62[/C][C]0.0598428025374333[/C][C]0.119685605074867[/C][C]0.940157197462567[/C][/ROW]
[ROW][C]63[/C][C]0.0698382874778517[/C][C]0.139676574955703[/C][C]0.930161712522148[/C][/ROW]
[ROW][C]64[/C][C]0.0520769929016617[/C][C]0.104153985803323[/C][C]0.947923007098338[/C][/ROW]
[ROW][C]65[/C][C]0.0534675377327801[/C][C]0.106935075465560[/C][C]0.94653246226722[/C][/ROW]
[ROW][C]66[/C][C]0.0606328654334125[/C][C]0.121265730866825[/C][C]0.939367134566587[/C][/ROW]
[ROW][C]67[/C][C]0.0890235179858293[/C][C]0.178047035971659[/C][C]0.91097648201417[/C][/ROW]
[ROW][C]68[/C][C]0.111464122424079[/C][C]0.222928244848157[/C][C]0.888535877575921[/C][/ROW]
[ROW][C]69[/C][C]0.0968828132251677[/C][C]0.193765626450335[/C][C]0.903117186774832[/C][/ROW]
[ROW][C]70[/C][C]0.107170371737347[/C][C]0.214340743474695[/C][C]0.892829628262653[/C][/ROW]
[ROW][C]71[/C][C]0.0986574651467335[/C][C]0.197314930293467[/C][C]0.901342534853266[/C][/ROW]
[ROW][C]72[/C][C]0.0876204388533758[/C][C]0.175240877706752[/C][C]0.912379561146624[/C][/ROW]
[ROW][C]73[/C][C]0.0633378015415309[/C][C]0.126675603083062[/C][C]0.93666219845847[/C][/ROW]
[ROW][C]74[/C][C]0.0439812231262445[/C][C]0.087962446252489[/C][C]0.956018776873755[/C][/ROW]
[ROW][C]75[/C][C]0.0680884963892333[/C][C]0.136176992778467[/C][C]0.931911503610767[/C][/ROW]
[ROW][C]76[/C][C]0.0496482758621515[/C][C]0.099296551724303[/C][C]0.950351724137849[/C][/ROW]
[ROW][C]77[/C][C]0.0421017756181979[/C][C]0.0842035512363958[/C][C]0.957898224381802[/C][/ROW]
[ROW][C]78[/C][C]0.425687426253381[/C][C]0.851374852506763[/C][C]0.574312573746619[/C][/ROW]
[ROW][C]79[/C][C]0.348955580110783[/C][C]0.697911160221566[/C][C]0.651044419889217[/C][/ROW]
[ROW][C]80[/C][C]0.280227486884304[/C][C]0.560454973768609[/C][C]0.719772513115696[/C][/ROW]
[ROW][C]81[/C][C]0.312795022824413[/C][C]0.625590045648825[/C][C]0.687204977175587[/C][/ROW]
[ROW][C]82[/C][C]0.428033049457881[/C][C]0.856066098915763[/C][C]0.571966950542119[/C][/ROW]
[ROW][C]83[/C][C]0.342689298506392[/C][C]0.685378597012783[/C][C]0.657310701493608[/C][/ROW]
[ROW][C]84[/C][C]0.435420094368515[/C][C]0.87084018873703[/C][C]0.564579905631485[/C][/ROW]
[ROW][C]85[/C][C]0.322694088210608[/C][C]0.645388176421216[/C][C]0.677305911789392[/C][/ROW]
[ROW][C]86[/C][C]0.210342135893194[/C][C]0.420684271786388[/C][C]0.789657864106806[/C][/ROW]
[ROW][C]87[/C][C]0.117591153565425[/C][C]0.235182307130851[/C][C]0.882408846434575[/C][/ROW]
[/TABLE]
Source: https://freestatistics.org/blog/index.php?pk=25713&T=5

Globally Unique Identifier (entire table): ba.freestatistics.org/blog/index.php?pk=25713&T=5

As an alternative you can also use a QR Code:  

The GUIDs for individual cells are displayed in the table below:

Goldfeld-Quandt test for Heteroskedasticity
p-valuesAlternative Hypothesis
breakpoint indexgreater2-sidedless
50.1740469289434830.3480938578869670.825953071056517
60.09653175632655980.1930635126531200.90346824367344
70.1265435599257660.2530871198515320.873456440074234
80.1492550595551770.2985101191103530.850744940444823
90.09497679438148010.1899535887629600.90502320561852
100.1891674161712380.3783348323424750.810832583828762
110.1290926722967640.2581853445935280.870907327703236
120.2242075009698550.4484150019397110.775792499030145
130.1587961852100580.3175923704201150.841203814789942
140.1111442550155120.2222885100310230.888855744984488
150.1465315777594460.2930631555188920.853468422240554
160.1302414602713870.2604829205427740.869758539728613
170.1121149543235160.2242299086470330.887885045676484
180.1217418040006380.2434836080012750.878258195999362
190.09660197324244880.1932039464848980.903398026757551
200.1099284332475290.2198568664950570.890071566752471
210.1306988594880260.2613977189760510.869301140511974
220.2196025241675240.4392050483350480.780397475832476
230.1781273024817590.3562546049635190.82187269751824
240.1856942851613630.3713885703227250.814305714838637
250.1431371968634200.2862743937268410.85686280313658
260.1081114906972150.2162229813944300.891888509302785
270.08963894154271840.1792778830854370.910361058457282
280.09249156821384250.1849831364276850.907508431786157
290.07043815397038160.1408763079407630.929561846029618
300.08023817700741840.1604763540148370.919761822992582
310.06561441933598430.1312288386719690.934385580664016
320.1131910462498120.2263820924996250.886808953750188
330.1249835719538950.2499671439077910.875016428046105
340.1450076433191590.2900152866383180.854992356680841
350.1131051765501780.2262103531003550.886894823449822
360.1040589608241410.2081179216482830.895941039175859
370.08683319429598140.1736663885919630.913166805704019
380.06910843291830810.1382168658366160.930891567081692
390.09151562431632840.1830312486326570.908484375683672
400.09809316200868880.1961863240173780.901906837991311
410.07925634931482520.1585126986296500.920743650685175
420.1224622239189220.2449244478378440.877537776081078
430.1135678130944900.2271356261889810.88643218690551
440.1809336275037050.3618672550074090.819066372496295
450.2345268715506960.4690537431013910.765473128449304
460.193658873281750.38731774656350.80634112671825
470.1565111016470590.3130222032941180.843488898352941
480.1392371137204560.2784742274409120.860762886279544
490.1155500760929800.2311001521859610.88444992390702
500.09762230343482110.1952446068696420.902377696565179
510.07872141948323820.1574428389664760.921278580516762
520.06807257796791440.1361451559358290.931927422032086
530.05100613592613390.1020122718522680.948993864073866
540.05819115358882480.1163823071776500.941808846411175
550.09984435023469940.1996887004693990.9001556497653
560.1466385586809780.2932771173619550.853361441319022
570.122393076615630.244786153231260.87760692338437
580.09633701601664280.1926740320332860.903662983983357
590.07397824386768710.1479564877353740.926021756132313
600.09126590045952840.1825318009190570.908734099540472
610.07240537622876680.1448107524575340.927594623771233
620.05984280253743330.1196856050748670.940157197462567
630.06983828747785170.1396765749557030.930161712522148
640.05207699290166170.1041539858033230.947923007098338
650.05346753773278010.1069350754655600.94653246226722
660.06063286543341250.1212657308668250.939367134566587
670.08902351798582930.1780470359716590.91097648201417
680.1114641224240790.2229282448481570.888535877575921
690.09688281322516770.1937656264503350.903117186774832
700.1071703717373470.2143407434746950.892829628262653
710.09865746514673350.1973149302934670.901342534853266
720.08762043885337580.1752408777067520.912379561146624
730.06333780154153090.1266756030830620.93666219845847
740.04398122312624450.0879624462524890.956018776873755
750.06808849638923330.1361769927784670.931911503610767
760.04964827586215150.0992965517243030.950351724137849
770.04210177561819790.08420355123639580.957898224381802
780.4256874262533810.8513748525067630.574312573746619
790.3489555801107830.6979111602215660.651044419889217
800.2802274868843040.5604549737686090.719772513115696
810.3127950228244130.6255900456488250.687204977175587
820.4280330494578810.8560660989157630.571966950542119
830.3426892985063920.6853785970127830.657310701493608
840.4354200943685150.870840188737030.564579905631485
850.3226940882106080.6453881764212160.677305911789392
860.2103421358931940.4206842717863880.789657864106806
870.1175911535654250.2351823071308510.882408846434575


Meta Analysis of Goldfeld-Quandt test for Heteroskedasticity
Description# significant tests% significant testsOK/NOK
1% type I error level00OK
5% type I error level00OK
10% type I error level30.036144578313253OK

\begin{tabular}{lllllllll}
\hline
Meta Analysis of Goldfeld-Quandt test for Heteroskedasticity \tabularnewline
Description & # significant tests & % significant tests & OK/NOK \tabularnewline
1% type I error level & 0 & 0 & OK \tabularnewline
5% type I error level & 0 & 0 & OK \tabularnewline
10% type I error level & 3 & 0.036144578313253 & OK \tabularnewline
\hline
\end{tabular}
%Source: https://freestatistics.org/blog/index.php?pk=25713&T=6

[TABLE]
[ROW][C]Meta Analysis of Goldfeld-Quandt test for Heteroskedasticity[/C][/ROW]
[ROW][C]Description[/C][C]# significant tests[/C][C]% significant tests[/C][C]OK/NOK[/C][/ROW]
[ROW][C]1% type I error level[/C][C]0[/C][C]0[/C][C]OK[/C][/ROW]
[ROW][C]5% type I error level[/C][C]0[/C][C]0[/C][C]OK[/C][/ROW]
[ROW][C]10% type I error level[/C][C]3[/C][C]0.036144578313253[/C][C]OK[/C][/ROW]
[/TABLE]
Source: https://freestatistics.org/blog/index.php?pk=25713&T=6

Globally Unique Identifier (entire table): ba.freestatistics.org/blog/index.php?pk=25713&T=6

As an alternative you can also use a QR Code:  

The GUIDs for individual cells are displayed in the table below:

Meta Analysis of Goldfeld-Quandt test for Heteroskedasticity
Description# significant tests% significant testsOK/NOK
1% type I error level00OK
5% type I error level00OK
10% type I error level30.036144578313253OK


Parameters (Session):
par1 = 1 ; par2 = Do not include Seasonal Dummies ; par3 = No Linear Trend ;
Parameters (R input):
par1 = 1 ; par2 = Do not include Seasonal Dummies ; par3 = No Linear Trend ;
R code (references can be found in the software module):
library(lattice)
library(lmtest)
n25 <- 25 #minimum number of obs. for Goldfeld-Quandt test
par1 <- as.numeric(par1)
x <- t(y)
k <- length(x[1,])
n <- length(x[,1])
x1 <- cbind(x[,par1], x[,1:k!=par1])
mycolnames <- c(colnames(x)[par1], colnames(x)[1:k!=par1])
colnames(x1) <- mycolnames #colnames(x)[par1]
x <- x1
if (par3 == 'First Differences'){
x2 <- array(0, dim=c(n-1,k), dimnames=list(1:(n-1), paste('(1-B)',colnames(x),sep='')))
for (i in 1:n-1) {
for (j in 1:k) {
x2[i,j] <- x[i+1,j] - x[i,j]
}
}
x <- x2
}
if (par2 == 'Include Monthly Dummies'){
x2 <- array(0, dim=c(n,11), dimnames=list(1:n, paste('M', seq(1:11), sep ='')))
for (i in 1:11){
x2[seq(i,n,12),i] <- 1
}
x <- cbind(x, x2)
}
if (par2 == 'Include Quarterly Dummies'){
x2 <- array(0, dim=c(n,3), dimnames=list(1:n, paste('Q', seq(1:3), sep ='')))
for (i in 1:3){
x2[seq(i,n,4),i] <- 1
}
x <- cbind(x, x2)
}
k <- length(x[1,])
if (par3 == 'Linear Trend'){
x <- cbind(x, c(1:n))
colnames(x)[k+1] <- 't'
}
x
k <- length(x[1,])
df <- as.data.frame(x)
(mylm <- lm(df))
(mysum <- summary(mylm))
if (n > n25) {
kp3 <- k + 3
nmkm3 <- n - k - 3
gqarr <- array(NA, dim=c(nmkm3-kp3+1,3))
numgqtests <- 0
numsignificant1 <- 0
numsignificant5 <- 0
numsignificant10 <- 0
for (mypoint in kp3:nmkm3) {
j <- 0
numgqtests <- numgqtests + 1
for (myalt in c('greater', 'two.sided', 'less')) {
j <- j + 1
gqarr[mypoint-kp3+1,j] <- gqtest(mylm, point=mypoint, alternative=myalt)$p.value
}
if (gqarr[mypoint-kp3+1,2] < 0.01) numsignificant1 <- numsignificant1 + 1
if (gqarr[mypoint-kp3+1,2] < 0.05) numsignificant5 <- numsignificant5 + 1
if (gqarr[mypoint-kp3+1,2] < 0.10) numsignificant10 <- numsignificant10 + 1
}
gqarr
}
bitmap(file='test0.png')
plot(x[,1], type='l', main='Actuals and Interpolation', ylab='value of Actuals and Interpolation (dots)', xlab='time or index')
points(x[,1]-mysum$resid)
grid()
dev.off()
bitmap(file='test1.png')
plot(mysum$resid, type='b', pch=19, main='Residuals', ylab='value of Residuals', xlab='time or index')
grid()
dev.off()
bitmap(file='test2.png')
hist(mysum$resid, main='Residual Histogram', xlab='values of Residuals')
grid()
dev.off()
bitmap(file='test3.png')
densityplot(~mysum$resid,col='black',main='Residual Density Plot', xlab='values of Residuals')
dev.off()
bitmap(file='test4.png')
qqnorm(mysum$resid, main='Residual Normal Q-Q Plot')
qqline(mysum$resid)
grid()
dev.off()
(myerror <- as.ts(mysum$resid))
bitmap(file='test5.png')
dum <- cbind(lag(myerror,k=1),myerror)
dum
dum1 <- dum[2:length(myerror),]
dum1
z <- as.data.frame(dum1)
z
plot(z,main=paste('Residual Lag plot, lowess, and regression line'), ylab='values of Residuals', xlab='lagged values of Residuals')
lines(lowess(z))
abline(lm(z))
grid()
dev.off()
bitmap(file='test6.png')
acf(mysum$resid, lag.max=length(mysum$resid)/2, main='Residual Autocorrelation Function')
grid()
dev.off()
bitmap(file='test7.png')
pacf(mysum$resid, lag.max=length(mysum$resid)/2, main='Residual Partial Autocorrelation Function')
grid()
dev.off()
bitmap(file='test8.png')
opar <- par(mfrow = c(2,2), oma = c(0, 0, 1.1, 0))
plot(mylm, las = 1, sub='Residual Diagnostics')
par(opar)
dev.off()
if (n > n25) {
bitmap(file='test9.png')
plot(kp3:nmkm3,gqarr[,2], main='Goldfeld-Quandt test',ylab='2-sided p-value',xlab='breakpoint')
grid()
dev.off()
}
load(file='createtable')
a<-table.start()
a<-table.row.start(a)
a<-table.element(a, 'Multiple Linear Regression - Estimated Regression Equation', 1, TRUE)
a<-table.row.end(a)
myeq <- colnames(x)[1]
myeq <- paste(myeq, '[t] = ', sep='')
for (i in 1:k){
if (mysum$coefficients[i,1] > 0) myeq <- paste(myeq, '+', '')
myeq <- paste(myeq, mysum$coefficients[i,1], sep=' ')
if (rownames(mysum$coefficients)[i] != '(Intercept)') {
myeq <- paste(myeq, rownames(mysum$coefficients)[i], sep='')
if (rownames(mysum$coefficients)[i] != 't') myeq <- paste(myeq, '[t]', sep='')
}
}
myeq <- paste(myeq, ' + e[t]')
a<-table.row.start(a)
a<-table.element(a, myeq)
a<-table.row.end(a)
a<-table.end(a)
table.save(a,file='mytable1.tab')
a<-table.start()
a<-table.row.start(a)
a<-table.element(a,hyperlink('ols1.htm','Multiple Linear Regression - Ordinary Least Squares',''), 6, TRUE)
a<-table.row.end(a)
a<-table.row.start(a)
a<-table.element(a,'Variable',header=TRUE)
a<-table.element(a,'Parameter',header=TRUE)
a<-table.element(a,'S.D.',header=TRUE)
a<-table.element(a,'T-STAT
H0: parameter = 0',header=TRUE)
a<-table.element(a,'2-tail p-value',header=TRUE)
a<-table.element(a,'1-tail p-value',header=TRUE)
a<-table.row.end(a)
for (i in 1:k){
a<-table.row.start(a)
a<-table.element(a,rownames(mysum$coefficients)[i],header=TRUE)
a<-table.element(a,mysum$coefficients[i,1])
a<-table.element(a, round(mysum$coefficients[i,2],6))
a<-table.element(a, round(mysum$coefficients[i,3],4))
a<-table.element(a, round(mysum$coefficients[i,4],6))
a<-table.element(a, round(mysum$coefficients[i,4]/2,6))
a<-table.row.end(a)
}
a<-table.end(a)
table.save(a,file='mytable2.tab')
a<-table.start()
a<-table.row.start(a)
a<-table.element(a, 'Multiple Linear Regression - Regression Statistics', 2, TRUE)
a<-table.row.end(a)
a<-table.row.start(a)
a<-table.element(a, 'Multiple R',1,TRUE)
a<-table.element(a, sqrt(mysum$r.squared))
a<-table.row.end(a)
a<-table.row.start(a)
a<-table.element(a, 'R-squared',1,TRUE)
a<-table.element(a, mysum$r.squared)
a<-table.row.end(a)
a<-table.row.start(a)
a<-table.element(a, 'Adjusted R-squared',1,TRUE)
a<-table.element(a, mysum$adj.r.squared)
a<-table.row.end(a)
a<-table.row.start(a)
a<-table.element(a, 'F-TEST (value)',1,TRUE)
a<-table.element(a, mysum$fstatistic[1])
a<-table.row.end(a)
a<-table.row.start(a)
a<-table.element(a, 'F-TEST (DF numerator)',1,TRUE)
a<-table.element(a, mysum$fstatistic[2])
a<-table.row.end(a)
a<-table.row.start(a)
a<-table.element(a, 'F-TEST (DF denominator)',1,TRUE)
a<-table.element(a, mysum$fstatistic[3])
a<-table.row.end(a)
a<-table.row.start(a)
a<-table.element(a, 'p-value',1,TRUE)
a<-table.element(a, 1-pf(mysum$fstatistic[1],mysum$fstatistic[2],mysum$fstatistic[3]))
a<-table.row.end(a)
a<-table.row.start(a)
a<-table.element(a, 'Multiple Linear Regression - Residual Statistics', 2, TRUE)
a<-table.row.end(a)
a<-table.row.start(a)
a<-table.element(a, 'Residual Standard Deviation',1,TRUE)
a<-table.element(a, mysum$sigma)
a<-table.row.end(a)
a<-table.row.start(a)
a<-table.element(a, 'Sum Squared Residuals',1,TRUE)
a<-table.element(a, sum(myerror*myerror))
a<-table.row.end(a)
a<-table.end(a)
table.save(a,file='mytable3.tab')
a<-table.start()
a<-table.row.start(a)
a<-table.element(a, 'Multiple Linear Regression - Actuals, Interpolation, and Residuals', 4, TRUE)
a<-table.row.end(a)
a<-table.row.start(a)
a<-table.element(a, 'Time or Index', 1, TRUE)
a<-table.element(a, 'Actuals', 1, TRUE)
a<-table.element(a, 'Interpolation
Forecast', 1, TRUE)
a<-table.element(a, 'Residuals
Prediction Error', 1, TRUE)
a<-table.row.end(a)
for (i in 1:n) {
a<-table.row.start(a)
a<-table.element(a,i, 1, TRUE)
a<-table.element(a,x[i])
a<-table.element(a,x[i]-mysum$resid[i])
a<-table.element(a,mysum$resid[i])
a<-table.row.end(a)
}
a<-table.end(a)
table.save(a,file='mytable4.tab')
if (n > n25) {
a<-table.start()
a<-table.row.start(a)
a<-table.element(a,'Goldfeld-Quandt test for Heteroskedasticity',4,TRUE)
a<-table.row.end(a)
a<-table.row.start(a)
a<-table.element(a,'p-values',header=TRUE)
a<-table.element(a,'Alternative Hypothesis',3,header=TRUE)
a<-table.row.end(a)
a<-table.row.start(a)
a<-table.element(a,'breakpoint index',header=TRUE)
a<-table.element(a,'greater',header=TRUE)
a<-table.element(a,'2-sided',header=TRUE)
a<-table.element(a,'less',header=TRUE)
a<-table.row.end(a)
for (mypoint in kp3:nmkm3) {
a<-table.row.start(a)
a<-table.element(a,mypoint,header=TRUE)
a<-table.element(a,gqarr[mypoint-kp3+1,1])
a<-table.element(a,gqarr[mypoint-kp3+1,2])
a<-table.element(a,gqarr[mypoint-kp3+1,3])
a<-table.row.end(a)
}
a<-table.end(a)
table.save(a,file='mytable5.tab')
a<-table.start()
a<-table.row.start(a)
a<-table.element(a,'Meta Analysis of Goldfeld-Quandt test for Heteroskedasticity',4,TRUE)
a<-table.row.end(a)
a<-table.row.start(a)
a<-table.element(a,'Description',header=TRUE)
a<-table.element(a,'# significant tests',header=TRUE)
a<-table.element(a,'% significant tests',header=TRUE)
a<-table.element(a,'OK/NOK',header=TRUE)
a<-table.row.end(a)
a<-table.row.start(a)
a<-table.element(a,'1% type I error level',header=TRUE)
a<-table.element(a,numsignificant1)
a<-table.element(a,numsignificant1/numgqtests)
if (numsignificant1/numgqtests < 0.01) dum <- 'OK' else dum <- 'NOK'
a<-table.element(a,dum)
a<-table.row.end(a)
a<-table.row.start(a)
a<-table.element(a,'5% type I error level',header=TRUE)
a<-table.element(a,numsignificant5)
a<-table.element(a,numsignificant5/numgqtests)
if (numsignificant5/numgqtests < 0.05) dum <- 'OK' else dum <- 'NOK'
a<-table.element(a,dum)
a<-table.row.end(a)
a<-table.row.start(a)
a<-table.element(a,'10% type I error level',header=TRUE)
a<-table.element(a,numsignificant10)
a<-table.element(a,numsignificant10/numgqtests)
if (numsignificant10/numgqtests < 0.1) dum <- 'OK' else dum <- 'NOK'
a<-table.element(a,dum)
a<-table.row.end(a)
a<-table.end(a)
table.save(a,file='mytable6.tab')
}