Free Statistics

of Irreproducible Research!

Author's title

Author*The author of this computation has been verified*
R Software Modulerwasp_multipleregression.wasp
Title produced by softwareMultiple Regression
Date of computationSun, 23 Nov 2008 15:57:41 -0700
Cite this page as followsStatistical Computations at FreeStatistics.org, Office for Research Development and Education, URL https://freestatistics.org/blog/index.php?v=date/2008/Nov/23/t1227481175j5krlvxiurw7x0d.htm/, Retrieved Sun, 19 May 2024 04:19:29 +0000
Statistical Computations at FreeStatistics.org, Office for Research Development and Education, URL https://freestatistics.org/blog/index.php?pk=25351, Retrieved Sun, 19 May 2024 04:19:29 +0000
QR Codes:

Original text written by user:
IsPrivate?No (this computation is public)
User-defined keywords
Estimated Impact194
Family? (F = Feedback message, R = changed R code, M = changed R Module, P = changed Parameters, D = changed Data)
-     [Multiple Regression] [Q1 The Seatbeltlaw] [2007-11-14 19:27:43] [8cd6641b921d30ebe00b648d1481bba0]
F    D  [Multiple Regression] [Seatbelt Law - Q1] [2008-11-19 12:45:01] [82970caad4b026be9dd352fdec547fe4]
-   P     [Multiple Regression] [Seatbelt Law - Q1...] [2008-11-19 12:54:40] [82970caad4b026be9dd352fdec547fe4]
F   P       [Multiple Regression] [Seatbelt Law - Q1...] [2008-11-19 13:00:05] [82970caad4b026be9dd352fdec547fe4]
F             [Multiple Regression] [Q1 No linear tren...] [2008-11-19 23:06:27] [d32f94eec6fe2d8c421bd223368a5ced]
F   PD            [Multiple Regression] [Seatbelt Law Q3 e...] [2008-11-23 22:57:41] [382e90e66f02be5ed86892bdc1574692] [Current]
Feedback Forum
2008-11-28 08:38:52 [Ken Van den Heuvel] [reply
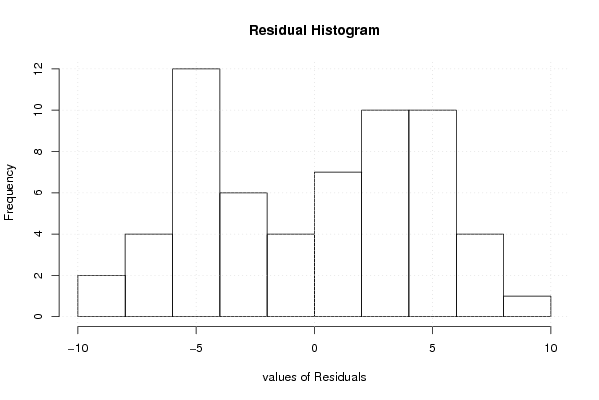
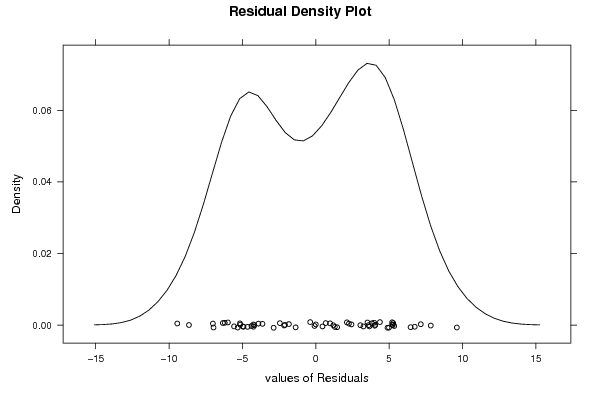
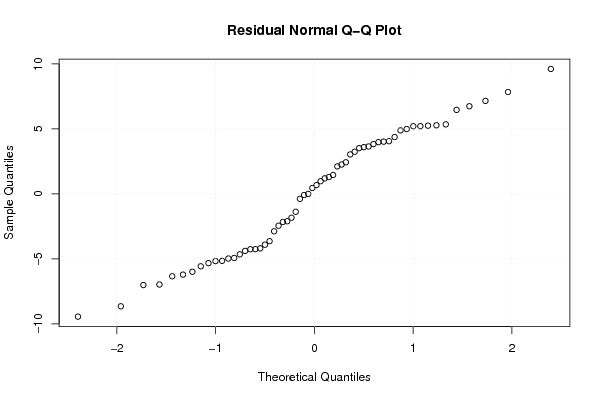
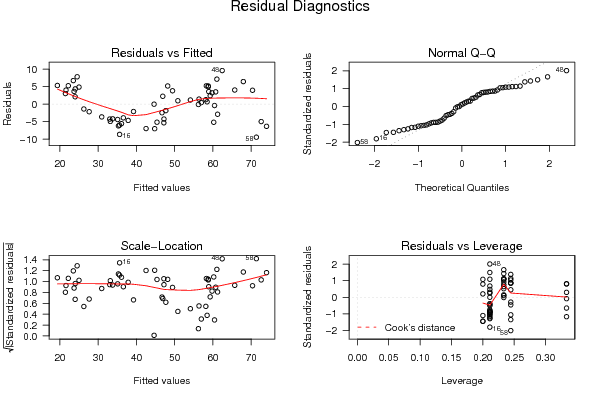
Je stelt dat de mean van de residu's niet gelijk is aan 0. Gezien de verdeling niet perfect normaal verloop klopt dit wel, maar je had kunnen nagaan of dit wel significant van 0 verschilt.

Via de T-test of Testing mean with unknown variance kon je dit nagaan met de waarden van de residu's.

Ik verwijs hierbij naar mijn feedback van Q2.

http://www.freestatistics.org/blog/index.php?v=date/2008/Nov/20/t1227136260st2ue51ziosmi86.htm/

De methode op dit te testen is gelijkaardig in deze vraag.

Post a new message
Dataseries X:
24,67	0
25,59	0
26,09	0
28,37	0
27,34	0
24,46	0
27,46	0
30,23	0
32,33	0
29,87	0
24,87	0
25,48	0
27,28	0
28,24	0
29,58	0
26,95	0
29,08	0
28,76	0
29,59	0
30,7	0
30,52	0
32,67	0
33,19	0
37,13	0
35,54	0
37,75	0
41,84	0
42,94	0
49,14	0
44,61	0
40,22	0
44,23	0
45,85	0
53,38	0
53,26	0
51,8	0
55,3	0
57,81	0
63,96	0
63,77	0
59,15	0
56,12	0
57,42	0
63,52	0
61,71	0
63,01	0
68,18	0
72,03	0
69,75	0
74,41	0
74,33	0
64,24	1
60,03	1
59,44	1
62,5	1
55,04	1
58,34	1
61,92	0
67,65	0
67,68	0


Summary of computational transaction
Raw Inputview raw input (R code)
Raw Outputview raw output of R engine
Computing time4 seconds
R Server'Sir Ronald Aylmer Fisher' @ 193.190.124.24

\begin{tabular}{lllllllll}
\hline
Summary of computational transaction \tabularnewline
Raw Input & view raw input (R code)  \tabularnewline
Raw Output & view raw output of R engine  \tabularnewline
Computing time & 4 seconds \tabularnewline
R Server & 'Sir Ronald Aylmer Fisher' @ 193.190.124.24 \tabularnewline
\hline
\end{tabular}
%Source: https://freestatistics.org/blog/index.php?pk=25351&T=0

[TABLE]
[ROW][C]Summary of computational transaction[/C][/ROW]
[ROW][C]Raw Input[/C][C]view raw input (R code) [/C][/ROW]
[ROW][C]Raw Output[/C][C]view raw output of R engine [/C][/ROW]
[ROW][C]Computing time[/C][C]4 seconds[/C][/ROW]
[ROW][C]R Server[/C][C]'Sir Ronald Aylmer Fisher' @ 193.190.124.24[/C][/ROW]
[/TABLE]
Source: https://freestatistics.org/blog/index.php?pk=25351&T=0

Globally Unique Identifier (entire table): ba.freestatistics.org/blog/index.php?pk=25351&T=0

As an alternative you can also use a QR Code:  

The GUIDs for individual cells are displayed in the table below:

Summary of computational transaction
Raw Inputview raw input (R code)
Raw Outputview raw output of R engine
Computing time4 seconds
R Server'Sir Ronald Aylmer Fisher' @ 193.190.124.24


Multiple Linear Regression - Estimated Regression Equation
Y[t] = + 16.0411666666667 -9.65694444444445D[t] + 2.31208796296296M1[t] + 3.59789814814815M2[t] + 5.03170833333333M3[t] + 4.09090740740741M4[t] + 2.81871759259260M5[t] -0.417472222222220M6[t] -0.623662037037035M7[t] -0.283851851851850M8[t] -0.244041666666662M9[t] -0.721620370370367M10[t] -0.427810185185180M11[t] + 0.966189814814815t + e[t]

\begin{tabular}{lllllllll}
\hline
Multiple Linear Regression - Estimated Regression Equation \tabularnewline
Y[t] =  +  16.0411666666667 -9.65694444444445D[t] +  2.31208796296296M1[t] +  3.59789814814815M2[t] +  5.03170833333333M3[t] +  4.09090740740741M4[t] +  2.81871759259260M5[t] -0.417472222222220M6[t] -0.623662037037035M7[t] -0.283851851851850M8[t] -0.244041666666662M9[t] -0.721620370370367M10[t] -0.427810185185180M11[t] +  0.966189814814815t  + e[t] \tabularnewline
\hline
\end{tabular}
%Source: https://freestatistics.org/blog/index.php?pk=25351&T=1

[TABLE]
[ROW][C]Multiple Linear Regression - Estimated Regression Equation[/C][/ROW]
[ROW][C]Y[t] =  +  16.0411666666667 -9.65694444444445D[t] +  2.31208796296296M1[t] +  3.59789814814815M2[t] +  5.03170833333333M3[t] +  4.09090740740741M4[t] +  2.81871759259260M5[t] -0.417472222222220M6[t] -0.623662037037035M7[t] -0.283851851851850M8[t] -0.244041666666662M9[t] -0.721620370370367M10[t] -0.427810185185180M11[t] +  0.966189814814815t  + e[t][/C][/ROW]
[/TABLE]
Source: https://freestatistics.org/blog/index.php?pk=25351&T=1

Globally Unique Identifier (entire table): ba.freestatistics.org/blog/index.php?pk=25351&T=1

As an alternative you can also use a QR Code:  

The GUIDs for individual cells are displayed in the table below:

Multiple Linear Regression - Estimated Regression Equation
Y[t] = + 16.0411666666667 -9.65694444444445D[t] + 2.31208796296296M1[t] + 3.59789814814815M2[t] + 5.03170833333333M3[t] + 4.09090740740741M4[t] + 2.81871759259260M5[t] -0.417472222222220M6[t] -0.623662037037035M7[t] -0.283851851851850M8[t] -0.244041666666662M9[t] -0.721620370370367M10[t] -0.427810185185180M11[t] + 0.966189814814815t + e[t]


Multiple Linear Regression - Ordinary Least Squares
VariableParameterS.D.T-STATH0: parameter = 02-tail p-value1-tail p-value
(Intercept)16.04116666666672.9465865.4442e-061e-06
D-9.656944444444452.835354-3.40590.0013780.000689
M12.312087962962963.4419040.67170.5051050.252552
M23.597898148148153.4350851.04740.3003890.150194
M35.031708333333333.4289031.46740.1490610.074531
M44.090907407407413.5007661.16860.2485960.124298
M52.818717592592603.4921440.80720.4237290.211864
M6-0.4174722222222203.484141-0.11980.9051470.452573
M7-0.6236620370370353.476763-0.17940.8584270.429214
M8-0.2838518518518503.470012-0.08180.935160.46758
M9-0.2440416666666623.463893-0.07050.9441390.472069
M10-0.7216203703703673.403737-0.2120.8330370.416519
M11-0.4278101851851803.402753-0.12570.9004980.450249
t0.9661898148148150.04725620.445900

\begin{tabular}{lllllllll}
\hline
Multiple Linear Regression - Ordinary Least Squares \tabularnewline
Variable & Parameter & S.D. & T-STATH0: parameter = 0 & 2-tail p-value & 1-tail p-value \tabularnewline
(Intercept) & 16.0411666666667 & 2.946586 & 5.444 & 2e-06 & 1e-06 \tabularnewline
D & -9.65694444444445 & 2.835354 & -3.4059 & 0.001378 & 0.000689 \tabularnewline
M1 & 2.31208796296296 & 3.441904 & 0.6717 & 0.505105 & 0.252552 \tabularnewline
M2 & 3.59789814814815 & 3.435085 & 1.0474 & 0.300389 & 0.150194 \tabularnewline
M3 & 5.03170833333333 & 3.428903 & 1.4674 & 0.149061 & 0.074531 \tabularnewline
M4 & 4.09090740740741 & 3.500766 & 1.1686 & 0.248596 & 0.124298 \tabularnewline
M5 & 2.81871759259260 & 3.492144 & 0.8072 & 0.423729 & 0.211864 \tabularnewline
M6 & -0.417472222222220 & 3.484141 & -0.1198 & 0.905147 & 0.452573 \tabularnewline
M7 & -0.623662037037035 & 3.476763 & -0.1794 & 0.858427 & 0.429214 \tabularnewline
M8 & -0.283851851851850 & 3.470012 & -0.0818 & 0.93516 & 0.46758 \tabularnewline
M9 & -0.244041666666662 & 3.463893 & -0.0705 & 0.944139 & 0.472069 \tabularnewline
M10 & -0.721620370370367 & 3.403737 & -0.212 & 0.833037 & 0.416519 \tabularnewline
M11 & -0.427810185185180 & 3.402753 & -0.1257 & 0.900498 & 0.450249 \tabularnewline
t & 0.966189814814815 & 0.047256 & 20.4459 & 0 & 0 \tabularnewline
\hline
\end{tabular}
%Source: https://freestatistics.org/blog/index.php?pk=25351&T=2

[TABLE]
[ROW][C]Multiple Linear Regression - Ordinary Least Squares[/C][/ROW]
[ROW][C]Variable[/C][C]Parameter[/C][C]S.D.[/C][C]T-STATH0: parameter = 0[/C][C]2-tail p-value[/C][C]1-tail p-value[/C][/ROW]
[ROW][C](Intercept)[/C][C]16.0411666666667[/C][C]2.946586[/C][C]5.444[/C][C]2e-06[/C][C]1e-06[/C][/ROW]
[ROW][C]D[/C][C]-9.65694444444445[/C][C]2.835354[/C][C]-3.4059[/C][C]0.001378[/C][C]0.000689[/C][/ROW]
[ROW][C]M1[/C][C]2.31208796296296[/C][C]3.441904[/C][C]0.6717[/C][C]0.505105[/C][C]0.252552[/C][/ROW]
[ROW][C]M2[/C][C]3.59789814814815[/C][C]3.435085[/C][C]1.0474[/C][C]0.300389[/C][C]0.150194[/C][/ROW]
[ROW][C]M3[/C][C]5.03170833333333[/C][C]3.428903[/C][C]1.4674[/C][C]0.149061[/C][C]0.074531[/C][/ROW]
[ROW][C]M4[/C][C]4.09090740740741[/C][C]3.500766[/C][C]1.1686[/C][C]0.248596[/C][C]0.124298[/C][/ROW]
[ROW][C]M5[/C][C]2.81871759259260[/C][C]3.492144[/C][C]0.8072[/C][C]0.423729[/C][C]0.211864[/C][/ROW]
[ROW][C]M6[/C][C]-0.417472222222220[/C][C]3.484141[/C][C]-0.1198[/C][C]0.905147[/C][C]0.452573[/C][/ROW]
[ROW][C]M7[/C][C]-0.623662037037035[/C][C]3.476763[/C][C]-0.1794[/C][C]0.858427[/C][C]0.429214[/C][/ROW]
[ROW][C]M8[/C][C]-0.283851851851850[/C][C]3.470012[/C][C]-0.0818[/C][C]0.93516[/C][C]0.46758[/C][/ROW]
[ROW][C]M9[/C][C]-0.244041666666662[/C][C]3.463893[/C][C]-0.0705[/C][C]0.944139[/C][C]0.472069[/C][/ROW]
[ROW][C]M10[/C][C]-0.721620370370367[/C][C]3.403737[/C][C]-0.212[/C][C]0.833037[/C][C]0.416519[/C][/ROW]
[ROW][C]M11[/C][C]-0.427810185185180[/C][C]3.402753[/C][C]-0.1257[/C][C]0.900498[/C][C]0.450249[/C][/ROW]
[ROW][C]t[/C][C]0.966189814814815[/C][C]0.047256[/C][C]20.4459[/C][C]0[/C][C]0[/C][/ROW]
[/TABLE]
Source: https://freestatistics.org/blog/index.php?pk=25351&T=2

Globally Unique Identifier (entire table): ba.freestatistics.org/blog/index.php?pk=25351&T=2

As an alternative you can also use a QR Code:  

The GUIDs for individual cells are displayed in the table below:

Multiple Linear Regression - Ordinary Least Squares
VariableParameterS.D.T-STATH0: parameter = 02-tail p-value1-tail p-value
(Intercept)16.04116666666672.9465865.4442e-061e-06
D-9.656944444444452.835354-3.40590.0013780.000689
M12.312087962962963.4419040.67170.5051050.252552
M23.597898148148153.4350851.04740.3003890.150194
M35.031708333333333.4289031.46740.1490610.074531
M44.090907407407413.5007661.16860.2485960.124298
M52.818717592592603.4921440.80720.4237290.211864
M6-0.4174722222222203.484141-0.11980.9051470.452573
M7-0.6236620370370353.476763-0.17940.8584270.429214
M8-0.2838518518518503.470012-0.08180.935160.46758
M9-0.2440416666666623.463893-0.07050.9441390.472069
M10-0.7216203703703673.403737-0.2120.8330370.416519
M11-0.4278101851851803.402753-0.12570.9004980.450249
t0.9661898148148150.04725620.445900


Multiple Linear Regression - Regression Statistics
Multiple R0.95637706316928
R-squared0.914657086956299
Adjusted R-squared0.890538437617861
F-TEST (value)37.923230033393
F-TEST (DF numerator)13
F-TEST (DF denominator)46
p-value0
Multiple Linear Regression - Residual Statistics
Residual Standard Deviation5.37970616127336
Sum Squared Residuals1331.29696555556

\begin{tabular}{lllllllll}
\hline
Multiple Linear Regression - Regression Statistics \tabularnewline
Multiple R & 0.95637706316928 \tabularnewline
R-squared & 0.914657086956299 \tabularnewline
Adjusted R-squared & 0.890538437617861 \tabularnewline
F-TEST (value) & 37.923230033393 \tabularnewline
F-TEST (DF numerator) & 13 \tabularnewline
F-TEST (DF denominator) & 46 \tabularnewline
p-value & 0 \tabularnewline
Multiple Linear Regression - Residual Statistics \tabularnewline
Residual Standard Deviation & 5.37970616127336 \tabularnewline
Sum Squared Residuals & 1331.29696555556 \tabularnewline
\hline
\end{tabular}
%Source: https://freestatistics.org/blog/index.php?pk=25351&T=3

[TABLE]
[ROW][C]Multiple Linear Regression - Regression Statistics[/C][/ROW]
[ROW][C]Multiple R[/C][C]0.95637706316928[/C][/ROW]
[ROW][C]R-squared[/C][C]0.914657086956299[/C][/ROW]
[ROW][C]Adjusted R-squared[/C][C]0.890538437617861[/C][/ROW]
[ROW][C]F-TEST (value)[/C][C]37.923230033393[/C][/ROW]
[ROW][C]F-TEST (DF numerator)[/C][C]13[/C][/ROW]
[ROW][C]F-TEST (DF denominator)[/C][C]46[/C][/ROW]
[ROW][C]p-value[/C][C]0[/C][/ROW]
[ROW][C]Multiple Linear Regression - Residual Statistics[/C][/ROW]
[ROW][C]Residual Standard Deviation[/C][C]5.37970616127336[/C][/ROW]
[ROW][C]Sum Squared Residuals[/C][C]1331.29696555556[/C][/ROW]
[/TABLE]
Source: https://freestatistics.org/blog/index.php?pk=25351&T=3

Globally Unique Identifier (entire table): ba.freestatistics.org/blog/index.php?pk=25351&T=3

As an alternative you can also use a QR Code:  

The GUIDs for individual cells are displayed in the table below:

Multiple Linear Regression - Regression Statistics
Multiple R0.95637706316928
R-squared0.914657086956299
Adjusted R-squared0.890538437617861
F-TEST (value)37.923230033393
F-TEST (DF numerator)13
F-TEST (DF denominator)46
p-value0
Multiple Linear Regression - Residual Statistics
Residual Standard Deviation5.37970616127336
Sum Squared Residuals1331.29696555556


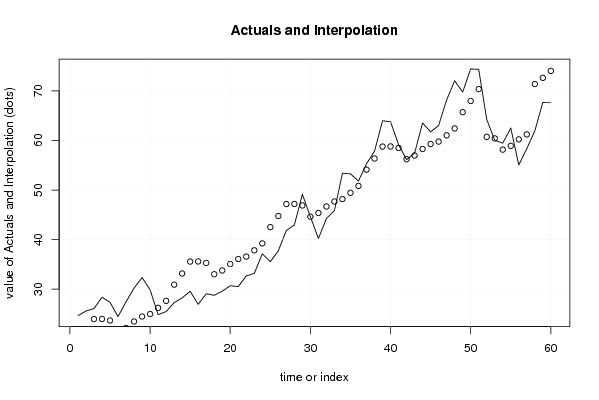
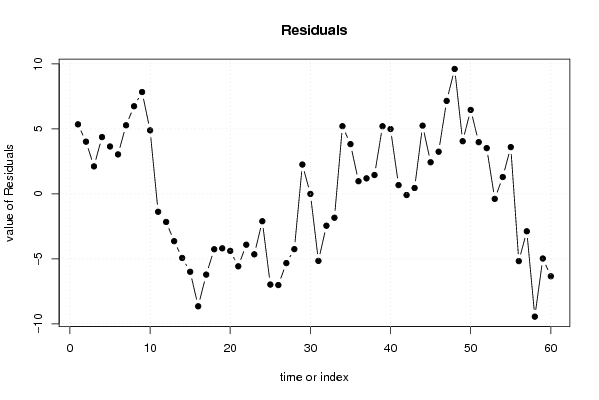
Multiple Linear Regression - Actuals, Interpolation, and Residuals
Time or IndexActualsInterpolationForecastResidualsPrediction Error
124.6719.31944444444445.35055555555555
225.5921.57144444444444.01855555555556
326.0923.97144444444442.11855555555556
428.3723.99683333333334.37316666666666
527.3423.69083333333333.64916666666668
624.4621.42083333333333.03916666666666
727.4622.18083333333335.27916666666667
830.2323.48683333333336.74316666666667
932.3324.49283333333337.83716666666666
1029.8724.98144444444444.88855555555556
1124.8726.2414444444444-1.37144444444445
1225.4827.6354444444444-2.15544444444445
1327.2830.9137222222222-3.63372222222221
1428.2433.1657222222222-4.92572222222224
1529.5835.5657222222222-5.98572222222222
1626.9535.5911111111111-8.6411111111111
1729.0835.2851111111111-6.20511111111111
1828.7633.0151111111111-4.25511111111111
1929.5933.7751111111111-4.18511111111111
2030.735.0811111111111-4.38111111111111
2130.5236.0871111111111-5.56711111111111
2232.6736.5757222222222-3.90572222222222
2333.1937.8357222222222-4.64572222222223
2437.1339.2297222222222-2.09972222222222
2535.5442.508-6.968
2637.7544.76-7.00999999999999
2741.8447.16-5.32
2842.9447.1853888888889-4.24538888888889
2949.1446.87938888888892.26061111111111
3044.6144.60938888888890.000611111111112331
3140.2245.3693888888889-5.14938888888889
3244.2346.6753888888889-2.44538888888890
3345.8547.6813888888889-1.83138888888889
3453.3848.175.21
3553.2649.433.82999999999999
3651.850.8240.975999999999995
3755.354.10227777777781.19772222222221
3857.8156.35427777777781.45572222222223
3963.9658.75427777777785.20572222222222
4063.7758.77966666666674.99033333333334
4159.1558.47366666666670.676333333333324
4256.1256.2036666666667-0.0836666666666691
4357.4256.96366666666670.456333333333329
4463.5258.26966666666675.25033333333334
4561.7159.27566666666672.43433333333333
4663.0159.76427777777783.24572222222222
4768.1861.02427777777787.15572222222223
4872.0362.41827777777789.61172222222221
4969.7565.69655555555554.05344444444445
5074.4167.94855555555566.46144444444444
5174.3370.34855555555563.98144444444444
5264.2460.7173.52300000000000
5360.0360.411-0.380999999999998
5459.4458.1411.299
5562.558.9013.599
5655.0460.207-5.167
5758.3461.213-2.873
5861.9271.3585555555556-9.43855555555556
5967.6572.6185555555555-4.96855555555555
6067.6874.0125555555556-6.33255555555554

\begin{tabular}{lllllllll}
\hline
Multiple Linear Regression - Actuals, Interpolation, and Residuals \tabularnewline
Time or Index & Actuals & InterpolationForecast & ResidualsPrediction Error \tabularnewline
1 & 24.67 & 19.3194444444444 & 5.35055555555555 \tabularnewline
2 & 25.59 & 21.5714444444444 & 4.01855555555556 \tabularnewline
3 & 26.09 & 23.9714444444444 & 2.11855555555556 \tabularnewline
4 & 28.37 & 23.9968333333333 & 4.37316666666666 \tabularnewline
5 & 27.34 & 23.6908333333333 & 3.64916666666668 \tabularnewline
6 & 24.46 & 21.4208333333333 & 3.03916666666666 \tabularnewline
7 & 27.46 & 22.1808333333333 & 5.27916666666667 \tabularnewline
8 & 30.23 & 23.4868333333333 & 6.74316666666667 \tabularnewline
9 & 32.33 & 24.4928333333333 & 7.83716666666666 \tabularnewline
10 & 29.87 & 24.9814444444444 & 4.88855555555556 \tabularnewline
11 & 24.87 & 26.2414444444444 & -1.37144444444445 \tabularnewline
12 & 25.48 & 27.6354444444444 & -2.15544444444445 \tabularnewline
13 & 27.28 & 30.9137222222222 & -3.63372222222221 \tabularnewline
14 & 28.24 & 33.1657222222222 & -4.92572222222224 \tabularnewline
15 & 29.58 & 35.5657222222222 & -5.98572222222222 \tabularnewline
16 & 26.95 & 35.5911111111111 & -8.6411111111111 \tabularnewline
17 & 29.08 & 35.2851111111111 & -6.20511111111111 \tabularnewline
18 & 28.76 & 33.0151111111111 & -4.25511111111111 \tabularnewline
19 & 29.59 & 33.7751111111111 & -4.18511111111111 \tabularnewline
20 & 30.7 & 35.0811111111111 & -4.38111111111111 \tabularnewline
21 & 30.52 & 36.0871111111111 & -5.56711111111111 \tabularnewline
22 & 32.67 & 36.5757222222222 & -3.90572222222222 \tabularnewline
23 & 33.19 & 37.8357222222222 & -4.64572222222223 \tabularnewline
24 & 37.13 & 39.2297222222222 & -2.09972222222222 \tabularnewline
25 & 35.54 & 42.508 & -6.968 \tabularnewline
26 & 37.75 & 44.76 & -7.00999999999999 \tabularnewline
27 & 41.84 & 47.16 & -5.32 \tabularnewline
28 & 42.94 & 47.1853888888889 & -4.24538888888889 \tabularnewline
29 & 49.14 & 46.8793888888889 & 2.26061111111111 \tabularnewline
30 & 44.61 & 44.6093888888889 & 0.000611111111112331 \tabularnewline
31 & 40.22 & 45.3693888888889 & -5.14938888888889 \tabularnewline
32 & 44.23 & 46.6753888888889 & -2.44538888888890 \tabularnewline
33 & 45.85 & 47.6813888888889 & -1.83138888888889 \tabularnewline
34 & 53.38 & 48.17 & 5.21 \tabularnewline
35 & 53.26 & 49.43 & 3.82999999999999 \tabularnewline
36 & 51.8 & 50.824 & 0.975999999999995 \tabularnewline
37 & 55.3 & 54.1022777777778 & 1.19772222222221 \tabularnewline
38 & 57.81 & 56.3542777777778 & 1.45572222222223 \tabularnewline
39 & 63.96 & 58.7542777777778 & 5.20572222222222 \tabularnewline
40 & 63.77 & 58.7796666666667 & 4.99033333333334 \tabularnewline
41 & 59.15 & 58.4736666666667 & 0.676333333333324 \tabularnewline
42 & 56.12 & 56.2036666666667 & -0.0836666666666691 \tabularnewline
43 & 57.42 & 56.9636666666667 & 0.456333333333329 \tabularnewline
44 & 63.52 & 58.2696666666667 & 5.25033333333334 \tabularnewline
45 & 61.71 & 59.2756666666667 & 2.43433333333333 \tabularnewline
46 & 63.01 & 59.7642777777778 & 3.24572222222222 \tabularnewline
47 & 68.18 & 61.0242777777778 & 7.15572222222223 \tabularnewline
48 & 72.03 & 62.4182777777778 & 9.61172222222221 \tabularnewline
49 & 69.75 & 65.6965555555555 & 4.05344444444445 \tabularnewline
50 & 74.41 & 67.9485555555556 & 6.46144444444444 \tabularnewline
51 & 74.33 & 70.3485555555556 & 3.98144444444444 \tabularnewline
52 & 64.24 & 60.717 & 3.52300000000000 \tabularnewline
53 & 60.03 & 60.411 & -0.380999999999998 \tabularnewline
54 & 59.44 & 58.141 & 1.299 \tabularnewline
55 & 62.5 & 58.901 & 3.599 \tabularnewline
56 & 55.04 & 60.207 & -5.167 \tabularnewline
57 & 58.34 & 61.213 & -2.873 \tabularnewline
58 & 61.92 & 71.3585555555556 & -9.43855555555556 \tabularnewline
59 & 67.65 & 72.6185555555555 & -4.96855555555555 \tabularnewline
60 & 67.68 & 74.0125555555556 & -6.33255555555554 \tabularnewline
\hline
\end{tabular}
%Source: https://freestatistics.org/blog/index.php?pk=25351&T=4

[TABLE]
[ROW][C]Multiple Linear Regression - Actuals, Interpolation, and Residuals[/C][/ROW]
[ROW][C]Time or Index[/C][C]Actuals[/C][C]InterpolationForecast[/C][C]ResidualsPrediction Error[/C][/ROW]
[ROW][C]1[/C][C]24.67[/C][C]19.3194444444444[/C][C]5.35055555555555[/C][/ROW]
[ROW][C]2[/C][C]25.59[/C][C]21.5714444444444[/C][C]4.01855555555556[/C][/ROW]
[ROW][C]3[/C][C]26.09[/C][C]23.9714444444444[/C][C]2.11855555555556[/C][/ROW]
[ROW][C]4[/C][C]28.37[/C][C]23.9968333333333[/C][C]4.37316666666666[/C][/ROW]
[ROW][C]5[/C][C]27.34[/C][C]23.6908333333333[/C][C]3.64916666666668[/C][/ROW]
[ROW][C]6[/C][C]24.46[/C][C]21.4208333333333[/C][C]3.03916666666666[/C][/ROW]
[ROW][C]7[/C][C]27.46[/C][C]22.1808333333333[/C][C]5.27916666666667[/C][/ROW]
[ROW][C]8[/C][C]30.23[/C][C]23.4868333333333[/C][C]6.74316666666667[/C][/ROW]
[ROW][C]9[/C][C]32.33[/C][C]24.4928333333333[/C][C]7.83716666666666[/C][/ROW]
[ROW][C]10[/C][C]29.87[/C][C]24.9814444444444[/C][C]4.88855555555556[/C][/ROW]
[ROW][C]11[/C][C]24.87[/C][C]26.2414444444444[/C][C]-1.37144444444445[/C][/ROW]
[ROW][C]12[/C][C]25.48[/C][C]27.6354444444444[/C][C]-2.15544444444445[/C][/ROW]
[ROW][C]13[/C][C]27.28[/C][C]30.9137222222222[/C][C]-3.63372222222221[/C][/ROW]
[ROW][C]14[/C][C]28.24[/C][C]33.1657222222222[/C][C]-4.92572222222224[/C][/ROW]
[ROW][C]15[/C][C]29.58[/C][C]35.5657222222222[/C][C]-5.98572222222222[/C][/ROW]
[ROW][C]16[/C][C]26.95[/C][C]35.5911111111111[/C][C]-8.6411111111111[/C][/ROW]
[ROW][C]17[/C][C]29.08[/C][C]35.2851111111111[/C][C]-6.20511111111111[/C][/ROW]
[ROW][C]18[/C][C]28.76[/C][C]33.0151111111111[/C][C]-4.25511111111111[/C][/ROW]
[ROW][C]19[/C][C]29.59[/C][C]33.7751111111111[/C][C]-4.18511111111111[/C][/ROW]
[ROW][C]20[/C][C]30.7[/C][C]35.0811111111111[/C][C]-4.38111111111111[/C][/ROW]
[ROW][C]21[/C][C]30.52[/C][C]36.0871111111111[/C][C]-5.56711111111111[/C][/ROW]
[ROW][C]22[/C][C]32.67[/C][C]36.5757222222222[/C][C]-3.90572222222222[/C][/ROW]
[ROW][C]23[/C][C]33.19[/C][C]37.8357222222222[/C][C]-4.64572222222223[/C][/ROW]
[ROW][C]24[/C][C]37.13[/C][C]39.2297222222222[/C][C]-2.09972222222222[/C][/ROW]
[ROW][C]25[/C][C]35.54[/C][C]42.508[/C][C]-6.968[/C][/ROW]
[ROW][C]26[/C][C]37.75[/C][C]44.76[/C][C]-7.00999999999999[/C][/ROW]
[ROW][C]27[/C][C]41.84[/C][C]47.16[/C][C]-5.32[/C][/ROW]
[ROW][C]28[/C][C]42.94[/C][C]47.1853888888889[/C][C]-4.24538888888889[/C][/ROW]
[ROW][C]29[/C][C]49.14[/C][C]46.8793888888889[/C][C]2.26061111111111[/C][/ROW]
[ROW][C]30[/C][C]44.61[/C][C]44.6093888888889[/C][C]0.000611111111112331[/C][/ROW]
[ROW][C]31[/C][C]40.22[/C][C]45.3693888888889[/C][C]-5.14938888888889[/C][/ROW]
[ROW][C]32[/C][C]44.23[/C][C]46.6753888888889[/C][C]-2.44538888888890[/C][/ROW]
[ROW][C]33[/C][C]45.85[/C][C]47.6813888888889[/C][C]-1.83138888888889[/C][/ROW]
[ROW][C]34[/C][C]53.38[/C][C]48.17[/C][C]5.21[/C][/ROW]
[ROW][C]35[/C][C]53.26[/C][C]49.43[/C][C]3.82999999999999[/C][/ROW]
[ROW][C]36[/C][C]51.8[/C][C]50.824[/C][C]0.975999999999995[/C][/ROW]
[ROW][C]37[/C][C]55.3[/C][C]54.1022777777778[/C][C]1.19772222222221[/C][/ROW]
[ROW][C]38[/C][C]57.81[/C][C]56.3542777777778[/C][C]1.45572222222223[/C][/ROW]
[ROW][C]39[/C][C]63.96[/C][C]58.7542777777778[/C][C]5.20572222222222[/C][/ROW]
[ROW][C]40[/C][C]63.77[/C][C]58.7796666666667[/C][C]4.99033333333334[/C][/ROW]
[ROW][C]41[/C][C]59.15[/C][C]58.4736666666667[/C][C]0.676333333333324[/C][/ROW]
[ROW][C]42[/C][C]56.12[/C][C]56.2036666666667[/C][C]-0.0836666666666691[/C][/ROW]
[ROW][C]43[/C][C]57.42[/C][C]56.9636666666667[/C][C]0.456333333333329[/C][/ROW]
[ROW][C]44[/C][C]63.52[/C][C]58.2696666666667[/C][C]5.25033333333334[/C][/ROW]
[ROW][C]45[/C][C]61.71[/C][C]59.2756666666667[/C][C]2.43433333333333[/C][/ROW]
[ROW][C]46[/C][C]63.01[/C][C]59.7642777777778[/C][C]3.24572222222222[/C][/ROW]
[ROW][C]47[/C][C]68.18[/C][C]61.0242777777778[/C][C]7.15572222222223[/C][/ROW]
[ROW][C]48[/C][C]72.03[/C][C]62.4182777777778[/C][C]9.61172222222221[/C][/ROW]
[ROW][C]49[/C][C]69.75[/C][C]65.6965555555555[/C][C]4.05344444444445[/C][/ROW]
[ROW][C]50[/C][C]74.41[/C][C]67.9485555555556[/C][C]6.46144444444444[/C][/ROW]
[ROW][C]51[/C][C]74.33[/C][C]70.3485555555556[/C][C]3.98144444444444[/C][/ROW]
[ROW][C]52[/C][C]64.24[/C][C]60.717[/C][C]3.52300000000000[/C][/ROW]
[ROW][C]53[/C][C]60.03[/C][C]60.411[/C][C]-0.380999999999998[/C][/ROW]
[ROW][C]54[/C][C]59.44[/C][C]58.141[/C][C]1.299[/C][/ROW]
[ROW][C]55[/C][C]62.5[/C][C]58.901[/C][C]3.599[/C][/ROW]
[ROW][C]56[/C][C]55.04[/C][C]60.207[/C][C]-5.167[/C][/ROW]
[ROW][C]57[/C][C]58.34[/C][C]61.213[/C][C]-2.873[/C][/ROW]
[ROW][C]58[/C][C]61.92[/C][C]71.3585555555556[/C][C]-9.43855555555556[/C][/ROW]
[ROW][C]59[/C][C]67.65[/C][C]72.6185555555555[/C][C]-4.96855555555555[/C][/ROW]
[ROW][C]60[/C][C]67.68[/C][C]74.0125555555556[/C][C]-6.33255555555554[/C][/ROW]
[/TABLE]
Source: https://freestatistics.org/blog/index.php?pk=25351&T=4

Globally Unique Identifier (entire table): ba.freestatistics.org/blog/index.php?pk=25351&T=4

As an alternative you can also use a QR Code:  

The GUIDs for individual cells are displayed in the table below:

Multiple Linear Regression - Actuals, Interpolation, and Residuals
Time or IndexActualsInterpolationForecastResidualsPrediction Error
124.6719.31944444444445.35055555555555
225.5921.57144444444444.01855555555556
326.0923.97144444444442.11855555555556
428.3723.99683333333334.37316666666666
527.3423.69083333333333.64916666666668
624.4621.42083333333333.03916666666666
727.4622.18083333333335.27916666666667
830.2323.48683333333336.74316666666667
932.3324.49283333333337.83716666666666
1029.8724.98144444444444.88855555555556
1124.8726.2414444444444-1.37144444444445
1225.4827.6354444444444-2.15544444444445
1327.2830.9137222222222-3.63372222222221
1428.2433.1657222222222-4.92572222222224
1529.5835.5657222222222-5.98572222222222
1626.9535.5911111111111-8.6411111111111
1729.0835.2851111111111-6.20511111111111
1828.7633.0151111111111-4.25511111111111
1929.5933.7751111111111-4.18511111111111
2030.735.0811111111111-4.38111111111111
2130.5236.0871111111111-5.56711111111111
2232.6736.5757222222222-3.90572222222222
2333.1937.8357222222222-4.64572222222223
2437.1339.2297222222222-2.09972222222222
2535.5442.508-6.968
2637.7544.76-7.00999999999999
2741.8447.16-5.32
2842.9447.1853888888889-4.24538888888889
2949.1446.87938888888892.26061111111111
3044.6144.60938888888890.000611111111112331
3140.2245.3693888888889-5.14938888888889
3244.2346.6753888888889-2.44538888888890
3345.8547.6813888888889-1.83138888888889
3453.3848.175.21
3553.2649.433.82999999999999
3651.850.8240.975999999999995
3755.354.10227777777781.19772222222221
3857.8156.35427777777781.45572222222223
3963.9658.75427777777785.20572222222222
4063.7758.77966666666674.99033333333334
4159.1558.47366666666670.676333333333324
4256.1256.2036666666667-0.0836666666666691
4357.4256.96366666666670.456333333333329
4463.5258.26966666666675.25033333333334
4561.7159.27566666666672.43433333333333
4663.0159.76427777777783.24572222222222
4768.1861.02427777777787.15572222222223
4872.0362.41827777777789.61172222222221
4969.7565.69655555555554.05344444444445
5074.4167.94855555555566.46144444444444
5174.3370.34855555555563.98144444444444
5264.2460.7173.52300000000000
5360.0360.411-0.380999999999998
5459.4458.1411.299
5562.558.9013.599
5655.0460.207-5.167
5758.3461.213-2.873
5861.9271.3585555555556-9.43855555555556
5967.6572.6185555555555-4.96855555555555
6067.6874.0125555555556-6.33255555555554


Parameters (Session):
par1 = 1 ; par2 = Include Monthly Dummies ; par3 = Linear Trend ;
Parameters (R input):
par1 = 1 ; par2 = Include Monthly Dummies ; par3 = Linear Trend ;
R code (references can be found in the software module):
library(lattice)
par1 <- as.numeric(par1)
x <- t(y)
k <- length(x[1,])
n <- length(x[,1])
x1 <- cbind(x[,par1], x[,1:k!=par1])
mycolnames <- c(colnames(x)[par1], colnames(x)[1:k!=par1])
colnames(x1) <- mycolnames #colnames(x)[par1]
x <- x1
if (par3 == 'First Differences'){
x2 <- array(0, dim=c(n-1,k), dimnames=list(1:(n-1), paste('(1-B)',colnames(x),sep='')))
for (i in 1:n-1) {
for (j in 1:k) {
x2[i,j] <- x[i+1,j] - x[i,j]
}
}
x <- x2
}
if (par2 == 'Include Monthly Dummies'){
x2 <- array(0, dim=c(n,11), dimnames=list(1:n, paste('M', seq(1:11), sep ='')))
for (i in 1:11){
x2[seq(i,n,12),i] <- 1
}
x <- cbind(x, x2)
}
if (par2 == 'Include Quarterly Dummies'){
x2 <- array(0, dim=c(n,3), dimnames=list(1:n, paste('Q', seq(1:3), sep ='')))
for (i in 1:3){
x2[seq(i,n,4),i] <- 1
}
x <- cbind(x, x2)
}
k <- length(x[1,])
if (par3 == 'Linear Trend'){
x <- cbind(x, c(1:n))
colnames(x)[k+1] <- 't'
}
x
k <- length(x[1,])
df <- as.data.frame(x)
(mylm <- lm(df))
(mysum <- summary(mylm))
bitmap(file='test0.png')
plot(x[,1], type='l', main='Actuals and Interpolation', ylab='value of Actuals and Interpolation (dots)', xlab='time or index')
points(x[,1]-mysum$resid)
grid()
dev.off()
bitmap(file='test1.png')
plot(mysum$resid, type='b', pch=19, main='Residuals', ylab='value of Residuals', xlab='time or index')
grid()
dev.off()
bitmap(file='test2.png')
hist(mysum$resid, main='Residual Histogram', xlab='values of Residuals')
grid()
dev.off()
bitmap(file='test3.png')
densityplot(~mysum$resid,col='black',main='Residual Density Plot', xlab='values of Residuals')
dev.off()
bitmap(file='test4.png')
qqnorm(mysum$resid, main='Residual Normal Q-Q Plot')
grid()
dev.off()
(myerror <- as.ts(mysum$resid))
bitmap(file='test5.png')
dum <- cbind(lag(myerror,k=1),myerror)
dum
dum1 <- dum[2:length(myerror),]
dum1
z <- as.data.frame(dum1)
z
plot(z,main=paste('Residual Lag plot, lowess, and regression line'), ylab='values of Residuals', xlab='lagged values of Residuals')
lines(lowess(z))
abline(lm(z))
grid()
dev.off()
bitmap(file='test6.png')
acf(mysum$resid, lag.max=length(mysum$resid)/2, main='Residual Autocorrelation Function')
grid()
dev.off()
bitmap(file='test7.png')
pacf(mysum$resid, lag.max=length(mysum$resid)/2, main='Residual Partial Autocorrelation Function')
grid()
dev.off()
bitmap(file='test8.png')
opar <- par(mfrow = c(2,2), oma = c(0, 0, 1.1, 0))
plot(mylm, las = 1, sub='Residual Diagnostics')
par(opar)
dev.off()
load(file='createtable')
a<-table.start()
a<-table.row.start(a)
a<-table.element(a, 'Multiple Linear Regression - Estimated Regression Equation', 1, TRUE)
a<-table.row.end(a)
myeq <- colnames(x)[1]
myeq <- paste(myeq, '[t] = ', sep='')
for (i in 1:k){
if (mysum$coefficients[i,1] > 0) myeq <- paste(myeq, '+', '')
myeq <- paste(myeq, mysum$coefficients[i,1], sep=' ')
if (rownames(mysum$coefficients)[i] != '(Intercept)') {
myeq <- paste(myeq, rownames(mysum$coefficients)[i], sep='')
if (rownames(mysum$coefficients)[i] != 't') myeq <- paste(myeq, '[t]', sep='')
}
}
myeq <- paste(myeq, ' + e[t]')
a<-table.row.start(a)
a<-table.element(a, myeq)
a<-table.row.end(a)
a<-table.end(a)
table.save(a,file='mytable1.tab')
a<-table.start()
a<-table.row.start(a)
a<-table.element(a,hyperlink('ols1.htm','Multiple Linear Regression - Ordinary Least Squares',''), 6, TRUE)
a<-table.row.end(a)
a<-table.row.start(a)
a<-table.element(a,'Variable',header=TRUE)
a<-table.element(a,'Parameter',header=TRUE)
a<-table.element(a,'S.D.',header=TRUE)
a<-table.element(a,'T-STAT
H0: parameter = 0',header=TRUE)
a<-table.element(a,'2-tail p-value',header=TRUE)
a<-table.element(a,'1-tail p-value',header=TRUE)
a<-table.row.end(a)
for (i in 1:k){
a<-table.row.start(a)
a<-table.element(a,rownames(mysum$coefficients)[i],header=TRUE)
a<-table.element(a,mysum$coefficients[i,1])
a<-table.element(a, round(mysum$coefficients[i,2],6))
a<-table.element(a, round(mysum$coefficients[i,3],4))
a<-table.element(a, round(mysum$coefficients[i,4],6))
a<-table.element(a, round(mysum$coefficients[i,4]/2,6))
a<-table.row.end(a)
}
a<-table.end(a)
table.save(a,file='mytable2.tab')
a<-table.start()
a<-table.row.start(a)
a<-table.element(a, 'Multiple Linear Regression - Regression Statistics', 2, TRUE)
a<-table.row.end(a)
a<-table.row.start(a)
a<-table.element(a, 'Multiple R',1,TRUE)
a<-table.element(a, sqrt(mysum$r.squared))
a<-table.row.end(a)
a<-table.row.start(a)
a<-table.element(a, 'R-squared',1,TRUE)
a<-table.element(a, mysum$r.squared)
a<-table.row.end(a)
a<-table.row.start(a)
a<-table.element(a, 'Adjusted R-squared',1,TRUE)
a<-table.element(a, mysum$adj.r.squared)
a<-table.row.end(a)
a<-table.row.start(a)
a<-table.element(a, 'F-TEST (value)',1,TRUE)
a<-table.element(a, mysum$fstatistic[1])
a<-table.row.end(a)
a<-table.row.start(a)
a<-table.element(a, 'F-TEST (DF numerator)',1,TRUE)
a<-table.element(a, mysum$fstatistic[2])
a<-table.row.end(a)
a<-table.row.start(a)
a<-table.element(a, 'F-TEST (DF denominator)',1,TRUE)
a<-table.element(a, mysum$fstatistic[3])
a<-table.row.end(a)
a<-table.row.start(a)
a<-table.element(a, 'p-value',1,TRUE)
a<-table.element(a, 1-pf(mysum$fstatistic[1],mysum$fstatistic[2],mysum$fstatistic[3]))
a<-table.row.end(a)
a<-table.row.start(a)
a<-table.element(a, 'Multiple Linear Regression - Residual Statistics', 2, TRUE)
a<-table.row.end(a)
a<-table.row.start(a)
a<-table.element(a, 'Residual Standard Deviation',1,TRUE)
a<-table.element(a, mysum$sigma)
a<-table.row.end(a)
a<-table.row.start(a)
a<-table.element(a, 'Sum Squared Residuals',1,TRUE)
a<-table.element(a, sum(myerror*myerror))
a<-table.row.end(a)
a<-table.end(a)
table.save(a,file='mytable3.tab')
a<-table.start()
a<-table.row.start(a)
a<-table.element(a, 'Multiple Linear Regression - Actuals, Interpolation, and Residuals', 4, TRUE)
a<-table.row.end(a)
a<-table.row.start(a)
a<-table.element(a, 'Time or Index', 1, TRUE)
a<-table.element(a, 'Actuals', 1, TRUE)
a<-table.element(a, 'Interpolation
Forecast', 1, TRUE)
a<-table.element(a, 'Residuals
Prediction Error', 1, TRUE)
a<-table.row.end(a)
for (i in 1:n) {
a<-table.row.start(a)
a<-table.element(a,i, 1, TRUE)
a<-table.element(a,x[i])
a<-table.element(a,x[i]-mysum$resid[i])
a<-table.element(a,mysum$resid[i])
a<-table.row.end(a)
}
a<-table.end(a)
table.save(a,file='mytable4.tab')