Free Statistics

of Irreproducible Research!

Author's title

Author*Unverified author*
R Software Modulerwasp_edauni.wasp
Title produced by softwareUnivariate Explorative Data Analysis
Date of computationSun, 23 Nov 2008 06:04:24 -0700
Cite this page as followsStatistical Computations at FreeStatistics.org, Office for Research Development and Education, URL https://freestatistics.org/blog/index.php?v=date/2008/Nov/23/t1227445527ifmh2uqnq529s8d.htm/, Retrieved Sun, 19 May 2024 07:20:01 +0000
Statistical Computations at FreeStatistics.org, Office for Research Development and Education, URL https://freestatistics.org/blog/index.php?pk=25243, Retrieved Sun, 19 May 2024 07:20:01 +0000
QR Codes:

Original text written by user:
IsPrivate?No (this computation is public)
User-defined keywordsVan Dooren Leen
Estimated Impact214
Family? (F = Feedback message, R = changed R code, M = changed R Module, P = changed Parameters, D = changed Data)
F     [Multiple Regression] [Taak 6 - Q1 (2)] [2008-11-16 10:42:33] [46c5a5fbda57fdfa1d4ef48658f82a0c]
F RMPD  [Univariate Explorative Data Analysis] [Taak 6 Q 2] [2008-11-19 14:06:25] [e1a46c1dcfccb0cb690f79a1a409b517]
F   PD    [Univariate Explorative Data Analysis] [Q2 task 6] [2008-11-20 17:26:46] [8eb83367d7ce233bbf617141d324189b]
F   PD        [Univariate Explorative Data Analysis] [Seatbelt Law Q2] [2008-11-23 13:04:24] [d175f84d503eb4f2a43145d5e67795b5] [Current]
Feedback Forum
2008-11-29 15:44:04 [Sofie Sergoynne] [reply
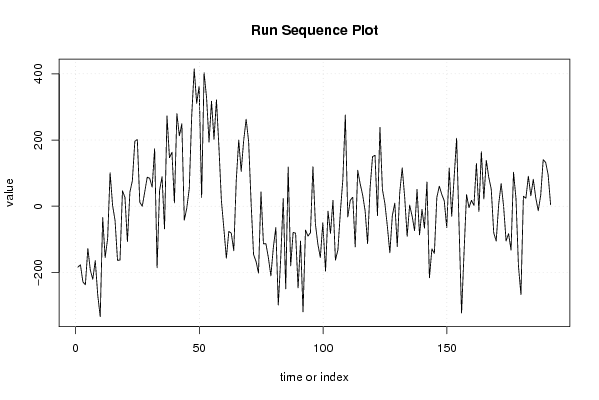
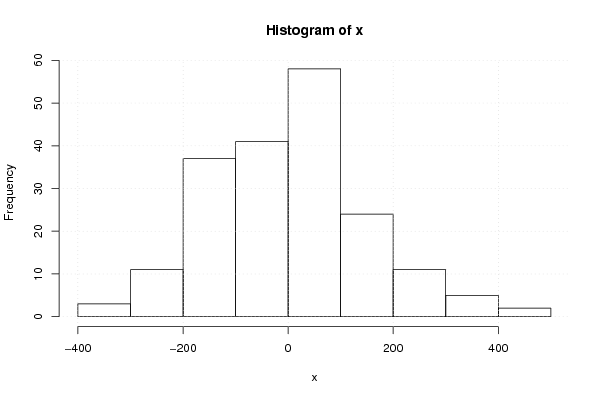
De residu's geven de voorspelllingsfouten weer. Deze zijn de verschillen tussen het aantal werkelijke verkeersslachtoffers en het aantal voorspelde verkeersslachtoffers. Normaal zou het gemiddelde van deze residu's moeten schommelen rond het gemiddelde wat in dit model absoluut niet zo is. De fouten zijn dus niet echt normaal verdeeld. Het histogram zou een normaalverdeling moeten weergeven, maar we merken toch
op dat dit hier nog niet helemaal het geval is. Hier is aan beide kanten nog een
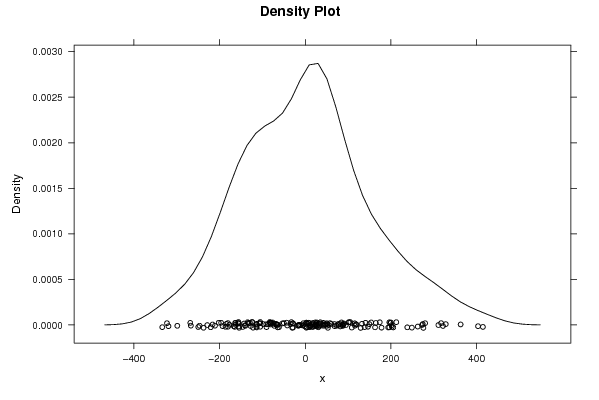
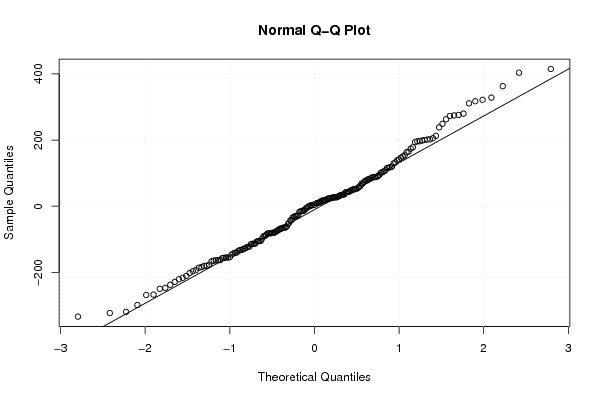
scheve verdeling te zien. Hetzelfde voor de Density Plot. Deze zou ook een normaalverdeling moeten weergeven (Gauss-curve) Dit is hier niet helemaal het geval, oa. aan de linker kant(bovenaan) heb je nog een inzakking. Voorspellingsfouten in QQplot zijn idd normaal verdeeld. Bij sommige wel enkele extremen.
2008-11-29 15:54:57 [Sofie Sergoynne] [reply
Studente geeft enkel deinterpolatie weer... terwijl ook nog andere tabellen zijn vereist zoals de Multiple Linear Regression - Regression Statistics of Multiple Linear Regression - Ordinary Least Squares.Hierut zou ze nog verschillende interessante cijfers kunnen aflezen en interpreteren. De interpretatie van haar grafiek is wel goed. Bij de residu's ben ik het toch niet helemaal eens met de student. Ze zegt dat deze naar 0 als gemiddelde zouden kunnen leiden. Maar volgens mij verschillen deze duidelijk van 0 waardoor het model nog voor verbetering vatbaar is. Bij de onderstaande grafieken kan je duidelijk zien dat deze niet normaal verdeeld zijn itt wat de student beweerd.
2008-11-29 20:34:23 [006ad2c49b6a7c2ad6ab685cfc1dae56] [reply
Ik moest bij Q2 nog een tabel toevoegen: Multiple Linear Regression - Regression Statistics. Wat ons voornamelijk interesseert in deze tabel is de “Adjusted R-squared”- waarde. Deze waarde is het percentage van de schommelingen die bestaan in het aantal slachtoffers van de verschillende maanden dat we kunnen verklaren. Volgens de tabel kunnen we dus 72% van de schommelingen verklaren. We kunnen dus besluiten dat dit een goed model is dat de realiteit goed weergeeft.

2008-12-01 14:39:51 [Stefan Temmerman] [reply
Om de voorspelling te onderzoeken, moet er gekeken worden naar verschillende factoren. De student vergeet te kijken naar de adjusted R² waarde en ook de bijhorende p waarde, welke duidt op het aantal procent van de schommelingen dat kan verklaard worden aan de hand van het model. Uit de grafiek van de residu’s van de voorspellingen, kunnen we inderdaad concluderen dat de gemiddelden niet gelijk zijn aan 0. De grafieken residual histogram, residual density plot en residual QQ-plot kunnen we afleiden dat de voorspellingsfouten min of meer gelijk verdeeld zijn. Ook vergeten te produceren is de residual lag plot. Deze vergelijkt de voorspellingen van 1 maand, met de maand ervoor. Er zou een positieve helling merkbaar zijn waardoor we de residuals kunnen voorspellen op basis van het verleden. Dit is niet goed voor het model, en zou moeten verbeterd worden. De student zeg dat de gemiddeldes, gezien de Run Sequence Plot rond 0 liggen, dit is niet waar. Er wordt hier niet echt een besluit gegeven. Het model is voor verbetering vatbaar. Een goed model mag geen autocorrelatie of patroon hebben, en het gemiddelde moet constant aan 0 gelijk zijn, wat hier niet het geval is.

Post a new message
Dataseries X:
-183,9235445
-177,0726091
-228,6351091
-237,4476091
-127,7601091
-193,0101091
-220,6351091
-164,5101091
-268,3226091
-333,6976091
-34,26010911
-154,8851091
-97,74528053
101,1056549
2,543154874
-43,26934513
-163,5818451
-162,8318451
46,54315487
26,66815487
-107,1443451
42,48065487
76,91815487
196,2931549
201,4329835
12,28391886
-0,278581137
42,90891886
87,59641886
84,34641886
57,72141886
173,8464189
-185,9660811
47,65891886
89,09641886
-68,52858114
272,6112475
146,4621829
162,8996829
10,08718285
279,7746829
212,5246829
248,8996829
-41,97531715
-5,787817149
52,83718285
274,2746829
414,6496829
310,7895114
362,6404468
26,07794684
403,2654468
327,9529468
193,7029468
317,0779468
202,2029468
321,3904468
178,0154468
16,45294684
-68,17205316
-157,0322246
-76,18128917
-81,74378917
-134,5562892
77,13121083
199,8812108
105,2562108
198,3812108
262,5687108
196,1937108
11,63121083
-145,9937892
-166,8539606
-202,0030252
43,43447482
-113,3780252
-113,6905252
-155,9405252
-210,5655252
-124,4405252
-64,25302518
-298,6280252
-154,1905252
23,18447482
-249,6756966
118,1752388
-180,3872612
-79,19976119
-81,51226119
-246,7622612
-105,3872612
-319,2622612
-72,07476119
-90,44976119
-80,01226119
119,3627388
-53,49743261
-114,6464972
-155,2089972
-50,02149721
-196,3339972
-14,58399721
-82,20899721
17,91600279
-162,8964972
-132,2714972
-16,83399721
81,54100279
275,6808314
-32,46823322
17,96926678
27,15676678
-123,1557332
108,5942668
67,96926678
34,09426678
-13,71823322
-113,0932332
54,34426678
149,7192668
153,8590954
-28,28996923
238,1475308
50,33503077
8,022530771
-61,22746923
-140,8524692
-28,72746923
9,460030771
-121,9149692
41,52253077
115,8975308
27,03735936
-91,11170524
3,325794759
-29,48670524
-73,79920524
50,95079476
-86,67420524
-9,54920524
-66,36170524
73,26329476
-216,2992052
-128,9242052
-142,7843767
27,06655875
60,50405875
35,69155875
16,37905875
-64,87094125
115,5040587
-30,37094125
87,81655875
205,4415587
-64,12094125
-322,7459413
-139,6061127
35,24482274
-4,317677263
17,86982274
2,557322737
129,3073227
-16,31767726
164,8073227
21,99482274
138,6198227
87,05732274
51,43232274
-80,42784867
-105,1918797
5,245620328
68,43312033
-0,879379672
-105,1293797
-82,75437967
-132,6293797
102,5581203
23,18312033
-180,3793797
-267,0043797
30,13544892
23,98638432
90,42388432
31,61138432
81,29888432
25,04888432
-13,57611568
33,54888432
140,7363843
132,3613843
94,79888432
4,173884316


Summary of computational transaction
Raw Inputview raw input (R code)
Raw Outputview raw output of R engine
Computing time1 seconds
R Server'George Udny Yule' @ 72.249.76.132

\begin{tabular}{lllllllll}
\hline
Summary of computational transaction \tabularnewline
Raw Input & view raw input (R code)  \tabularnewline
Raw Output & view raw output of R engine  \tabularnewline
Computing time & 1 seconds \tabularnewline
R Server & 'George Udny Yule' @ 72.249.76.132 \tabularnewline
\hline
\end{tabular}
%Source: https://freestatistics.org/blog/index.php?pk=25243&T=0

[TABLE]
[ROW][C]Summary of computational transaction[/C][/ROW]
[ROW][C]Raw Input[/C][C]view raw input (R code) [/C][/ROW]
[ROW][C]Raw Output[/C][C]view raw output of R engine [/C][/ROW]
[ROW][C]Computing time[/C][C]1 seconds[/C][/ROW]
[ROW][C]R Server[/C][C]'George Udny Yule' @ 72.249.76.132[/C][/ROW]
[/TABLE]
Source: https://freestatistics.org/blog/index.php?pk=25243&T=0

Globally Unique Identifier (entire table): ba.freestatistics.org/blog/index.php?pk=25243&T=0

As an alternative you can also use a QR Code:  

The GUIDs for individual cells are displayed in the table below:

Summary of computational transaction
Raw Inputview raw input (R code)
Raw Outputview raw output of R engine
Computing time1 seconds
R Server'George Udny Yule' @ 72.249.76.132


Descriptive Statistics
# observations192
minimum-333.6976091
Q1-105.826532175
median4.709752322
mean-8.0729257479187e-10
Q385.02414483
maximum414.6496829

\begin{tabular}{lllllllll}
\hline
Descriptive Statistics \tabularnewline
# observations & 192 \tabularnewline
minimum & -333.6976091 \tabularnewline
Q1 & -105.826532175 \tabularnewline
median & 4.709752322 \tabularnewline
mean & -8.0729257479187e-10 \tabularnewline
Q3 & 85.02414483 \tabularnewline
maximum & 414.6496829 \tabularnewline
\hline
\end{tabular}
%Source: https://freestatistics.org/blog/index.php?pk=25243&T=1

[TABLE]
[ROW][C]Descriptive Statistics[/C][/ROW]
[ROW][C]# observations[/C][C]192[/C][/ROW]
[ROW][C]minimum[/C][C]-333.6976091[/C][/ROW]
[ROW][C]Q1[/C][C]-105.826532175[/C][/ROW]
[ROW][C]median[/C][C]4.709752322[/C][/ROW]
[ROW][C]mean[/C][C]-8.0729257479187e-10[/C][/ROW]
[ROW][C]Q3[/C][C]85.02414483[/C][/ROW]
[ROW][C]maximum[/C][C]414.6496829[/C][/ROW]
[/TABLE]
Source: https://freestatistics.org/blog/index.php?pk=25243&T=1

Globally Unique Identifier (entire table): ba.freestatistics.org/blog/index.php?pk=25243&T=1

As an alternative you can also use a QR Code:  

The GUIDs for individual cells are displayed in the table below:

Descriptive Statistics
# observations192
minimum-333.6976091
Q1-105.826532175
median4.709752322
mean-8.0729257479187e-10
Q385.02414483
maximum414.6496829


Parameters (Session):
par1 = 1 ; par2 = Do not include Seasonal Dummies ; par3 = No Linear Trend ;
Parameters (R input):
par1 = 0 ; par2 = 0 ;
R code (references can be found in the software module):
par1 <- as.numeric(par1)
par2 <- as.numeric(par2)
x <- as.ts(x)
library(lattice)
bitmap(file='pic1.png')
plot(x,type='l',main='Run Sequence Plot',xlab='time or index',ylab='value')
grid()
dev.off()
bitmap(file='pic2.png')
hist(x)
grid()
dev.off()
bitmap(file='pic3.png')
if (par1 > 0)
{
densityplot(~x,col='black',main=paste('Density Plot bw = ',par1),bw=par1)
} else {
densityplot(~x,col='black',main='Density Plot')
}
dev.off()
bitmap(file='pic4.png')
qqnorm(x)
qqline(x)
grid()
dev.off()
if (par2 > 0)
{
bitmap(file='lagplot1.png')
dum <- cbind(lag(x,k=1),x)
dum
dum1 <- dum[2:length(x),]
dum1
z <- as.data.frame(dum1)
z
plot(z,main='Lag plot (k=1), lowess, and regression line')
lines(lowess(z))
abline(lm(z))
dev.off()
if (par2 > 1) {
bitmap(file='lagplotpar2.png')
dum <- cbind(lag(x,k=par2),x)
dum
dum1 <- dum[(par2+1):length(x),]
dum1
z <- as.data.frame(dum1)
z
mylagtitle <- 'Lag plot (k='
mylagtitle <- paste(mylagtitle,par2,sep='')
mylagtitle <- paste(mylagtitle,'), and lowess',sep='')
plot(z,main=mylagtitle)
lines(lowess(z))
dev.off()
}
bitmap(file='pic5.png')
acf(x,lag.max=par2,main='Autocorrelation Function')
grid()
dev.off()
}
summary(x)
load(file='createtable')
a<-table.start()
a<-table.row.start(a)
a<-table.element(a,'Descriptive Statistics',2,TRUE)
a<-table.row.end(a)
a<-table.row.start(a)
a<-table.element(a,'# observations',header=TRUE)
a<-table.element(a,length(x))
a<-table.row.end(a)
a<-table.row.start(a)
a<-table.element(a,'minimum',header=TRUE)
a<-table.element(a,min(x))
a<-table.row.end(a)
a<-table.row.start(a)
a<-table.element(a,'Q1',header=TRUE)
a<-table.element(a,quantile(x,0.25))
a<-table.row.end(a)
a<-table.row.start(a)
a<-table.element(a,'median',header=TRUE)
a<-table.element(a,median(x))
a<-table.row.end(a)
a<-table.row.start(a)
a<-table.element(a,'mean',header=TRUE)
a<-table.element(a,mean(x))
a<-table.row.end(a)
a<-table.row.start(a)
a<-table.element(a,'Q3',header=TRUE)
a<-table.element(a,quantile(x,0.75))
a<-table.row.end(a)
a<-table.row.start(a)
a<-table.element(a,'maximum',header=TRUE)
a<-table.element(a,max(x))
a<-table.row.end(a)
a<-table.end(a)
table.save(a,file='mytable.tab')