Free Statistics

of Irreproducible Research!

Author's title

Author*The author of this computation has been verified*
R Software Modulerwasp_multipleregression.wasp
Title produced by softwareMultiple Regression
Date of computationWed, 19 Nov 2008 06:54:19 -0700
Cite this page as followsStatistical Computations at FreeStatistics.org, Office for Research Development and Education, URL https://freestatistics.org/blog/index.php?v=date/2008/Nov/19/t1227103230ac1ejeqlhx03may.htm/, Retrieved Sun, 19 May 2024 07:49:46 +0000
Statistical Computations at FreeStatistics.org, Office for Research Development and Education, URL https://freestatistics.org/blog/index.php?pk=25033, Retrieved Sun, 19 May 2024 07:49:46 +0000
QR Codes:

Original text written by user:
IsPrivate?No (this computation is public)
User-defined keywords
Estimated Impact230
Family? (F = Feedback message, R = changed R code, M = changed R Module, P = changed Parameters, D = changed Data)
F     [Multiple Regression] [] [2007-11-19 19:55:31] [b731da8b544846036771bbf9bf2f34ce]
F    D    [Multiple Regression] [Regressiemodel we...] [2008-11-19 13:54:19] [e08fee3874f3333d6b7a377a061b860d] [Current]
-           [Multiple Regression] [Paper Hoofdstuk 5...] [2008-12-12 11:48:14] [6fea0e9a9b3b29a63badf2c274e82506]
Feedback Forum
2008-11-29 14:16:33 [Michael Van Spaandonck] [reply
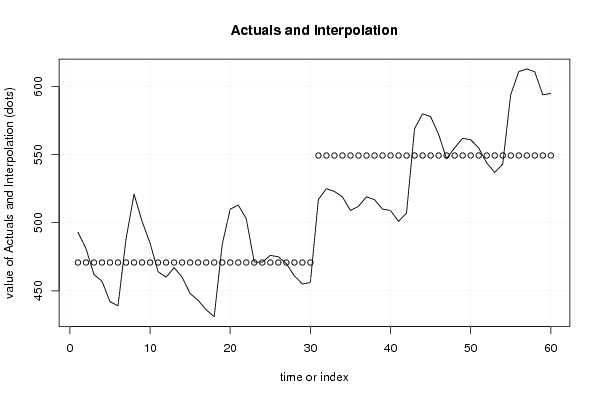
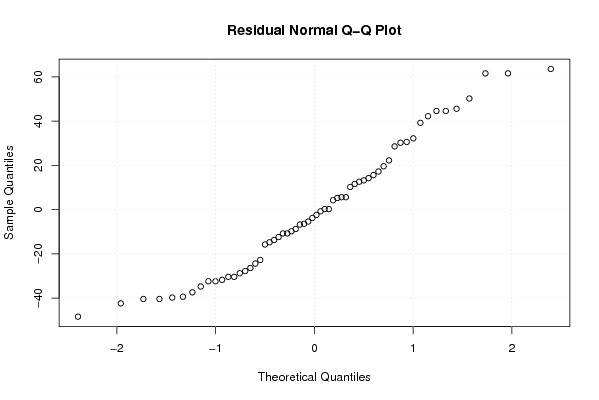
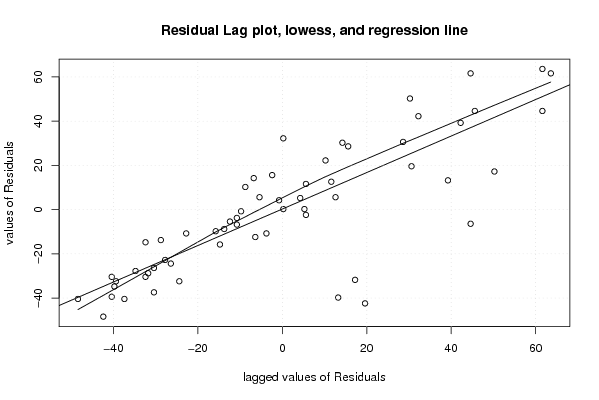
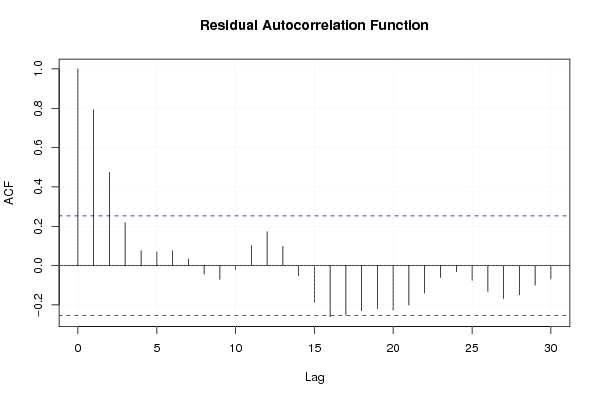
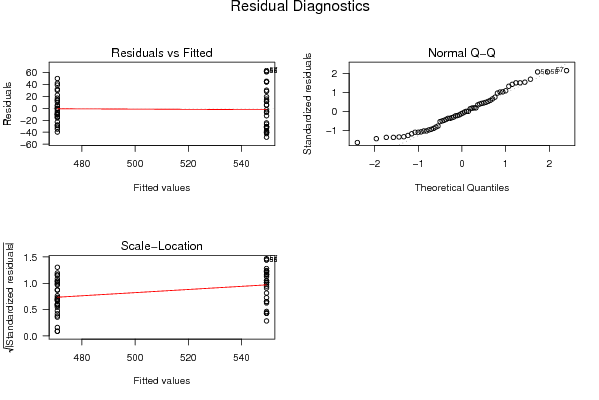
Hier zien we een model dat geen rekening houdt met seasonal dummies of een lange termijntrend.

We zien dat vanaf waarneming 31 dee werkloosheid constant hoger ligt dan in de periodes ervoor. We hebben daarom in de tweede invoerkolom t/m waarneming 30 telkens een 0 ingevoerd, vanaf waarneming 31 telkens een 1 omdat we vermoeden dat er hier iets heeft plaatsgevonden dat de werkloosheid voor minstens een middellange termijn de hoogte in gestuwd heeft.

Om de tijdreeks te verklaren aan de hand van seasonal dummies en een lineaire trend, wordt verwezen naar volgende berekening:
http://www.freestatistics.org/blog/index.php?v=date/2008/Nov/19/t1227104073worzbcthhxcdg34.htm

Post a new message
Dataseries X:
493.000	0
481.000	0
462.000	0
457.000	0
442.000	0
439.000	0
488.000	0
521.000	0
501.000	0
485.000	0
464.000	0
460.000	0
467.000	0
460.000	0
448.000	0
443.000	0
436.000	0
431.000	0
484.000	0
510.000	0
513.000	0
503.000	0
471.000	0
471.000	0
476.000	0
475.000	0
470.000	0
461.000	0
455.000	0
456.000	0
517.000	1
525.000	1
523.000	1
519.000	1
509.000	1
512.000	1
519.000	1
517.000	1
510.000	1
509.000	1
501.000	1
507.000	1
569.000	1
580.000	1
578.000	1
565.000	1
547.000	1
555.000	1
562.000	1
561.000	1
555.000	1
544.000	1
537.000	1
543.000	1
594.000	1
611.000	1
613.000	1
611.000	1
594.000	1
595.000	1


Summary of computational transaction
Raw Inputview raw input (R code)
Raw Outputview raw output of R engine
Computing time3 seconds
R Server'George Udny Yule' @ 72.249.76.132

\begin{tabular}{lllllllll}
\hline
Summary of computational transaction \tabularnewline
Raw Input & view raw input (R code)  \tabularnewline
Raw Output & view raw output of R engine  \tabularnewline
Computing time & 3 seconds \tabularnewline
R Server & 'George Udny Yule' @ 72.249.76.132 \tabularnewline
\hline
\end{tabular}
%Source: https://freestatistics.org/blog/index.php?pk=25033&T=0

[TABLE]
[ROW][C]Summary of computational transaction[/C][/ROW]
[ROW][C]Raw Input[/C][C]view raw input (R code) [/C][/ROW]
[ROW][C]Raw Output[/C][C]view raw output of R engine [/C][/ROW]
[ROW][C]Computing time[/C][C]3 seconds[/C][/ROW]
[ROW][C]R Server[/C][C]'George Udny Yule' @ 72.249.76.132[/C][/ROW]
[/TABLE]
Source: https://freestatistics.org/blog/index.php?pk=25033&T=0

Globally Unique Identifier (entire table): ba.freestatistics.org/blog/index.php?pk=25033&T=0

As an alternative you can also use a QR Code:  

The GUIDs for individual cells are displayed in the table below:

Summary of computational transaction
Raw Inputview raw input (R code)
Raw Outputview raw output of R engine
Computing time3 seconds
R Server'George Udny Yule' @ 72.249.76.132


Multiple Linear Regression - Estimated Regression Equation
y[t] = + 470.766666666666 + 78.6333333333334x[t] + e[t]

\begin{tabular}{lllllllll}
\hline
Multiple Linear Regression - Estimated Regression Equation \tabularnewline
y[t] =  +  470.766666666666 +  78.6333333333334x[t]  + e[t] \tabularnewline
\hline
\end{tabular}
%Source: https://freestatistics.org/blog/index.php?pk=25033&T=1

[TABLE]
[ROW][C]Multiple Linear Regression - Estimated Regression Equation[/C][/ROW]
[ROW][C]y[t] =  +  470.766666666666 +  78.6333333333334x[t]  + e[t][/C][/ROW]
[/TABLE]
Source: https://freestatistics.org/blog/index.php?pk=25033&T=1

Globally Unique Identifier (entire table): ba.freestatistics.org/blog/index.php?pk=25033&T=1

As an alternative you can also use a QR Code:  

The GUIDs for individual cells are displayed in the table below:

Multiple Linear Regression - Estimated Regression Equation
y[t] = + 470.766666666666 + 78.6333333333334x[t] + e[t]


Multiple Linear Regression - Ordinary Least Squares
VariableParameterS.D.T-STATH0: parameter = 02-tail p-value1-tail p-value
(Intercept)470.7666666666665.48826285.77700
x78.63333333333347.76157410.131100

\begin{tabular}{lllllllll}
\hline
Multiple Linear Regression - Ordinary Least Squares \tabularnewline
Variable & Parameter & S.D. & T-STATH0: parameter = 0 & 2-tail p-value & 1-tail p-value \tabularnewline
(Intercept) & 470.766666666666 & 5.488262 & 85.777 & 0 & 0 \tabularnewline
x & 78.6333333333334 & 7.761574 & 10.1311 & 0 & 0 \tabularnewline
\hline
\end{tabular}
%Source: https://freestatistics.org/blog/index.php?pk=25033&T=2

[TABLE]
[ROW][C]Multiple Linear Regression - Ordinary Least Squares[/C][/ROW]
[ROW][C]Variable[/C][C]Parameter[/C][C]S.D.[/C][C]T-STATH0: parameter = 0[/C][C]2-tail p-value[/C][C]1-tail p-value[/C][/ROW]
[ROW][C](Intercept)[/C][C]470.766666666666[/C][C]5.488262[/C][C]85.777[/C][C]0[/C][C]0[/C][/ROW]
[ROW][C]x[/C][C]78.6333333333334[/C][C]7.761574[/C][C]10.1311[/C][C]0[/C][C]0[/C][/ROW]
[/TABLE]
Source: https://freestatistics.org/blog/index.php?pk=25033&T=2

Globally Unique Identifier (entire table): ba.freestatistics.org/blog/index.php?pk=25033&T=2

As an alternative you can also use a QR Code:  

The GUIDs for individual cells are displayed in the table below:

Multiple Linear Regression - Ordinary Least Squares
VariableParameterS.D.T-STATH0: parameter = 02-tail p-value1-tail p-value
(Intercept)470.7666666666665.48826285.77700
x78.63333333333347.76157410.131100


Multiple Linear Regression - Regression Statistics
Multiple R0.799338912214053
R-squared0.638942696579546
Adjusted R-squared0.632717570658503
F-TEST (value)102.639320823982
F-TEST (DF numerator)1
F-TEST (DF denominator)58
p-value1.90958360235527e-14
Multiple Linear Regression - Residual Statistics
Residual Standard Deviation30.0604467659766
Sum Squared Residuals52410.5666666666

\begin{tabular}{lllllllll}
\hline
Multiple Linear Regression - Regression Statistics \tabularnewline
Multiple R & 0.799338912214053 \tabularnewline
R-squared & 0.638942696579546 \tabularnewline
Adjusted R-squared & 0.632717570658503 \tabularnewline
F-TEST (value) & 102.639320823982 \tabularnewline
F-TEST (DF numerator) & 1 \tabularnewline
F-TEST (DF denominator) & 58 \tabularnewline
p-value & 1.90958360235527e-14 \tabularnewline
Multiple Linear Regression - Residual Statistics \tabularnewline
Residual Standard Deviation & 30.0604467659766 \tabularnewline
Sum Squared Residuals & 52410.5666666666 \tabularnewline
\hline
\end{tabular}
%Source: https://freestatistics.org/blog/index.php?pk=25033&T=3

[TABLE]
[ROW][C]Multiple Linear Regression - Regression Statistics[/C][/ROW]
[ROW][C]Multiple R[/C][C]0.799338912214053[/C][/ROW]
[ROW][C]R-squared[/C][C]0.638942696579546[/C][/ROW]
[ROW][C]Adjusted R-squared[/C][C]0.632717570658503[/C][/ROW]
[ROW][C]F-TEST (value)[/C][C]102.639320823982[/C][/ROW]
[ROW][C]F-TEST (DF numerator)[/C][C]1[/C][/ROW]
[ROW][C]F-TEST (DF denominator)[/C][C]58[/C][/ROW]
[ROW][C]p-value[/C][C]1.90958360235527e-14[/C][/ROW]
[ROW][C]Multiple Linear Regression - Residual Statistics[/C][/ROW]
[ROW][C]Residual Standard Deviation[/C][C]30.0604467659766[/C][/ROW]
[ROW][C]Sum Squared Residuals[/C][C]52410.5666666666[/C][/ROW]
[/TABLE]
Source: https://freestatistics.org/blog/index.php?pk=25033&T=3

Globally Unique Identifier (entire table): ba.freestatistics.org/blog/index.php?pk=25033&T=3

As an alternative you can also use a QR Code:  

The GUIDs for individual cells are displayed in the table below:

Multiple Linear Regression - Regression Statistics
Multiple R0.799338912214053
R-squared0.638942696579546
Adjusted R-squared0.632717570658503
F-TEST (value)102.639320823982
F-TEST (DF numerator)1
F-TEST (DF denominator)58
p-value1.90958360235527e-14
Multiple Linear Regression - Residual Statistics
Residual Standard Deviation30.0604467659766
Sum Squared Residuals52410.5666666666


Multiple Linear Regression - Actuals, Interpolation, and Residuals
Time or IndexActualsInterpolationForecastResidualsPrediction Error
1493470.76666666666822.2333333333317
2481470.76666666666710.2333333333334
3462470.766666666667-8.7666666666666
4457470.766666666667-13.7666666666666
5442470.766666666667-28.7666666666666
6439470.766666666667-31.7666666666666
7488470.76666666666717.2333333333334
8521470.76666666666750.2333333333334
9501470.76666666666730.2333333333334
10485470.76666666666714.2333333333334
11464470.766666666667-6.7666666666666
12460470.766666666667-10.7666666666666
13467470.766666666667-3.76666666666661
14460470.766666666667-10.7666666666666
15448470.766666666667-22.7666666666666
16443470.766666666667-27.7666666666666
17436470.766666666667-34.7666666666666
18431470.766666666667-39.7666666666666
19484470.76666666666713.2333333333334
20510470.76666666666739.2333333333334
21513470.76666666666742.2333333333334
22503470.76666666666732.2333333333334
23471470.7666666666670.233333333333393
24471470.7666666666670.233333333333393
25476470.7666666666675.23333333333339
26475470.7666666666674.23333333333339
27470470.766666666667-0.766666666666607
28461470.766666666667-9.7666666666666
29455470.766666666667-15.7666666666666
30456470.766666666667-14.7666666666666
31517549.4-32.4
32525549.4-24.4
33523549.4-26.4
34519549.4-30.4
35509549.4-40.4
36512549.4-37.4
37519549.4-30.4
38517549.4-32.4
39510549.4-39.4
40509549.4-40.4
41501549.4-48.4
42507549.4-42.4
43569549.419.6
44580549.430.6
45578549.428.6
46565549.415.6
47547549.4-2.40000000000000
48555549.45.6
49562549.412.6
50561549.411.6
51555549.45.6
52544549.4-5.4
53537549.4-12.4
54543549.4-6.4
55594549.444.6
56611549.461.6
57613549.463.6
58611549.461.6
59594549.444.6
60595549.445.6

\begin{tabular}{lllllllll}
\hline
Multiple Linear Regression - Actuals, Interpolation, and Residuals \tabularnewline
Time or Index & Actuals & InterpolationForecast & ResidualsPrediction Error \tabularnewline
1 & 493 & 470.766666666668 & 22.2333333333317 \tabularnewline
2 & 481 & 470.766666666667 & 10.2333333333334 \tabularnewline
3 & 462 & 470.766666666667 & -8.7666666666666 \tabularnewline
4 & 457 & 470.766666666667 & -13.7666666666666 \tabularnewline
5 & 442 & 470.766666666667 & -28.7666666666666 \tabularnewline
6 & 439 & 470.766666666667 & -31.7666666666666 \tabularnewline
7 & 488 & 470.766666666667 & 17.2333333333334 \tabularnewline
8 & 521 & 470.766666666667 & 50.2333333333334 \tabularnewline
9 & 501 & 470.766666666667 & 30.2333333333334 \tabularnewline
10 & 485 & 470.766666666667 & 14.2333333333334 \tabularnewline
11 & 464 & 470.766666666667 & -6.7666666666666 \tabularnewline
12 & 460 & 470.766666666667 & -10.7666666666666 \tabularnewline
13 & 467 & 470.766666666667 & -3.76666666666661 \tabularnewline
14 & 460 & 470.766666666667 & -10.7666666666666 \tabularnewline
15 & 448 & 470.766666666667 & -22.7666666666666 \tabularnewline
16 & 443 & 470.766666666667 & -27.7666666666666 \tabularnewline
17 & 436 & 470.766666666667 & -34.7666666666666 \tabularnewline
18 & 431 & 470.766666666667 & -39.7666666666666 \tabularnewline
19 & 484 & 470.766666666667 & 13.2333333333334 \tabularnewline
20 & 510 & 470.766666666667 & 39.2333333333334 \tabularnewline
21 & 513 & 470.766666666667 & 42.2333333333334 \tabularnewline
22 & 503 & 470.766666666667 & 32.2333333333334 \tabularnewline
23 & 471 & 470.766666666667 & 0.233333333333393 \tabularnewline
24 & 471 & 470.766666666667 & 0.233333333333393 \tabularnewline
25 & 476 & 470.766666666667 & 5.23333333333339 \tabularnewline
26 & 475 & 470.766666666667 & 4.23333333333339 \tabularnewline
27 & 470 & 470.766666666667 & -0.766666666666607 \tabularnewline
28 & 461 & 470.766666666667 & -9.7666666666666 \tabularnewline
29 & 455 & 470.766666666667 & -15.7666666666666 \tabularnewline
30 & 456 & 470.766666666667 & -14.7666666666666 \tabularnewline
31 & 517 & 549.4 & -32.4 \tabularnewline
32 & 525 & 549.4 & -24.4 \tabularnewline
33 & 523 & 549.4 & -26.4 \tabularnewline
34 & 519 & 549.4 & -30.4 \tabularnewline
35 & 509 & 549.4 & -40.4 \tabularnewline
36 & 512 & 549.4 & -37.4 \tabularnewline
37 & 519 & 549.4 & -30.4 \tabularnewline
38 & 517 & 549.4 & -32.4 \tabularnewline
39 & 510 & 549.4 & -39.4 \tabularnewline
40 & 509 & 549.4 & -40.4 \tabularnewline
41 & 501 & 549.4 & -48.4 \tabularnewline
42 & 507 & 549.4 & -42.4 \tabularnewline
43 & 569 & 549.4 & 19.6 \tabularnewline
44 & 580 & 549.4 & 30.6 \tabularnewline
45 & 578 & 549.4 & 28.6 \tabularnewline
46 & 565 & 549.4 & 15.6 \tabularnewline
47 & 547 & 549.4 & -2.40000000000000 \tabularnewline
48 & 555 & 549.4 & 5.6 \tabularnewline
49 & 562 & 549.4 & 12.6 \tabularnewline
50 & 561 & 549.4 & 11.6 \tabularnewline
51 & 555 & 549.4 & 5.6 \tabularnewline
52 & 544 & 549.4 & -5.4 \tabularnewline
53 & 537 & 549.4 & -12.4 \tabularnewline
54 & 543 & 549.4 & -6.4 \tabularnewline
55 & 594 & 549.4 & 44.6 \tabularnewline
56 & 611 & 549.4 & 61.6 \tabularnewline
57 & 613 & 549.4 & 63.6 \tabularnewline
58 & 611 & 549.4 & 61.6 \tabularnewline
59 & 594 & 549.4 & 44.6 \tabularnewline
60 & 595 & 549.4 & 45.6 \tabularnewline
\hline
\end{tabular}
%Source: https://freestatistics.org/blog/index.php?pk=25033&T=4

[TABLE]
[ROW][C]Multiple Linear Regression - Actuals, Interpolation, and Residuals[/C][/ROW]
[ROW][C]Time or Index[/C][C]Actuals[/C][C]InterpolationForecast[/C][C]ResidualsPrediction Error[/C][/ROW]
[ROW][C]1[/C][C]493[/C][C]470.766666666668[/C][C]22.2333333333317[/C][/ROW]
[ROW][C]2[/C][C]481[/C][C]470.766666666667[/C][C]10.2333333333334[/C][/ROW]
[ROW][C]3[/C][C]462[/C][C]470.766666666667[/C][C]-8.7666666666666[/C][/ROW]
[ROW][C]4[/C][C]457[/C][C]470.766666666667[/C][C]-13.7666666666666[/C][/ROW]
[ROW][C]5[/C][C]442[/C][C]470.766666666667[/C][C]-28.7666666666666[/C][/ROW]
[ROW][C]6[/C][C]439[/C][C]470.766666666667[/C][C]-31.7666666666666[/C][/ROW]
[ROW][C]7[/C][C]488[/C][C]470.766666666667[/C][C]17.2333333333334[/C][/ROW]
[ROW][C]8[/C][C]521[/C][C]470.766666666667[/C][C]50.2333333333334[/C][/ROW]
[ROW][C]9[/C][C]501[/C][C]470.766666666667[/C][C]30.2333333333334[/C][/ROW]
[ROW][C]10[/C][C]485[/C][C]470.766666666667[/C][C]14.2333333333334[/C][/ROW]
[ROW][C]11[/C][C]464[/C][C]470.766666666667[/C][C]-6.7666666666666[/C][/ROW]
[ROW][C]12[/C][C]460[/C][C]470.766666666667[/C][C]-10.7666666666666[/C][/ROW]
[ROW][C]13[/C][C]467[/C][C]470.766666666667[/C][C]-3.76666666666661[/C][/ROW]
[ROW][C]14[/C][C]460[/C][C]470.766666666667[/C][C]-10.7666666666666[/C][/ROW]
[ROW][C]15[/C][C]448[/C][C]470.766666666667[/C][C]-22.7666666666666[/C][/ROW]
[ROW][C]16[/C][C]443[/C][C]470.766666666667[/C][C]-27.7666666666666[/C][/ROW]
[ROW][C]17[/C][C]436[/C][C]470.766666666667[/C][C]-34.7666666666666[/C][/ROW]
[ROW][C]18[/C][C]431[/C][C]470.766666666667[/C][C]-39.7666666666666[/C][/ROW]
[ROW][C]19[/C][C]484[/C][C]470.766666666667[/C][C]13.2333333333334[/C][/ROW]
[ROW][C]20[/C][C]510[/C][C]470.766666666667[/C][C]39.2333333333334[/C][/ROW]
[ROW][C]21[/C][C]513[/C][C]470.766666666667[/C][C]42.2333333333334[/C][/ROW]
[ROW][C]22[/C][C]503[/C][C]470.766666666667[/C][C]32.2333333333334[/C][/ROW]
[ROW][C]23[/C][C]471[/C][C]470.766666666667[/C][C]0.233333333333393[/C][/ROW]
[ROW][C]24[/C][C]471[/C][C]470.766666666667[/C][C]0.233333333333393[/C][/ROW]
[ROW][C]25[/C][C]476[/C][C]470.766666666667[/C][C]5.23333333333339[/C][/ROW]
[ROW][C]26[/C][C]475[/C][C]470.766666666667[/C][C]4.23333333333339[/C][/ROW]
[ROW][C]27[/C][C]470[/C][C]470.766666666667[/C][C]-0.766666666666607[/C][/ROW]
[ROW][C]28[/C][C]461[/C][C]470.766666666667[/C][C]-9.7666666666666[/C][/ROW]
[ROW][C]29[/C][C]455[/C][C]470.766666666667[/C][C]-15.7666666666666[/C][/ROW]
[ROW][C]30[/C][C]456[/C][C]470.766666666667[/C][C]-14.7666666666666[/C][/ROW]
[ROW][C]31[/C][C]517[/C][C]549.4[/C][C]-32.4[/C][/ROW]
[ROW][C]32[/C][C]525[/C][C]549.4[/C][C]-24.4[/C][/ROW]
[ROW][C]33[/C][C]523[/C][C]549.4[/C][C]-26.4[/C][/ROW]
[ROW][C]34[/C][C]519[/C][C]549.4[/C][C]-30.4[/C][/ROW]
[ROW][C]35[/C][C]509[/C][C]549.4[/C][C]-40.4[/C][/ROW]
[ROW][C]36[/C][C]512[/C][C]549.4[/C][C]-37.4[/C][/ROW]
[ROW][C]37[/C][C]519[/C][C]549.4[/C][C]-30.4[/C][/ROW]
[ROW][C]38[/C][C]517[/C][C]549.4[/C][C]-32.4[/C][/ROW]
[ROW][C]39[/C][C]510[/C][C]549.4[/C][C]-39.4[/C][/ROW]
[ROW][C]40[/C][C]509[/C][C]549.4[/C][C]-40.4[/C][/ROW]
[ROW][C]41[/C][C]501[/C][C]549.4[/C][C]-48.4[/C][/ROW]
[ROW][C]42[/C][C]507[/C][C]549.4[/C][C]-42.4[/C][/ROW]
[ROW][C]43[/C][C]569[/C][C]549.4[/C][C]19.6[/C][/ROW]
[ROW][C]44[/C][C]580[/C][C]549.4[/C][C]30.6[/C][/ROW]
[ROW][C]45[/C][C]578[/C][C]549.4[/C][C]28.6[/C][/ROW]
[ROW][C]46[/C][C]565[/C][C]549.4[/C][C]15.6[/C][/ROW]
[ROW][C]47[/C][C]547[/C][C]549.4[/C][C]-2.40000000000000[/C][/ROW]
[ROW][C]48[/C][C]555[/C][C]549.4[/C][C]5.6[/C][/ROW]
[ROW][C]49[/C][C]562[/C][C]549.4[/C][C]12.6[/C][/ROW]
[ROW][C]50[/C][C]561[/C][C]549.4[/C][C]11.6[/C][/ROW]
[ROW][C]51[/C][C]555[/C][C]549.4[/C][C]5.6[/C][/ROW]
[ROW][C]52[/C][C]544[/C][C]549.4[/C][C]-5.4[/C][/ROW]
[ROW][C]53[/C][C]537[/C][C]549.4[/C][C]-12.4[/C][/ROW]
[ROW][C]54[/C][C]543[/C][C]549.4[/C][C]-6.4[/C][/ROW]
[ROW][C]55[/C][C]594[/C][C]549.4[/C][C]44.6[/C][/ROW]
[ROW][C]56[/C][C]611[/C][C]549.4[/C][C]61.6[/C][/ROW]
[ROW][C]57[/C][C]613[/C][C]549.4[/C][C]63.6[/C][/ROW]
[ROW][C]58[/C][C]611[/C][C]549.4[/C][C]61.6[/C][/ROW]
[ROW][C]59[/C][C]594[/C][C]549.4[/C][C]44.6[/C][/ROW]
[ROW][C]60[/C][C]595[/C][C]549.4[/C][C]45.6[/C][/ROW]
[/TABLE]
Source: https://freestatistics.org/blog/index.php?pk=25033&T=4

Globally Unique Identifier (entire table): ba.freestatistics.org/blog/index.php?pk=25033&T=4

As an alternative you can also use a QR Code:  

The GUIDs for individual cells are displayed in the table below:

Multiple Linear Regression - Actuals, Interpolation, and Residuals
Time or IndexActualsInterpolationForecastResidualsPrediction Error
1493470.76666666666822.2333333333317
2481470.76666666666710.2333333333334
3462470.766666666667-8.7666666666666
4457470.766666666667-13.7666666666666
5442470.766666666667-28.7666666666666
6439470.766666666667-31.7666666666666
7488470.76666666666717.2333333333334
8521470.76666666666750.2333333333334
9501470.76666666666730.2333333333334
10485470.76666666666714.2333333333334
11464470.766666666667-6.7666666666666
12460470.766666666667-10.7666666666666
13467470.766666666667-3.76666666666661
14460470.766666666667-10.7666666666666
15448470.766666666667-22.7666666666666
16443470.766666666667-27.7666666666666
17436470.766666666667-34.7666666666666
18431470.766666666667-39.7666666666666
19484470.76666666666713.2333333333334
20510470.76666666666739.2333333333334
21513470.76666666666742.2333333333334
22503470.76666666666732.2333333333334
23471470.7666666666670.233333333333393
24471470.7666666666670.233333333333393
25476470.7666666666675.23333333333339
26475470.7666666666674.23333333333339
27470470.766666666667-0.766666666666607
28461470.766666666667-9.7666666666666
29455470.766666666667-15.7666666666666
30456470.766666666667-14.7666666666666
31517549.4-32.4
32525549.4-24.4
33523549.4-26.4
34519549.4-30.4
35509549.4-40.4
36512549.4-37.4
37519549.4-30.4
38517549.4-32.4
39510549.4-39.4
40509549.4-40.4
41501549.4-48.4
42507549.4-42.4
43569549.419.6
44580549.430.6
45578549.428.6
46565549.415.6
47547549.4-2.40000000000000
48555549.45.6
49562549.412.6
50561549.411.6
51555549.45.6
52544549.4-5.4
53537549.4-12.4
54543549.4-6.4
55594549.444.6
56611549.461.6
57613549.463.6
58611549.461.6
59594549.444.6
60595549.445.6


Parameters (Session):
par1 = 1 ; par2 = Do not include Seasonal Dummies ; par3 = No Linear Trend ;
Parameters (R input):
par1 = 1 ; par2 = Do not include Seasonal Dummies ; par3 = No Linear Trend ;
R code (references can be found in the software module):
library(lattice)
par1 <- as.numeric(par1)
x <- t(y)
k <- length(x[1,])
n <- length(x[,1])
x1 <- cbind(x[,par1], x[,1:k!=par1])
mycolnames <- c(colnames(x)[par1], colnames(x)[1:k!=par1])
colnames(x1) <- mycolnames #colnames(x)[par1]
x <- x1
if (par3 == 'First Differences'){
x2 <- array(0, dim=c(n-1,k), dimnames=list(1:(n-1), paste('(1-B)',colnames(x),sep='')))
for (i in 1:n-1) {
for (j in 1:k) {
x2[i,j] <- x[i+1,j] - x[i,j]
}
}
x <- x2
}
if (par2 == 'Include Monthly Dummies'){
x2 <- array(0, dim=c(n,11), dimnames=list(1:n, paste('M', seq(1:11), sep ='')))
for (i in 1:11){
x2[seq(i,n,12),i] <- 1
}
x <- cbind(x, x2)
}
if (par2 == 'Include Quarterly Dummies'){
x2 <- array(0, dim=c(n,3), dimnames=list(1:n, paste('Q', seq(1:3), sep ='')))
for (i in 1:3){
x2[seq(i,n,4),i] <- 1
}
x <- cbind(x, x2)
}
k <- length(x[1,])
if (par3 == 'Linear Trend'){
x <- cbind(x, c(1:n))
colnames(x)[k+1] <- 't'
}
x
k <- length(x[1,])
df <- as.data.frame(x)
(mylm <- lm(df))
(mysum <- summary(mylm))
bitmap(file='test0.png')
plot(x[,1], type='l', main='Actuals and Interpolation', ylab='value of Actuals and Interpolation (dots)', xlab='time or index')
points(x[,1]-mysum$resid)
grid()
dev.off()
bitmap(file='test1.png')
plot(mysum$resid, type='b', pch=19, main='Residuals', ylab='value of Residuals', xlab='time or index')
grid()
dev.off()
bitmap(file='test2.png')
hist(mysum$resid, main='Residual Histogram', xlab='values of Residuals')
grid()
dev.off()
bitmap(file='test3.png')
densityplot(~mysum$resid,col='black',main='Residual Density Plot', xlab='values of Residuals')
dev.off()
bitmap(file='test4.png')
qqnorm(mysum$resid, main='Residual Normal Q-Q Plot')
grid()
dev.off()
(myerror <- as.ts(mysum$resid))
bitmap(file='test5.png')
dum <- cbind(lag(myerror,k=1),myerror)
dum
dum1 <- dum[2:length(myerror),]
dum1
z <- as.data.frame(dum1)
z
plot(z,main=paste('Residual Lag plot, lowess, and regression line'), ylab='values of Residuals', xlab='lagged values of Residuals')
lines(lowess(z))
abline(lm(z))
grid()
dev.off()
bitmap(file='test6.png')
acf(mysum$resid, lag.max=length(mysum$resid)/2, main='Residual Autocorrelation Function')
grid()
dev.off()
bitmap(file='test7.png')
pacf(mysum$resid, lag.max=length(mysum$resid)/2, main='Residual Partial Autocorrelation Function')
grid()
dev.off()
bitmap(file='test8.png')
opar <- par(mfrow = c(2,2), oma = c(0, 0, 1.1, 0))
plot(mylm, las = 1, sub='Residual Diagnostics')
par(opar)
dev.off()
load(file='createtable')
a<-table.start()
a<-table.row.start(a)
a<-table.element(a, 'Multiple Linear Regression - Estimated Regression Equation', 1, TRUE)
a<-table.row.end(a)
myeq <- colnames(x)[1]
myeq <- paste(myeq, '[t] = ', sep='')
for (i in 1:k){
if (mysum$coefficients[i,1] > 0) myeq <- paste(myeq, '+', '')
myeq <- paste(myeq, mysum$coefficients[i,1], sep=' ')
if (rownames(mysum$coefficients)[i] != '(Intercept)') {
myeq <- paste(myeq, rownames(mysum$coefficients)[i], sep='')
if (rownames(mysum$coefficients)[i] != 't') myeq <- paste(myeq, '[t]', sep='')
}
}
myeq <- paste(myeq, ' + e[t]')
a<-table.row.start(a)
a<-table.element(a, myeq)
a<-table.row.end(a)
a<-table.end(a)
table.save(a,file='mytable1.tab')
a<-table.start()
a<-table.row.start(a)
a<-table.element(a,hyperlink('ols1.htm','Multiple Linear Regression - Ordinary Least Squares',''), 6, TRUE)
a<-table.row.end(a)
a<-table.row.start(a)
a<-table.element(a,'Variable',header=TRUE)
a<-table.element(a,'Parameter',header=TRUE)
a<-table.element(a,'S.D.',header=TRUE)
a<-table.element(a,'T-STAT
H0: parameter = 0',header=TRUE)
a<-table.element(a,'2-tail p-value',header=TRUE)
a<-table.element(a,'1-tail p-value',header=TRUE)
a<-table.row.end(a)
for (i in 1:k){
a<-table.row.start(a)
a<-table.element(a,rownames(mysum$coefficients)[i],header=TRUE)
a<-table.element(a,mysum$coefficients[i,1])
a<-table.element(a, round(mysum$coefficients[i,2],6))
a<-table.element(a, round(mysum$coefficients[i,3],4))
a<-table.element(a, round(mysum$coefficients[i,4],6))
a<-table.element(a, round(mysum$coefficients[i,4]/2,6))
a<-table.row.end(a)
}
a<-table.end(a)
table.save(a,file='mytable2.tab')
a<-table.start()
a<-table.row.start(a)
a<-table.element(a, 'Multiple Linear Regression - Regression Statistics', 2, TRUE)
a<-table.row.end(a)
a<-table.row.start(a)
a<-table.element(a, 'Multiple R',1,TRUE)
a<-table.element(a, sqrt(mysum$r.squared))
a<-table.row.end(a)
a<-table.row.start(a)
a<-table.element(a, 'R-squared',1,TRUE)
a<-table.element(a, mysum$r.squared)
a<-table.row.end(a)
a<-table.row.start(a)
a<-table.element(a, 'Adjusted R-squared',1,TRUE)
a<-table.element(a, mysum$adj.r.squared)
a<-table.row.end(a)
a<-table.row.start(a)
a<-table.element(a, 'F-TEST (value)',1,TRUE)
a<-table.element(a, mysum$fstatistic[1])
a<-table.row.end(a)
a<-table.row.start(a)
a<-table.element(a, 'F-TEST (DF numerator)',1,TRUE)
a<-table.element(a, mysum$fstatistic[2])
a<-table.row.end(a)
a<-table.row.start(a)
a<-table.element(a, 'F-TEST (DF denominator)',1,TRUE)
a<-table.element(a, mysum$fstatistic[3])
a<-table.row.end(a)
a<-table.row.start(a)
a<-table.element(a, 'p-value',1,TRUE)
a<-table.element(a, 1-pf(mysum$fstatistic[1],mysum$fstatistic[2],mysum$fstatistic[3]))
a<-table.row.end(a)
a<-table.row.start(a)
a<-table.element(a, 'Multiple Linear Regression - Residual Statistics', 2, TRUE)
a<-table.row.end(a)
a<-table.row.start(a)
a<-table.element(a, 'Residual Standard Deviation',1,TRUE)
a<-table.element(a, mysum$sigma)
a<-table.row.end(a)
a<-table.row.start(a)
a<-table.element(a, 'Sum Squared Residuals',1,TRUE)
a<-table.element(a, sum(myerror*myerror))
a<-table.row.end(a)
a<-table.end(a)
table.save(a,file='mytable3.tab')
a<-table.start()
a<-table.row.start(a)
a<-table.element(a, 'Multiple Linear Regression - Actuals, Interpolation, and Residuals', 4, TRUE)
a<-table.row.end(a)
a<-table.row.start(a)
a<-table.element(a, 'Time or Index', 1, TRUE)
a<-table.element(a, 'Actuals', 1, TRUE)
a<-table.element(a, 'Interpolation
Forecast', 1, TRUE)
a<-table.element(a, 'Residuals
Prediction Error', 1, TRUE)
a<-table.row.end(a)
for (i in 1:n) {
a<-table.row.start(a)
a<-table.element(a,i, 1, TRUE)
a<-table.element(a,x[i])
a<-table.element(a,x[i]-mysum$resid[i])
a<-table.element(a,mysum$resid[i])
a<-table.row.end(a)
}
a<-table.end(a)
table.save(a,file='mytable4.tab')