Free Statistics

of Irreproducible Research!

Author's title

Author*Unverified author*
R Software Modulerwasp_boxcoxlin.wasp
Title produced by softwareBox-Cox Linearity Plot
Date of computationThu, 13 Nov 2008 01:06:51 -0700
Cite this page as followsStatistical Computations at FreeStatistics.org, Office for Research Development and Education, URL https://freestatistics.org/blog/index.php?v=date/2008/Nov/13/t1226563715qz1z8fxh1es2lab.htm/, Retrieved Sun, 19 May 2024 10:56:20 +0000
Statistical Computations at FreeStatistics.org, Office for Research Development and Education, URL https://freestatistics.org/blog/index.php?pk=24472, Retrieved Sun, 19 May 2024 10:56:20 +0000
QR Codes:

Original text written by user:
IsPrivate?No (this computation is public)
User-defined keywords
Estimated Impact200
Family? (F = Feedback message, R = changed R code, M = changed R Module, P = changed Parameters, D = changed Data)
-     [Box-Cox Linearity Plot] [kelly] [2008-11-12 17:46:04] [1b742211e88d1643c42c5773474321b2]
F    D    [Box-Cox Linearity Plot] [kelly] [2008-11-13 08:06:51] [607bd9e9685911f7e343f7bc0bf7bdf9] [Current]
Feedback Forum
2008-11-15 14:03:33 [Hundra Smet] [reply
de student gaf hier een juiste oplossing.
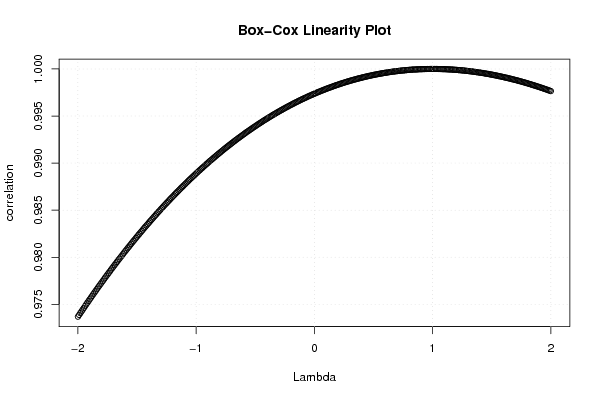
er was geen resultaat na de transformatie. dit kwam natuurlijk deels omdat de correlatie reeds bijna perfect was (optimal lambda=1) en een verbetering dan zeer moeilijk is.

extra:
door middel van de box cox transformation zoeken we uit of de data te transformeren zijn tot een lineair verband.

in de box cox linearity plot van de student zien we een positieve parabool waarvan het maximum zich bevindt rond (1,1). gevolg hiervan is dat 1 de beste transformatie is.

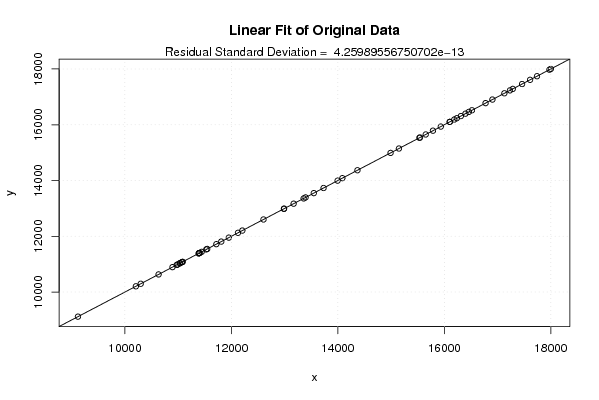
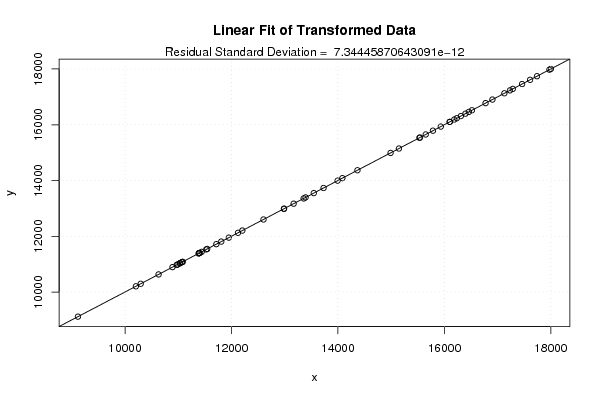
we zien dat bij de transformatie van de student er niet echt verschil is tussen de lineair fit van de originele data en die van de getransformeerde.
2008-11-20 10:27:07 [Hannes Van Hoof] [reply
Doordar er al bijna een perfect verband is tussen de variabelen, heeft de transformatie geen zichtbaar effect.
In de box-cox linearity plot ligt het max op 1, dit is dus de beste transformatie.
2008-11-24 21:02:13 [Jonas Scheltjens] [reply
Q3: De student geeft hier bitter weinig uitleg over de bekomen Box-Cox linearity plot. De Box-Cox linearity plot ook niet in het bestand opgenomen. Als we de berekening op de unieke URL volgen zien we dat deze een stijgend verloop kent. Wat er gebeurd bij een Box-Cox linearity plot is het in verband brengen van 2 variabelen in een scatterplot. De “rechte” die men kan waarnemen is de poging om een wetmatigheid in de gegevens te brengen. Dit noemt men dan ook een Box-Cox transformatie. Zo is het uiteindelijk de bedoeling om een zo goed mogelijke voorspelling te kunnen maken. Een transformatie wijzigt wel niets aan de correlatie maar heeft wel als doel de lineair fit rechter (meer lineair) te maken). Wat deze berekening eigenlijk doet is het laten schommelen van de waarde Lambda en alle mogelijke transformaties uitproberen. Dit geeft meestal een curve met een maximum. De X-waarde (en de optmiale Lambda) die het maximum weergeeft is die waarde die de rechte het beste benaderd. Men moet zich best wel afvragen of deze transformatie nuttig is. Hier is dit niet het geval.

Post a new message
Dataseries X:
10205.29
10295.98
10892.76
10631.92
11441.08
11950.95
11037.54
11527.72
11383.89
10989.34
11079.42
11028.93
10973
11068.05
11394.84
11545.71
11809.38
11395.64
11082.38
11402.75
11716.87
12204.98
12986.62
13392.79
14368.05
15650.83
16102.64
16187.64
16311.54
17232.97
16397.83
14990.31
15147.55
15786.78
15934.09
16519.44
16101.07
16775.08
17286.32
17741.23
17128.37
17460.53
17611.14
18001.37
17974.77
16460.95
16235.39
16903.36
15543.76
15532.18
13731.31
13547.84
12602.93
13357.7
13995.33
14084.6
13168.91
12989.35
12123.53
9117.03
Dataseries Y:
10205,29
10295,98
10892,76
10631,92
11441,08
11950,95
11037,54
11527,72
11383,89
10989,34
11079,42
11028,93
10973
11068,05
11394,84
11545,71
11809,38
11395,64
11082,38
11402,75
11716,87
12204,98
12986,62
13392,79
14368,05
15650,83
16102,64
16187,64
16311,54
17232,97
16397,83
14990,31
15147,55
15786,78
15934,09
16519,44
16101,07
16775,08
17286,32
17741,23
17128,37
17460,53
17611,14
18001,37
17974,77
16460,95
16235,39
16903,36
15543,76
15532,18
13731,31
13547,84
12602,93
13357,7
13995,33
14084,6
13168,91
12989,35
12123,53
9117,03


Summary of computational transaction
Raw Inputview raw input (R code)
Raw Outputview raw output of R engine
Computing time2 seconds
R Server'Gwilym Jenkins' @ 72.249.127.135

\begin{tabular}{lllllllll}
\hline
Summary of computational transaction \tabularnewline
Raw Input & view raw input (R code)  \tabularnewline
Raw Output & view raw output of R engine  \tabularnewline
Computing time & 2 seconds \tabularnewline
R Server & 'Gwilym Jenkins' @ 72.249.127.135 \tabularnewline
\hline
\end{tabular}
%Source: https://freestatistics.org/blog/index.php?pk=24472&T=0

[TABLE]
[ROW][C]Summary of computational transaction[/C][/ROW]
[ROW][C]Raw Input[/C][C]view raw input (R code) [/C][/ROW]
[ROW][C]Raw Output[/C][C]view raw output of R engine [/C][/ROW]
[ROW][C]Computing time[/C][C]2 seconds[/C][/ROW]
[ROW][C]R Server[/C][C]'Gwilym Jenkins' @ 72.249.127.135[/C][/ROW]
[/TABLE]
Source: https://freestatistics.org/blog/index.php?pk=24472&T=0

Globally Unique Identifier (entire table): ba.freestatistics.org/blog/index.php?pk=24472&T=0

As an alternative you can also use a QR Code:  

The GUIDs for individual cells are displayed in the table below:

Summary of computational transaction
Raw Inputview raw input (R code)
Raw Outputview raw output of R engine
Computing time2 seconds
R Server'Gwilym Jenkins' @ 72.249.127.135


Box-Cox Linearity Plot
# observations x60
maximum correlation1
optimal lambda(x)1
Residual SD (orginial)4.25989556750702e-13
Residual SD (transformed)7.34445870643091e-12

\begin{tabular}{lllllllll}
\hline
Box-Cox Linearity Plot \tabularnewline
# observations x & 60 \tabularnewline
maximum correlation & 1 \tabularnewline
optimal lambda(x) & 1 \tabularnewline
Residual SD (orginial) & 4.25989556750702e-13 \tabularnewline
Residual SD (transformed) & 7.34445870643091e-12 \tabularnewline
\hline
\end{tabular}
%Source: https://freestatistics.org/blog/index.php?pk=24472&T=1

[TABLE]
[ROW][C]Box-Cox Linearity Plot[/C][/ROW]
[ROW][C]# observations x[/C][C]60[/C][/ROW]
[ROW][C]maximum correlation[/C][C]1[/C][/ROW]
[ROW][C]optimal lambda(x)[/C][C]1[/C][/ROW]
[ROW][C]Residual SD (orginial)[/C][C]4.25989556750702e-13[/C][/ROW]
[ROW][C]Residual SD (transformed)[/C][C]7.34445870643091e-12[/C][/ROW]
[/TABLE]
Source: https://freestatistics.org/blog/index.php?pk=24472&T=1

Globally Unique Identifier (entire table): ba.freestatistics.org/blog/index.php?pk=24472&T=1

As an alternative you can also use a QR Code:  

The GUIDs for individual cells are displayed in the table below:

Box-Cox Linearity Plot
# observations x60
maximum correlation1
optimal lambda(x)1
Residual SD (orginial)4.25989556750702e-13
Residual SD (transformed)7.34445870643091e-12


Parameters (Session):
Parameters (R input):
R code (references can be found in the software module):
n <- length(x)
c <- array(NA,dim=c(401))
l <- array(NA,dim=c(401))
mx <- 0
mxli <- -999
for (i in 1:401)
{
l[i] <- (i-201)/100
if (l[i] != 0)
{
x1 <- (x^l[i] - 1) / l[i]
} else {
x1 <- log(x)
}
c[i] <- cor(x1,y)
if (mx < abs(c[i]))
{
mx <- abs(c[i])
mxli <- l[i]
}
}
c
mx
mxli
if (mxli != 0)
{
x1 <- (x^mxli - 1) / mxli
} else {
x1 <- log(x)
}
r<-lm(y~x)
se <- sqrt(var(r$residuals))
r1 <- lm(y~x1)
se1 <- sqrt(var(r1$residuals))
bitmap(file='test1.png')
plot(l,c,main='Box-Cox Linearity Plot',xlab='Lambda',ylab='correlation')
grid()
dev.off()
bitmap(file='test2.png')
plot(x,y,main='Linear Fit of Original Data',xlab='x',ylab='y')
abline(r)
grid()
mtext(paste('Residual Standard Deviation = ',se))
dev.off()
bitmap(file='test3.png')
plot(x1,y,main='Linear Fit of Transformed Data',xlab='x',ylab='y')
abline(r1)
grid()
mtext(paste('Residual Standard Deviation = ',se1))
dev.off()
load(file='createtable')
a<-table.start()
a<-table.row.start(a)
a<-table.element(a,'Box-Cox Linearity Plot',2,TRUE)
a<-table.row.end(a)
a<-table.row.start(a)
a<-table.element(a,'# observations x',header=TRUE)
a<-table.element(a,n)
a<-table.row.end(a)
a<-table.row.start(a)
a<-table.element(a,'maximum correlation',header=TRUE)
a<-table.element(a,mx)
a<-table.row.end(a)
a<-table.row.start(a)
a<-table.element(a,'optimal lambda(x)',header=TRUE)
a<-table.element(a,mxli)
a<-table.row.end(a)
a<-table.row.start(a)
a<-table.element(a,'Residual SD (orginial)',header=TRUE)
a<-table.element(a,se)
a<-table.row.end(a)
a<-table.row.start(a)
a<-table.element(a,'Residual SD (transformed)',header=TRUE)
a<-table.element(a,se1)
a<-table.row.end(a)
a<-table.end(a)
table.save(a,file='mytable.tab')