Free Statistics

of Irreproducible Research!

Author's title

Author*Unverified author*
R Software Modulerwasp_boxcoxnorm.wasp
Title produced by softwareBox-Cox Normality Plot
Date of computationWed, 12 Nov 2008 12:31:15 -0700
Cite this page as followsStatistical Computations at FreeStatistics.org, Office for Research Development and Education, URL https://freestatistics.org/blog/index.php?v=date/2008/Nov/12/t1226519175oof9bae0fijebdw.htm/, Retrieved Sun, 19 May 2024 12:40:16 +0000
Statistical Computations at FreeStatistics.org, Office for Research Development and Education, URL https://freestatistics.org/blog/index.php?pk=24415, Retrieved Sun, 19 May 2024 12:40:16 +0000
QR Codes:

Original text written by user:
IsPrivate?No (this computation is public)
User-defined keywords
Estimated Impact143
Family? (F = Feedback message, R = changed R code, M = changed R Module, P = changed Parameters, D = changed Data)
F       [Box-Cox Normality Plot] [Opdracht 3 Q4 box...] [2008-11-12 19:31:15] [20dfa2578b2b18ce36fdb36ac12aedd7] [Current]
Feedback Forum
2008-11-15 15:26:53 [Maarten Van Gucht] [reply
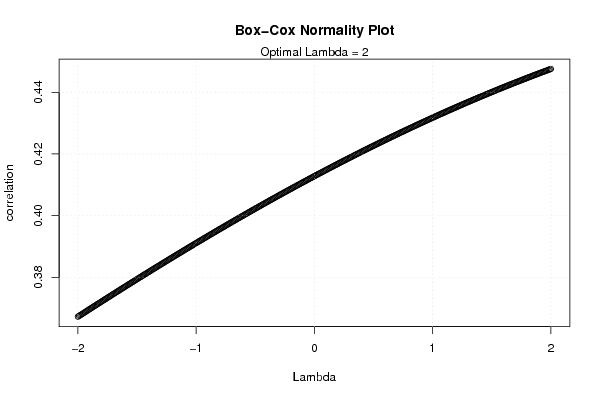
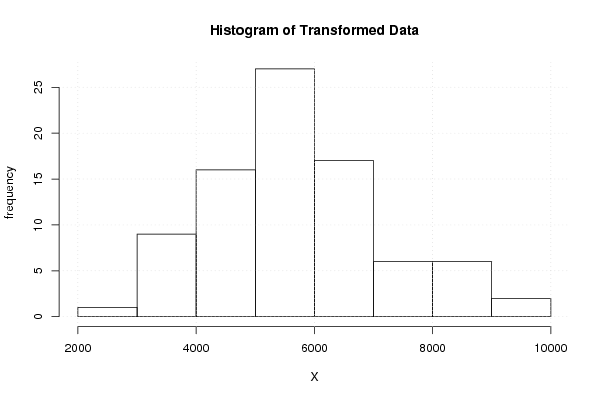
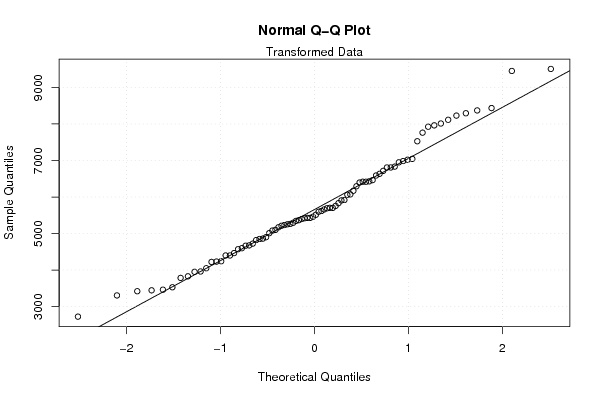
De student heeft hier een zeer goede conclusie getrokken uit de Q4 vraag. zoals hij ook vermeld is het doel inderdaad om de data te transformeren zodat ze normaler verdeeld worden. Waarom men dit doet is inderdaad om verschillende redenen, meestal (zoals de student ook vermeld) is het omdat ze zo beter kunnen berekend worden en geinterpreteerd worden. In de berekeningen van de student is de transformatie optimaal wanneer lambda 2 is. de maximale correlatie ligt een pak lager dan bij de box-cox linearity plot. De volgende formule wordt toegepast door de student om de data te transformeren: T(Y) = (Y^lambda -1) / lambda waarbij lambda de transformatieparameter is. Dit is de juiste methode

2008-11-19 16:59:46 [Steven Vercammen] [reply
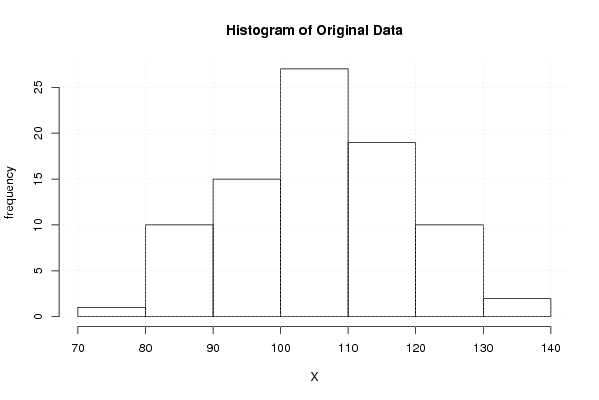
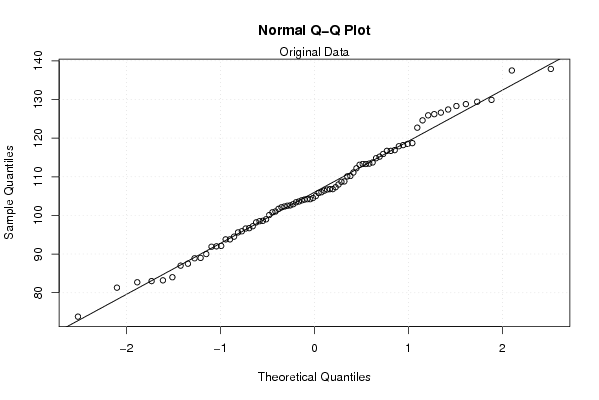
Deze vraag werd correct beantwoord. Het doel van deze box-cox normality is om de data te transformeren zodat ze normaler verdeeld worden. Het is veel gemakkelijker om berekeningen te doen op normaal verdeelde data. De volgende formule wordt toegpast om de data te transformeren: T(Y) = (Y^lambda -1) / lambda waarbij lambda de transformatieparameter is. Op de box-cox normality plot wordt een curve weergegeven waarvan het maximum de optimale lambda vormt. Omdat het effect van de transformatie na te gaan kan men de histogrammen en QQ-plots voor en na transformatie vergelijken. In dit geval is de optimale waarde inderdaad 2.

Post a new message
Dataseries X:
106,7
110,2
125,9
100,1
106,4
114,8
81,3
87
104,2
108
105
94,5
92
95,9
108,8
103,4
102,1
110,1
83,2
82,7
106,8
113,7
102,5
96,6
92,1
95,6
102,3
98,6
98,2
104,5
84
73,8
103,9
106
97,2
102,6
89
93,8
116,7
106,8
98,5
118,7
90
91,9
113,3
113,1
104,1
108,7
96,7
101
116,9
105,8
99
129,4
83
88,9
115,9
104,2
113,4
112,2
100,8
107,3
126,6
102,9
117,9
128,8
87,5
93,8
122,7
126,2
124,6
116,7
115,2
111,1
129,9
113,3
118,5
137,9
103,6
101,7
127,4
137,5
128,3
118,2


Summary of computational transaction
Raw Inputview raw input (R code)
Raw Outputview raw output of R engine
Computing time4 seconds
R Server'Herman Ole Andreas Wold' @ 193.190.124.10:1001

\begin{tabular}{lllllllll}
\hline
Summary of computational transaction \tabularnewline
Raw Input & view raw input (R code)  \tabularnewline
Raw Output & view raw output of R engine  \tabularnewline
Computing time & 4 seconds \tabularnewline
R Server & 'Herman Ole Andreas Wold' @ 193.190.124.10:1001 \tabularnewline
\hline
\end{tabular}
%Source: https://freestatistics.org/blog/index.php?pk=24415&T=0

[TABLE]
[ROW][C]Summary of computational transaction[/C][/ROW]
[ROW][C]Raw Input[/C][C]view raw input (R code) [/C][/ROW]
[ROW][C]Raw Output[/C][C]view raw output of R engine [/C][/ROW]
[ROW][C]Computing time[/C][C]4 seconds[/C][/ROW]
[ROW][C]R Server[/C][C]'Herman Ole Andreas Wold' @ 193.190.124.10:1001[/C][/ROW]
[/TABLE]
Source: https://freestatistics.org/blog/index.php?pk=24415&T=0

Globally Unique Identifier (entire table): ba.freestatistics.org/blog/index.php?pk=24415&T=0

As an alternative you can also use a QR Code:  

The GUIDs for individual cells are displayed in the table below:

Summary of computational transaction
Raw Inputview raw input (R code)
Raw Outputview raw output of R engine
Computing time4 seconds
R Server'Herman Ole Andreas Wold' @ 193.190.124.10:1001


Box-Cox Normality Plot
# observations x84
maximum correlation0.44757394048146
optimal lambda2

\begin{tabular}{lllllllll}
\hline
Box-Cox Normality Plot \tabularnewline
# observations x & 84 \tabularnewline
maximum correlation & 0.44757394048146 \tabularnewline
optimal lambda & 2 \tabularnewline
\hline
\end{tabular}
%Source: https://freestatistics.org/blog/index.php?pk=24415&T=1

[TABLE]
[ROW][C]Box-Cox Normality Plot[/C][/ROW]
[ROW][C]# observations x[/C][C]84[/C][/ROW]
[ROW][C]maximum correlation[/C][C]0.44757394048146[/C][/ROW]
[ROW][C]optimal lambda[/C][C]2[/C][/ROW]
[/TABLE]
Source: https://freestatistics.org/blog/index.php?pk=24415&T=1

Globally Unique Identifier (entire table): ba.freestatistics.org/blog/index.php?pk=24415&T=1

As an alternative you can also use a QR Code:  

The GUIDs for individual cells are displayed in the table below:

Box-Cox Normality Plot
# observations x84
maximum correlation0.44757394048146
optimal lambda2


Parameters (Session):
Parameters (R input):
R code (references can be found in the software module):
n <- length(x)
c <- array(NA,dim=c(401))
l <- array(NA,dim=c(401))
mx <- 0
mxli <- -999
for (i in 1:401)
{
l[i] <- (i-201)/100
if (l[i] != 0)
{
x1 <- (x^l[i] - 1) / l[i]
} else {
x1 <- log(x)
}
c[i] <- cor(qnorm(ppoints(x), mean=0, sd=1),x1)
if (mx < c[i])
{
mx <- c[i]
mxli <- l[i]
}
}
c
mx
mxli
if (mxli != 0)
{
x1 <- (x^mxli - 1) / mxli
} else {
x1 <- log(x)
}
bitmap(file='test1.png')
plot(l,c,main='Box-Cox Normality Plot',xlab='Lambda',ylab='correlation')
mtext(paste('Optimal Lambda =',mxli))
grid()
dev.off()
bitmap(file='test2.png')
hist(x,main='Histogram of Original Data',xlab='X',ylab='frequency')
grid()
dev.off()
bitmap(file='test3.png')
hist(x1,main='Histogram of Transformed Data',xlab='X',ylab='frequency')
grid()
dev.off()
bitmap(file='test4.png')
qqnorm(x)
qqline(x)
grid()
mtext('Original Data')
dev.off()
bitmap(file='test5.png')
qqnorm(x1)
qqline(x1)
grid()
mtext('Transformed Data')
dev.off()
load(file='createtable')
a<-table.start()
a<-table.row.start(a)
a<-table.element(a,'Box-Cox Normality Plot',2,TRUE)
a<-table.row.end(a)
a<-table.row.start(a)
a<-table.element(a,'# observations x',header=TRUE)
a<-table.element(a,n)
a<-table.row.end(a)
a<-table.row.start(a)
a<-table.element(a,'maximum correlation',header=TRUE)
a<-table.element(a,mx)
a<-table.row.end(a)
a<-table.row.start(a)
a<-table.element(a,'optimal lambda',header=TRUE)
a<-table.element(a,mxli)
a<-table.row.end(a)
a<-table.end(a)
table.save(a,file='mytable.tab')