Free Statistics

of Irreproducible Research!

Author's title

Author*Unverified author*
R Software Modulerwasp_hierarchicalclustering.wasp
Title produced by softwareHierarchical Clustering
Date of computationWed, 12 Nov 2008 11:07:33 -0700
Cite this page as followsStatistical Computations at FreeStatistics.org, Office for Research Development and Education, URL https://freestatistics.org/blog/index.php?v=date/2008/Nov/12/t12265133206lncslkmd9du89s.htm/, Retrieved Sun, 19 May 2024 12:06:44 +0000
Statistical Computations at FreeStatistics.org, Office for Research Development and Education, URL https://freestatistics.org/blog/index.php?pk=24339, Retrieved Sun, 19 May 2024 12:06:44 +0000
QR Codes:

Original text written by user:
IsPrivate?No (this computation is public)
User-defined keywords
Estimated Impact184
Family? (F = Feedback message, R = changed R code, M = changed R Module, P = changed Parameters, D = changed Data)
F       [Hierarchical Clustering] [hierarchical clus...] [2008-11-12 18:07:33] [b09437381d488816ab9f5cf07e347c02] [Current]
Feedback Forum
2008-11-18 11:32:43 [Loïque Verhasselt] [reply
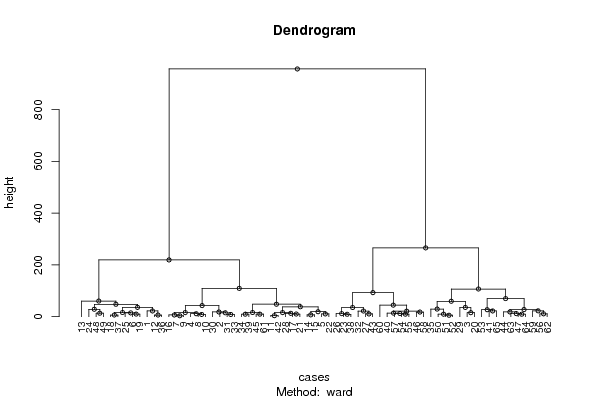
De student gebruikt hier de juiste berekeningsmethode. Er ontbreekt wel een conclusie/interpretatie van de output! Een stukje theorie kan je vinden op : http://www.ics.uci.edu/~eppstein/280/tree.html. Een dendrogram dient om waar te nemen waar de clusters van observaties zich bevinden. Opsplitsen van de perioden, makkelijke visuele interpretatie voor groepen van observaties te herkennen.
2008-11-19 16:07:43 [Ken Wright] [reply
Dendogram hier geeft weer welke variabele samen horen en dus onderverdeeld zijn in clusters.
2008-11-23 17:38:44 [Jasmine Hendrikx] [reply
Evaluatie Q2:
De student heeft de juiste methode gebruikt. Er is echter geen bespreking gegeven. Een dendrogram is een atypische manier waarop clustering gebruikt wordt. Meestal wordt dit gebruikt in marketing, om bijvoorbeeld te kijken welke producten men samen in 1 groep gaat zetten. Bij hierarchical clustering wordt er nagegaan of dat er van de periodes groepen gemaakt kunnen worden die hetzelfde zijn voor de verschillende variabelen. We zien dat de tijdreeks hier wordt opgesplitst in 2 groepen die gelijkaardig zijn. Deze worden dan nog verder onderverdeeld in kleinere groepjes die clusters genoemd worden.
Als we kijken naar het dendrogram, zouden we eventueel de conclusie kunnen trekken dat de laagste volgnummers voornamelijk in de eerste groep zitten en de hoogste volgnummers in de tweede groep. Hier zijn wel uitzonderingen op.
2008-11-24 18:30:33 [Jan De Vleeschauwer] [reply
geen conclusie gegeven, koos wel juiste methode

Post a new message
Dataseries X:
83.2	70.1	98.8	80.1
105.1	86.7	109.4	120.3
113.3	86.4	170.3	133.4
99.1	89.9	118	109.4
100.3	88.1	116.9	93.2
93.5	78.8	111.7	91.2
98.8	81.1	116.8	99.2
106.2	85.4	116.1	108.2
98.3	82.6	114.8	101.5
102.1	80.3	110.8	106.9
117.1	81.2	122.8	104.4
101.5	68	104.7	77.9
80.5	67.4	86	60
105.9	91.3	127.2	99.5
109.5	94.9	126.1	95
97.2	82.8	114.6	105.6
114.5	88.6	127.8	102.5
93.5	73.1	105.2	93.3
100.9	76.7	113.1	97.3
121.1	93.2	161	127
116.5	84.9	126.9	111.7
109.3	83.8	117.7	96.4
118.1	93.5	144.9	133
108.3	91.9	119.4	72.2
105.4	69.6	107.1	95.8
116.2	87	142.8	124.1
111.2	90.2	126.2	127.6
105.8	82.7	126.9	110.7
122.7	91.4	179.2	104.6
99.5	74.6	105.3	112.7
107.9	76.1	114.8	115.3
124.6	87.1	125.4	139.4
115	78.4	113.2	119
110.3	81.3	134.4	97.4
132.7	99.3	150	154
99.7	71	100.9	81.5
96.5	73.2	101.8	88.8
118.7	95.6	137.7	127.7
112.9	84	138.7	105.1
130.5	90.8	135.4	114.9
137.9	93.6	153.8	106.4
115	80.9	119.5	104.5
116.8	84.4	123.3	121.6
140.9	97.3	166.4	141.4
120.7	83.5	137.5	99
134.2	88.8	142.2	126.7
147.3	100.7	167	134.1
112.4	69.4	112.3	81.3
107.1	74.6	120.6	88.6
128.4	96.6	154.9	132.7
137.7	96.6	153.4	132.9
135	93.1	156.2	134.4
151	91.8	175.8	103.7
137.4	85.7	131.7	119.7
132.4	79.1	130.1	115
161.3	91.3	161.1	132.9
139.8	84.2	128.2	108.5
146	85.8	140.3	113.9
166.5	94.6	174.9	142
143.3	77.1	111.8	97.7
121	76.5	136.6	92.2
152.6	89.7	166.1	128.8
154.4	103.6	159.4	134.9
154.6	100	168.2	128.2
158	96.6	154.6	114.8


Summary of computational transaction
Raw Inputview raw input (R code)
Raw Outputview raw output of R engine
Computing time1 seconds
R Server'Gwilym Jenkins' @ 72.249.127.135

\begin{tabular}{lllllllll}
\hline
Summary of computational transaction \tabularnewline
Raw Input & view raw input (R code)  \tabularnewline
Raw Output & view raw output of R engine  \tabularnewline
Computing time & 1 seconds \tabularnewline
R Server & 'Gwilym Jenkins' @ 72.249.127.135 \tabularnewline
\hline
\end{tabular}
%Source: https://freestatistics.org/blog/index.php?pk=24339&T=0

[TABLE]
[ROW][C]Summary of computational transaction[/C][/ROW]
[ROW][C]Raw Input[/C][C]view raw input (R code) [/C][/ROW]
[ROW][C]Raw Output[/C][C]view raw output of R engine [/C][/ROW]
[ROW][C]Computing time[/C][C]1 seconds[/C][/ROW]
[ROW][C]R Server[/C][C]'Gwilym Jenkins' @ 72.249.127.135[/C][/ROW]
[/TABLE]
Source: https://freestatistics.org/blog/index.php?pk=24339&T=0

Globally Unique Identifier (entire table): ba.freestatistics.org/blog/index.php?pk=24339&T=0

As an alternative you can also use a QR Code:  

The GUIDs for individual cells are displayed in the table below:

Summary of computational transaction
Raw Inputview raw input (R code)
Raw Outputview raw output of R engine
Computing time1 seconds
R Server'Gwilym Jenkins' @ 72.249.127.135


Summary of Dendrogram
LabelHeight
13.43365694267788
23.92428337406971
35.44334456010272
46.29603049547887
56.38905313798532
66.4643276916905
76.88331315574121
88.4823345842993
98.52056336165632
109.20326029187484
119.4884139875956
129.5827970864461
139.64782797933012
149.65453261426985
159.80510071340422
169.91665266105453
1710.1557865278865
1810.4599235178848
1910.5057127316522
2010.9571894206498
2111.3735314217756
2211.7961713539548
2311.8105025799616
2412.3309058630512
2512.8359134687778
2613.3157801123329
2713.7124045820179
2814.5771830084508
2914.9948236166537
3015.3143723345098
3115.7744724692083
3215.8324965218668
3315.9553431340328
3415.9740510896747
3517.7676672638813
3618.0335100339292
3718.3254110887979
3819.0153607500328
3921.175076601454
4021.7616583898476
4122.0047722096821
4222.0231884841217
4322.5438659939566
4426.7986988963492
4527.3794323998224
4628.5722657955422
4729.3010750020238
4835.3533111436116
4935.5158327254794
5035.8944851031859
5138.0751795829687
5242.7261202550327
5344.5971306721788
5447.8507642358316
5548.0217546294019
5659.4940857287324
5760.3324269612491
5869.7979100163632
5992.9084669644798
60106.916107478839
61109.337613127222
62219.424253944988
63265.806031770677
64957.730500296774

\begin{tabular}{lllllllll}
\hline
Summary of Dendrogram \tabularnewline
Label & Height \tabularnewline
1 & 3.43365694267788 \tabularnewline
2 & 3.92428337406971 \tabularnewline
3 & 5.44334456010272 \tabularnewline
4 & 6.29603049547887 \tabularnewline
5 & 6.38905313798532 \tabularnewline
6 & 6.4643276916905 \tabularnewline
7 & 6.88331315574121 \tabularnewline
8 & 8.4823345842993 \tabularnewline
9 & 8.52056336165632 \tabularnewline
10 & 9.20326029187484 \tabularnewline
11 & 9.4884139875956 \tabularnewline
12 & 9.5827970864461 \tabularnewline
13 & 9.64782797933012 \tabularnewline
14 & 9.65453261426985 \tabularnewline
15 & 9.80510071340422 \tabularnewline
16 & 9.91665266105453 \tabularnewline
17 & 10.1557865278865 \tabularnewline
18 & 10.4599235178848 \tabularnewline
19 & 10.5057127316522 \tabularnewline
20 & 10.9571894206498 \tabularnewline
21 & 11.3735314217756 \tabularnewline
22 & 11.7961713539548 \tabularnewline
23 & 11.8105025799616 \tabularnewline
24 & 12.3309058630512 \tabularnewline
25 & 12.8359134687778 \tabularnewline
26 & 13.3157801123329 \tabularnewline
27 & 13.7124045820179 \tabularnewline
28 & 14.5771830084508 \tabularnewline
29 & 14.9948236166537 \tabularnewline
30 & 15.3143723345098 \tabularnewline
31 & 15.7744724692083 \tabularnewline
32 & 15.8324965218668 \tabularnewline
33 & 15.9553431340328 \tabularnewline
34 & 15.9740510896747 \tabularnewline
35 & 17.7676672638813 \tabularnewline
36 & 18.0335100339292 \tabularnewline
37 & 18.3254110887979 \tabularnewline
38 & 19.0153607500328 \tabularnewline
39 & 21.175076601454 \tabularnewline
40 & 21.7616583898476 \tabularnewline
41 & 22.0047722096821 \tabularnewline
42 & 22.0231884841217 \tabularnewline
43 & 22.5438659939566 \tabularnewline
44 & 26.7986988963492 \tabularnewline
45 & 27.3794323998224 \tabularnewline
46 & 28.5722657955422 \tabularnewline
47 & 29.3010750020238 \tabularnewline
48 & 35.3533111436116 \tabularnewline
49 & 35.5158327254794 \tabularnewline
50 & 35.8944851031859 \tabularnewline
51 & 38.0751795829687 \tabularnewline
52 & 42.7261202550327 \tabularnewline
53 & 44.5971306721788 \tabularnewline
54 & 47.8507642358316 \tabularnewline
55 & 48.0217546294019 \tabularnewline
56 & 59.4940857287324 \tabularnewline
57 & 60.3324269612491 \tabularnewline
58 & 69.7979100163632 \tabularnewline
59 & 92.9084669644798 \tabularnewline
60 & 106.916107478839 \tabularnewline
61 & 109.337613127222 \tabularnewline
62 & 219.424253944988 \tabularnewline
63 & 265.806031770677 \tabularnewline
64 & 957.730500296774 \tabularnewline
\hline
\end{tabular}
%Source: https://freestatistics.org/blog/index.php?pk=24339&T=1

[TABLE]
[ROW][C]Summary of Dendrogram[/C][/ROW]
[ROW][C]Label[/C][C]Height[/C][/ROW]
[ROW][C]1[/C][C]3.43365694267788[/C][/ROW]
[ROW][C]2[/C][C]3.92428337406971[/C][/ROW]
[ROW][C]3[/C][C]5.44334456010272[/C][/ROW]
[ROW][C]4[/C][C]6.29603049547887[/C][/ROW]
[ROW][C]5[/C][C]6.38905313798532[/C][/ROW]
[ROW][C]6[/C][C]6.4643276916905[/C][/ROW]
[ROW][C]7[/C][C]6.88331315574121[/C][/ROW]
[ROW][C]8[/C][C]8.4823345842993[/C][/ROW]
[ROW][C]9[/C][C]8.52056336165632[/C][/ROW]
[ROW][C]10[/C][C]9.20326029187484[/C][/ROW]
[ROW][C]11[/C][C]9.4884139875956[/C][/ROW]
[ROW][C]12[/C][C]9.5827970864461[/C][/ROW]
[ROW][C]13[/C][C]9.64782797933012[/C][/ROW]
[ROW][C]14[/C][C]9.65453261426985[/C][/ROW]
[ROW][C]15[/C][C]9.80510071340422[/C][/ROW]
[ROW][C]16[/C][C]9.91665266105453[/C][/ROW]
[ROW][C]17[/C][C]10.1557865278865[/C][/ROW]
[ROW][C]18[/C][C]10.4599235178848[/C][/ROW]
[ROW][C]19[/C][C]10.5057127316522[/C][/ROW]
[ROW][C]20[/C][C]10.9571894206498[/C][/ROW]
[ROW][C]21[/C][C]11.3735314217756[/C][/ROW]
[ROW][C]22[/C][C]11.7961713539548[/C][/ROW]
[ROW][C]23[/C][C]11.8105025799616[/C][/ROW]
[ROW][C]24[/C][C]12.3309058630512[/C][/ROW]
[ROW][C]25[/C][C]12.8359134687778[/C][/ROW]
[ROW][C]26[/C][C]13.3157801123329[/C][/ROW]
[ROW][C]27[/C][C]13.7124045820179[/C][/ROW]
[ROW][C]28[/C][C]14.5771830084508[/C][/ROW]
[ROW][C]29[/C][C]14.9948236166537[/C][/ROW]
[ROW][C]30[/C][C]15.3143723345098[/C][/ROW]
[ROW][C]31[/C][C]15.7744724692083[/C][/ROW]
[ROW][C]32[/C][C]15.8324965218668[/C][/ROW]
[ROW][C]33[/C][C]15.9553431340328[/C][/ROW]
[ROW][C]34[/C][C]15.9740510896747[/C][/ROW]
[ROW][C]35[/C][C]17.7676672638813[/C][/ROW]
[ROW][C]36[/C][C]18.0335100339292[/C][/ROW]
[ROW][C]37[/C][C]18.3254110887979[/C][/ROW]
[ROW][C]38[/C][C]19.0153607500328[/C][/ROW]
[ROW][C]39[/C][C]21.175076601454[/C][/ROW]
[ROW][C]40[/C][C]21.7616583898476[/C][/ROW]
[ROW][C]41[/C][C]22.0047722096821[/C][/ROW]
[ROW][C]42[/C][C]22.0231884841217[/C][/ROW]
[ROW][C]43[/C][C]22.5438659939566[/C][/ROW]
[ROW][C]44[/C][C]26.7986988963492[/C][/ROW]
[ROW][C]45[/C][C]27.3794323998224[/C][/ROW]
[ROW][C]46[/C][C]28.5722657955422[/C][/ROW]
[ROW][C]47[/C][C]29.3010750020238[/C][/ROW]
[ROW][C]48[/C][C]35.3533111436116[/C][/ROW]
[ROW][C]49[/C][C]35.5158327254794[/C][/ROW]
[ROW][C]50[/C][C]35.8944851031859[/C][/ROW]
[ROW][C]51[/C][C]38.0751795829687[/C][/ROW]
[ROW][C]52[/C][C]42.7261202550327[/C][/ROW]
[ROW][C]53[/C][C]44.5971306721788[/C][/ROW]
[ROW][C]54[/C][C]47.8507642358316[/C][/ROW]
[ROW][C]55[/C][C]48.0217546294019[/C][/ROW]
[ROW][C]56[/C][C]59.4940857287324[/C][/ROW]
[ROW][C]57[/C][C]60.3324269612491[/C][/ROW]
[ROW][C]58[/C][C]69.7979100163632[/C][/ROW]
[ROW][C]59[/C][C]92.9084669644798[/C][/ROW]
[ROW][C]60[/C][C]106.916107478839[/C][/ROW]
[ROW][C]61[/C][C]109.337613127222[/C][/ROW]
[ROW][C]62[/C][C]219.424253944988[/C][/ROW]
[ROW][C]63[/C][C]265.806031770677[/C][/ROW]
[ROW][C]64[/C][C]957.730500296774[/C][/ROW]
[/TABLE]
Source: https://freestatistics.org/blog/index.php?pk=24339&T=1

Globally Unique Identifier (entire table): ba.freestatistics.org/blog/index.php?pk=24339&T=1

As an alternative you can also use a QR Code:  

The GUIDs for individual cells are displayed in the table below:

Summary of Dendrogram
LabelHeight
13.43365694267788
23.92428337406971
35.44334456010272
46.29603049547887
56.38905313798532
66.4643276916905
76.88331315574121
88.4823345842993
98.52056336165632
109.20326029187484
119.4884139875956
129.5827970864461
139.64782797933012
149.65453261426985
159.80510071340422
169.91665266105453
1710.1557865278865
1810.4599235178848
1910.5057127316522
2010.9571894206498
2111.3735314217756
2211.7961713539548
2311.8105025799616
2412.3309058630512
2512.8359134687778
2613.3157801123329
2713.7124045820179
2814.5771830084508
2914.9948236166537
3015.3143723345098
3115.7744724692083
3215.8324965218668
3315.9553431340328
3415.9740510896747
3517.7676672638813
3618.0335100339292
3718.3254110887979
3819.0153607500328
3921.175076601454
4021.7616583898476
4122.0047722096821
4222.0231884841217
4322.5438659939566
4426.7986988963492
4527.3794323998224
4628.5722657955422
4729.3010750020238
4835.3533111436116
4935.5158327254794
5035.8944851031859
5138.0751795829687
5242.7261202550327
5344.5971306721788
5447.8507642358316
5548.0217546294019
5659.4940857287324
5760.3324269612491
5869.7979100163632
5992.9084669644798
60106.916107478839
61109.337613127222
62219.424253944988
63265.806031770677
64957.730500296774


Parameters (Session):
par1 = ward ; par2 = ALL ; par3 = FALSE ; par4 = FALSE ;
Parameters (R input):
par1 = ward ; par2 = ALL ; par3 = FALSE ; par4 = FALSE ;
R code (references can be found in the software module):
par3 <- as.logical(par3)
par4 <- as.logical(par4)
if (par3 == 'TRUE'){
dum = xlab
xlab = ylab
ylab = dum
}
x <- t(y)
hc <- hclust(dist(x),method=par1)
d <- as.dendrogram(hc)
str(d)
mysub <- paste('Method: ',par1)
bitmap(file='test1.png')
if (par4 == 'TRUE'){
plot(d,main=main,ylab=ylab,xlab=xlab,horiz=par3, nodePar=list(pch = c(1,NA), cex=0.8, lab.cex = 0.8),type='t',center=T, sub=mysub)
} else {
plot(d,main=main,ylab=ylab,xlab=xlab,horiz=par3, nodePar=list(pch = c(1,NA), cex=0.8, lab.cex = 0.8), sub=mysub)
}
dev.off()
if (par2 != 'ALL'){
if (par3 == 'TRUE'){
ylab = 'cluster'
} else {
xlab = 'cluster'
}
par2 <- as.numeric(par2)
memb <- cutree(hc, k = par2)
cent <- NULL
for(k in 1:par2){
cent <- rbind(cent, colMeans(x[memb == k, , drop = FALSE]))
}
hc1 <- hclust(dist(cent),method=par1, members = table(memb))
de <- as.dendrogram(hc1)
bitmap(file='test2.png')
if (par4 == 'TRUE'){
plot(de,main=main,ylab=ylab,xlab=xlab,horiz=par3, nodePar=list(pch = c(1,NA), cex=0.8, lab.cex = 0.8),type='t',center=T, sub=mysub)
} else {
plot(de,main=main,ylab=ylab,xlab=xlab,horiz=par3, nodePar=list(pch = c(1,NA), cex=0.8, lab.cex = 0.8), sub=mysub)
}
dev.off()
str(de)
}
load(file='createtable')
a<-table.start()
a<-table.row.start(a)
a<-table.element(a,'Summary of Dendrogram',2,TRUE)
a<-table.row.end(a)
a<-table.row.start(a)
a<-table.element(a,'Label',header=TRUE)
a<-table.element(a,'Height',header=TRUE)
a<-table.row.end(a)
num <- length(x[,1])-1
for (i in 1:num)
{
a<-table.row.start(a)
a<-table.element(a,hc$labels[i])
a<-table.element(a,hc$height[i])
a<-table.row.end(a)
}
a<-table.end(a)
table.save(a,file='mytable1.tab')
if (par2 != 'ALL'){
a<-table.start()
a<-table.row.start(a)
a<-table.element(a,'Summary of Cut Dendrogram',2,TRUE)
a<-table.row.end(a)
a<-table.row.start(a)
a<-table.element(a,'Label',header=TRUE)
a<-table.element(a,'Height',header=TRUE)
a<-table.row.end(a)
num <- par2-1
for (i in 1:num)
{
a<-table.row.start(a)
a<-table.element(a,i)
a<-table.element(a,hc1$height[i])
a<-table.row.end(a)
}
a<-table.end(a)
table.save(a,file='mytable2.tab')
}