Free Statistics

of Irreproducible Research!

Author's title

Author*Unverified author*
R Software Modulerwasp_boxcoxlin.wasp
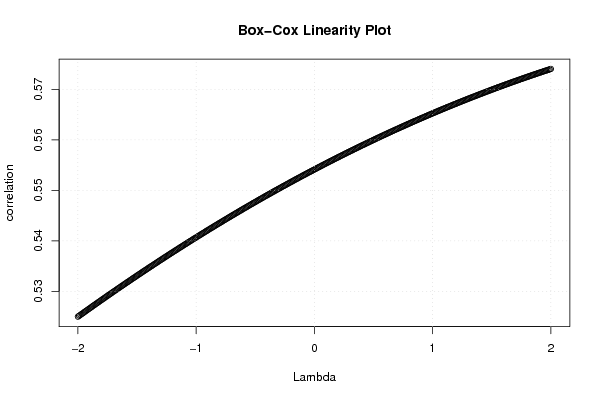
Title produced by softwareBox-Cox Linearity Plot
Date of computationTue, 11 Nov 2008 11:55:52 -0700
Cite this page as followsStatistical Computations at FreeStatistics.org, Office for Research Development and Education, URL https://freestatistics.org/blog/index.php?v=date/2008/Nov/11/t1226429904pt3l9a3y8yo3l0a.htm/, Retrieved Sun, 19 May 2024 10:43:52 +0000
Statistical Computations at FreeStatistics.org, Office for Research Development and Education, URL https://freestatistics.org/blog/index.php?pk=23833, Retrieved Sun, 19 May 2024 10:43:52 +0000
QR Codes:

Original text written by user:
IsPrivate?No (this computation is public)
User-defined keywords
Estimated Impact170
Family? (F = Feedback message, R = changed R code, M = changed R Module, P = changed Parameters, D = changed Data)
F       [Box-Cox Linearity Plot] [Toon Wouters] [2008-11-11 18:55:52] [129e79f7c2a947d1265718b3aa5cb7d5] [Current]
F R       [Box-Cox Linearity Plot] [various EDA Q3 Ya...] [2008-11-13 17:03:45] [4cef99958047f3eba6252f8ff7fc4642]
Feedback Forum
2008-11-22 13:06:03 [Stephanie Vanderlinden] [reply
De student legt goed uit wat een box-cox linearity plot doet en geeft ook aan of er een verband is tussen de verschillende variabelen.
2008-11-22 16:33:01 [6066575aa30c0611e452e930b1dff53d] [reply
De conclusie is niet echt volledig. Ik zou nog vermeld hebben dat de optimale lambda 2 is en dat dat in overeenstemming is met een correlatie van 57,40%. Verder zou ik ook nog vermeld hebben dat het toepassen van de transformatie de correlatie zeer weinig verhoogt. De correlatie blijft nagenoeg hetzelfde. Bovendien krijg je hier (bijna) een rechte lijn van linksonder naar rechtsboven. Dit is het geval als er geen zinvolle transformatie bestaat.
2008-11-24 13:07:04 [Julian De Ruyter] [reply
Juiste uitleg, je kon er nog bijzetten dat de optimale lambda 2 bedraagt en dat de transformatie niet veel zin had en dus de correlatie niet verhoogde.
2008-11-24 15:09:00 [Vincent Dolhain] [reply
Zowel de grafiek als de conclusie zijn correct. De student had nog wel kunnen melden dat omdat de grafiek een rechte is zonder maximum, de lambda 2 is, maar dat dit geen zinnige transformatie verwezenlijkt.
2008-11-24 19:26:03 [Sören Van Donink] [reply
zelfde opmerking als hierboven

Post a new message
Dataseries X:
110.40
96.40
101.90
106.20
81.00
94.70
101.00
109.40
102.30
90.70
96.20
96.10
106.00
103.10
102.00
104.70
86.00
92.10
106.90
112.60
101.70
92.00
97.40
97.00
105.40
102.70
98.10
104.50
87.40
89.90
109.80
111.70
98.60
96.90
95.10
97.00
112.70
102.90
97.40
111.40
87.40
96.80
114.10
110.30
103.90
101.60
94.60
95.90
104.70
102.80
98.10
113.90
80.90
95.70
113.20
105.90
108.80
102.30
99.00
100.70
115.50
Dataseries Y:
109.20
88.60
94.30
98.30
86.40
80.60
104.10
108.20
93.40
71.90
94.10
94.90
96.40
91.10
84.40
86.40
88.00
75.10
109.70
103.00
82.10
68.00
96.40
94.30
90.00
88.00
76.10
82.50
81.40
66.50
97.20
94.10
80.70
70.50
87.80
89.50
99.60
84.20
75.10
92.00
80.80
73.10
99.80
90.00
83.10
72.40
78.80
87.30
91.00
80.10
73.60
86.40
74.50
71.20
92.40
81.50
85.30
69.90
84.20
90.70
100.30


Summary of computational transaction
Raw Inputview raw input (R code)
Raw Outputview raw output of R engine
Computing time3 seconds
R Server'Sir Ronald Aylmer Fisher' @ 193.190.124.24

\begin{tabular}{lllllllll}
\hline
Summary of computational transaction \tabularnewline
Raw Input & view raw input (R code)  \tabularnewline
Raw Output & view raw output of R engine  \tabularnewline
Computing time & 3 seconds \tabularnewline
R Server & 'Sir Ronald Aylmer Fisher' @ 193.190.124.24 \tabularnewline
\hline
\end{tabular}
%Source: https://freestatistics.org/blog/index.php?pk=23833&T=0

[TABLE]
[ROW][C]Summary of computational transaction[/C][/ROW]
[ROW][C]Raw Input[/C][C]view raw input (R code) [/C][/ROW]
[ROW][C]Raw Output[/C][C]view raw output of R engine [/C][/ROW]
[ROW][C]Computing time[/C][C]3 seconds[/C][/ROW]
[ROW][C]R Server[/C][C]'Sir Ronald Aylmer Fisher' @ 193.190.124.24[/C][/ROW]
[/TABLE]
Source: https://freestatistics.org/blog/index.php?pk=23833&T=0

Globally Unique Identifier (entire table): ba.freestatistics.org/blog/index.php?pk=23833&T=0

As an alternative you can also use a QR Code:  

The GUIDs for individual cells are displayed in the table below:

Summary of computational transaction
Raw Inputview raw input (R code)
Raw Outputview raw output of R engine
Computing time3 seconds
R Server'Sir Ronald Aylmer Fisher' @ 193.190.124.24


Box-Cox Linearity Plot
# observations x61
maximum correlation0.574057467611171
optimal lambda(x)2
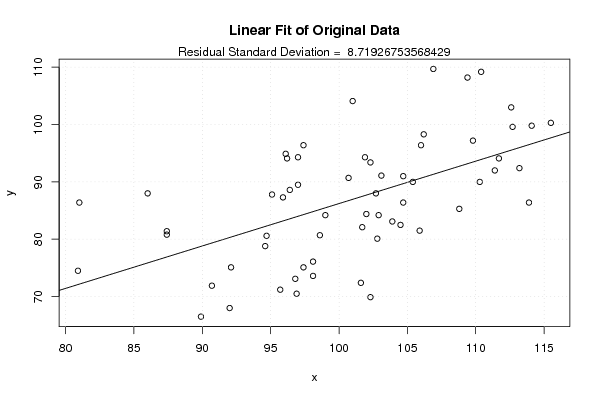
Residual SD (orginial)8.71926753568429
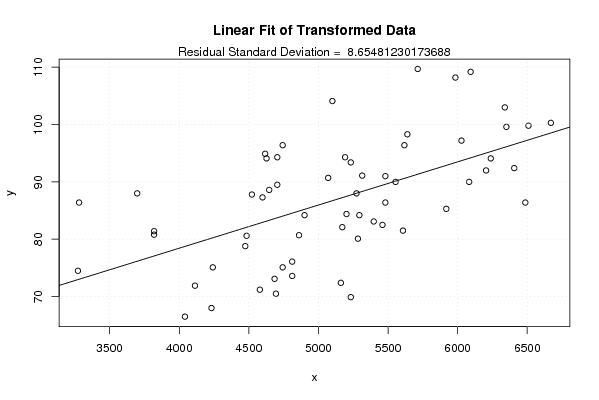
Residual SD (transformed)8.65481230173688

\begin{tabular}{lllllllll}
\hline
Box-Cox Linearity Plot \tabularnewline
# observations x & 61 \tabularnewline
maximum correlation & 0.574057467611171 \tabularnewline
optimal lambda(x) & 2 \tabularnewline
Residual SD (orginial) & 8.71926753568429 \tabularnewline
Residual SD (transformed) & 8.65481230173688 \tabularnewline
\hline
\end{tabular}
%Source: https://freestatistics.org/blog/index.php?pk=23833&T=1

[TABLE]
[ROW][C]Box-Cox Linearity Plot[/C][/ROW]
[ROW][C]# observations x[/C][C]61[/C][/ROW]
[ROW][C]maximum correlation[/C][C]0.574057467611171[/C][/ROW]
[ROW][C]optimal lambda(x)[/C][C]2[/C][/ROW]
[ROW][C]Residual SD (orginial)[/C][C]8.71926753568429[/C][/ROW]
[ROW][C]Residual SD (transformed)[/C][C]8.65481230173688[/C][/ROW]
[/TABLE]
Source: https://freestatistics.org/blog/index.php?pk=23833&T=1

Globally Unique Identifier (entire table): ba.freestatistics.org/blog/index.php?pk=23833&T=1

As an alternative you can also use a QR Code:  

The GUIDs for individual cells are displayed in the table below:

Box-Cox Linearity Plot
# observations x61
maximum correlation0.574057467611171
optimal lambda(x)2
Residual SD (orginial)8.71926753568429
Residual SD (transformed)8.65481230173688


Parameters (Session):
Parameters (R input):
R code (references can be found in the software module):
n <- length(x)
c <- array(NA,dim=c(401))
l <- array(NA,dim=c(401))
mx <- 0
mxli <- -999
for (i in 1:401)
{
l[i] <- (i-201)/100
if (l[i] != 0)
{
x1 <- (x^l[i] - 1) / l[i]
} else {
x1 <- log(x)
}
c[i] <- cor(x1,y)
if (mx < abs(c[i]))
{
mx <- abs(c[i])
mxli <- l[i]
}
}
c
mx
mxli
if (mxli != 0)
{
x1 <- (x^mxli - 1) / mxli
} else {
x1 <- log(x)
}
r<-lm(y~x)
se <- sqrt(var(r$residuals))
r1 <- lm(y~x1)
se1 <- sqrt(var(r1$residuals))
bitmap(file='test1.png')
plot(l,c,main='Box-Cox Linearity Plot',xlab='Lambda',ylab='correlation')
grid()
dev.off()
bitmap(file='test2.png')
plot(x,y,main='Linear Fit of Original Data',xlab='x',ylab='y')
abline(r)
grid()
mtext(paste('Residual Standard Deviation = ',se))
dev.off()
bitmap(file='test3.png')
plot(x1,y,main='Linear Fit of Transformed Data',xlab='x',ylab='y')
abline(r1)
grid()
mtext(paste('Residual Standard Deviation = ',se1))
dev.off()
load(file='createtable')
a<-table.start()
a<-table.row.start(a)
a<-table.element(a,'Box-Cox Linearity Plot',2,TRUE)
a<-table.row.end(a)
a<-table.row.start(a)
a<-table.element(a,'# observations x',header=TRUE)
a<-table.element(a,n)
a<-table.row.end(a)
a<-table.row.start(a)
a<-table.element(a,'maximum correlation',header=TRUE)
a<-table.element(a,mx)
a<-table.row.end(a)
a<-table.row.start(a)
a<-table.element(a,'optimal lambda(x)',header=TRUE)
a<-table.element(a,mxli)
a<-table.row.end(a)
a<-table.row.start(a)
a<-table.element(a,'Residual SD (orginial)',header=TRUE)
a<-table.element(a,se)
a<-table.row.end(a)
a<-table.row.start(a)
a<-table.element(a,'Residual SD (transformed)',header=TRUE)
a<-table.element(a,se1)
a<-table.row.end(a)
a<-table.end(a)
table.save(a,file='mytable.tab')