Free Statistics

of Irreproducible Research!

Author's title

Author*Unverified author*
R Software Modulerwasp_cloud.wasp
Title produced by softwareTrivariate Scatterplots
Date of computationTue, 11 Nov 2008 10:08:50 -0700
Cite this page as followsStatistical Computations at FreeStatistics.org, Office for Research Development and Education, URL https://freestatistics.org/blog/index.php?v=date/2008/Nov/11/t1226423681qxyb6w9exnyyxhk.htm/, Retrieved Sun, 19 May 2024 12:13:02 +0000
Statistical Computations at FreeStatistics.org, Office for Research Development and Education, URL https://freestatistics.org/blog/index.php?pk=23742, Retrieved Sun, 19 May 2024 12:13:02 +0000
QR Codes:

Original text written by user:
IsPrivate?No (this computation is public)
User-defined keywords
Estimated Impact158
Family? (F = Feedback message, R = changed R code, M = changed R Module, P = changed Parameters, D = changed Data)
F       [Trivariate Scatterplots] [Toon Wouters] [2008-11-11 17:08:50] [129e79f7c2a947d1265718b3aa5cb7d5] [Current]
F         [Trivariate Scatterplots] [various EDA Q1.2 ...] [2008-11-13 16:58:37] [4cef99958047f3eba6252f8ff7fc4642]
Feedback Forum
2008-11-21 22:44:17 [Vincent Vanden Poel] [reply
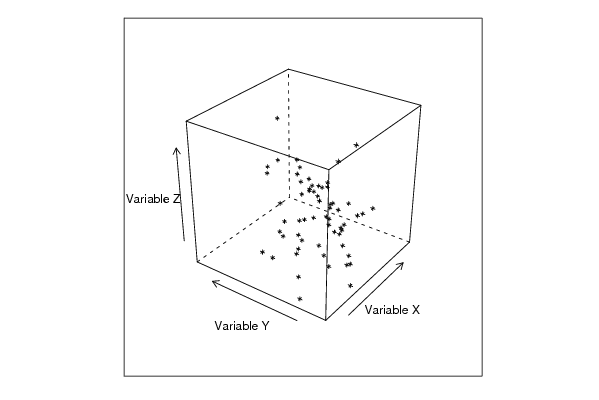
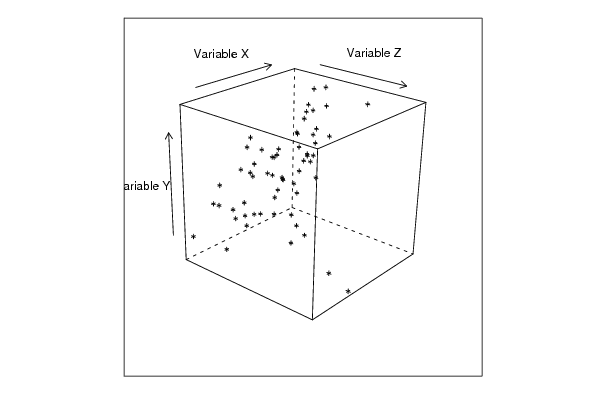
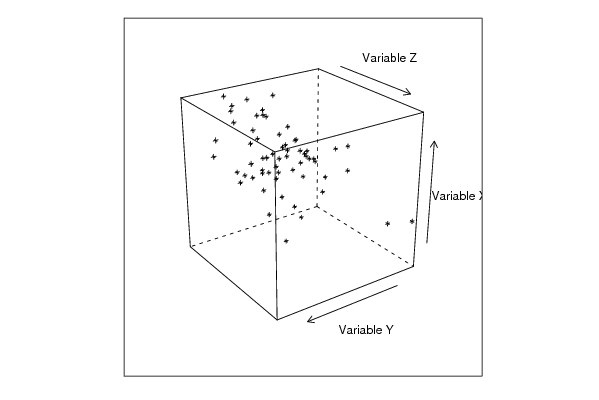
Goed opgelost. Het nadeel van deze grafiek is dat de transformatie deels verloren gaat doordat een 3D figuur geprojecteerd wordt op een 2D scherm. De scatterplots zijn een projectie van deze kubus. Deze geven echter een vertekend beeld omdat bepaalde lengtes gereduceerd worden.
2008-11-22 12:01:14 [Stephanie Vanderlinden] [reply
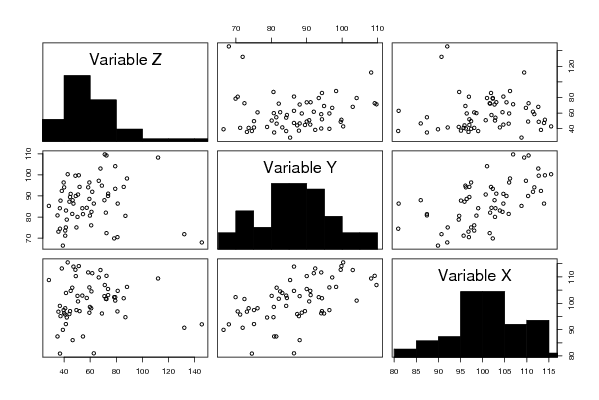
Goede uitwerking. Er had nog bijvermeld kunnen worden dat het moeilijk is om een analyse te maken van een 3-dimensioneel plot. Daarom worden deze afgebeeld op een 2-dimensioneel plot (=histogram). Dit histogram geeft scatterplots voor alle mogelijke combinaties, deze zijn echter vertekend omdat niet elke variabele in rekening wordt gebracht. Een oplossing hiervoor is kijken naar de bivariate density plot.
2008-11-22 16:26:53 [6066575aa30c0611e452e930b1dff53d] [reply
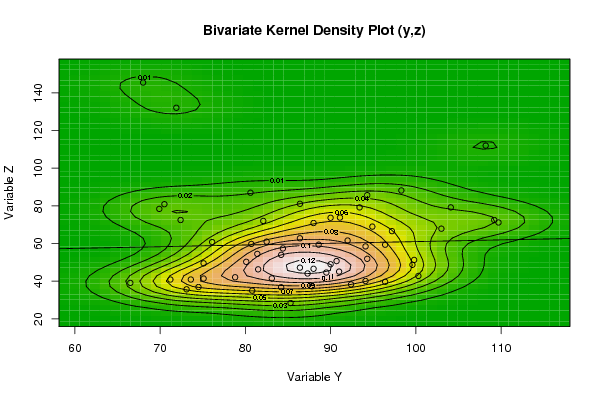
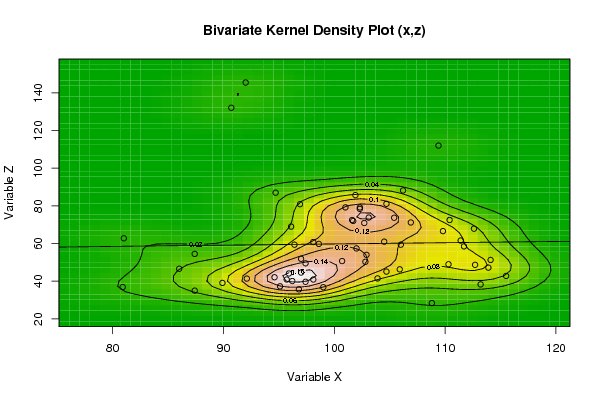
De conclusie is correct. Verder zou ik ook nog vermeld hebben dat elke kubus een ander perspectief geeft. We zien duidelijk een puntenwolk in de kubus. De conclusie voor de gestandaardiseerde projectie is ook correct. Verder zou ik ook nog vermeld hebben dat volgens deze grafiek er tussen variabele y en z (bijna) geen verband is.Bij de bivariate kernel density plot tussen variabele y en z kunnen we spreken van een zeer zwak positief verband. Bij de bivariate kernel density plot van x en z zien we duidelijk twee clusters. Hier kunnen we spreken van een zeer zwak (bijna geen) positief verband.
2008-11-24 12:58:36 [Julian De Ruyter] [reply
Je conclusie is zeer correct.
Je kon er nog bij zetten dat op een computerscherm de kubus niet tot zijn recht komt en dat we daarom gaan kijken naar de figuur met scatterplots en histogrammen tussen alle variabelen. Hieruit concluderen we dat XenY een positief lineair verband heeft. De verbanden tussen de andere variabelen zijn zeer klein.
bivariate kernel density plot verteld ons dat enkel bij x-z we kunnen spreken over een zeer klein positief verband aangezien de 2clusters in stijgende lijn liggen.
2008-11-24 15:00:07 [Vincent Dolhain] [reply
Juiste grafieken en berekeningen gemaakt. De conclusie kon meer uitgewerkt zijn. De Trivariate Scatterplot geeft inderdaad het verband weer tussen 3 variabelen. Maar in de manier de student hem gebruikt vergelijkt hij maar 2 variabelen, hierdoor ontstaat er een vertekening

Post a new message
Dataseries X:
110.40
96.40
101.90
106.20
81.00
94.70
101.00
109.40
102.30
90.70
96.20
96.10
106.00
103.10
102.00
104.70
86.00
92.10
106.90
112.60
101.70
92.00
97.40
97.00
105.40
102.70
98.10
104.50
87.40
89.90
109.80
111.70
98.60
96.90
95.10
97.00
112.70
102.90
97.40
111.40
87.40
96.80
114.10
110.30
103.90
101.60
94.60
95.90
104.70
102.80
98.10
113.90
80.90
95.70
113.20
105.90
108.80
102.30
99.00
100.70
115.50
Dataseries Y:
109.20
88.60
94.30
98.30
86.40
80.60
104.10
108.20
93.40
71.90
94.10
94.90
96.40
91.10
84.40
86.40
88.00
75.10
109.70
103.00
82.10
68.00
96.40
94.30
90.00
88.00
76.10
82.50
81.40
66.50
97.20
94.10
80.70
70.50
87.80
89.50
99.60
84.20
75.10
92.00
80.80
73.10
99.80
90.00
83.10
72.40
78.80
87.30
91.00
80.10
73.60
86.40
74.50
71.20
92.40
81.50
85.30
69.90
84.20
90.70
100.30
Dataseries Z:
72.50
59.40
85.70
88.20
62.80
87.00
79.20
112.00
79.20
132.10
40.10
69.00
59.40
73.80
57.40
81.10
46.60
41.40
71.20
67.90
72.00
145.50
39.70
51.90
73.70
70.90
60.80
61.00
54.50
39.10
66.60
58.50
59.80
80.90
37.30
44.60
48.70
54.00
49.50
61.60
35.00
35.70
51.30
49.00
41.50
72.50
42.10
44.10
45.10
50.30
40.90
47.20
36.90
40.90
38.30
46.30
28.40
78.40
36.80
50.70
42.80


Summary of computational transaction
Raw Inputview raw input (R code)
Raw Outputview raw output of R engine
Computing time5 seconds
R Server'Sir Ronald Aylmer Fisher' @ 193.190.124.24

\begin{tabular}{lllllllll}
\hline
Summary of computational transaction \tabularnewline
Raw Input & view raw input (R code)  \tabularnewline
Raw Output & view raw output of R engine  \tabularnewline
Computing time & 5 seconds \tabularnewline
R Server & 'Sir Ronald Aylmer Fisher' @ 193.190.124.24 \tabularnewline
\hline
\end{tabular}
%Source: https://freestatistics.org/blog/index.php?pk=23742&T=0

[TABLE]
[ROW][C]Summary of computational transaction[/C][/ROW]
[ROW][C]Raw Input[/C][C]view raw input (R code) [/C][/ROW]
[ROW][C]Raw Output[/C][C]view raw output of R engine [/C][/ROW]
[ROW][C]Computing time[/C][C]5 seconds[/C][/ROW]
[ROW][C]R Server[/C][C]'Sir Ronald Aylmer Fisher' @ 193.190.124.24[/C][/ROW]
[/TABLE]
Source: https://freestatistics.org/blog/index.php?pk=23742&T=0

Globally Unique Identifier (entire table): ba.freestatistics.org/blog/index.php?pk=23742&T=0

As an alternative you can also use a QR Code:  

The GUIDs for individual cells are displayed in the table below:

Summary of computational transaction
Raw Inputview raw input (R code)
Raw Outputview raw output of R engine
Computing time5 seconds
R Server'Sir Ronald Aylmer Fisher' @ 193.190.124.24


Parameters (Session):
par1 = 50 ; par2 = 50 ; par3 = Y ; par4 = Y ; par5 = Variable X ; par6 = Variable Y ; par7 = Variable Z ;
Parameters (R input):
par1 = 50 ; par2 = 50 ; par3 = Y ; par4 = Y ; par5 = Variable X ; par6 = Variable Y ; par7 = Variable Z ;
R code (references can be found in the software module):
x <- array(x,dim=c(length(x),1))
colnames(x) <- par5
y <- array(y,dim=c(length(y),1))
colnames(y) <- par6
z <- array(z,dim=c(length(z),1))
colnames(z) <- par7
d <- data.frame(cbind(z,y,x))
colnames(d) <- list(par7,par6,par5)
par1 <- as.numeric(par1)
par2 <- as.numeric(par2)
if (par1>500) par1 <- 500
if (par2>500) par2 <- 500
if (par1<10) par1 <- 10
if (par2<10) par2 <- 10
library(GenKern)
library(lattice)
panel.hist <- function(x, ...)
{
usr <- par('usr'); on.exit(par(usr))
par(usr = c(usr[1:2], 0, 1.5) )
h <- hist(x, plot = FALSE)
breaks <- h$breaks; nB <- length(breaks)
y <- h$counts; y <- y/max(y)
rect(breaks[-nB], 0, breaks[-1], y, col='black', ...)
}
bitmap(file='cloud1.png')
cloud(z~x*y, screen = list(x=-45, y=45, z=35),xlab=par5,ylab=par6,zlab=par7)
dev.off()
bitmap(file='cloud2.png')
cloud(z~x*y, screen = list(x=35, y=45, z=25),xlab=par5,ylab=par6,zlab=par7)
dev.off()
bitmap(file='cloud3.png')
cloud(z~x*y, screen = list(x=35, y=-25, z=90),xlab=par5,ylab=par6,zlab=par7)
dev.off()
bitmap(file='pairs.png')
pairs(d,diag.panel=panel.hist)
dev.off()
x <- as.vector(x)
y <- as.vector(y)
z <- as.vector(z)
bitmap(file='bidensity1.png')
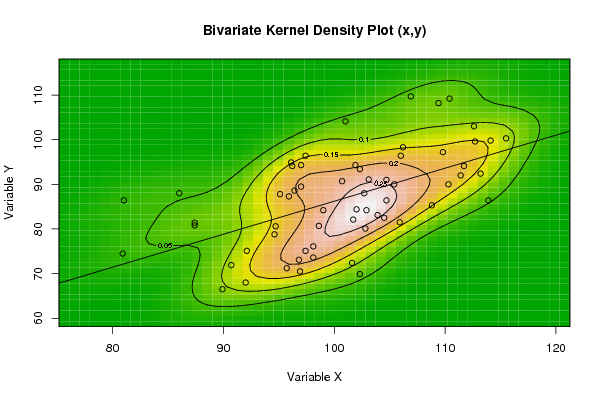
op <- KernSur(x,y, xgridsize=par1, ygridsize=par2, correlation=cor(x,y), xbandwidth=dpik(x), ybandwidth=dpik(y))
image(op$xords, op$yords, op$zden, col=terrain.colors(100), axes=TRUE,main='Bivariate Kernel Density Plot (x,y)',xlab=par5,ylab=par6)
if (par3=='Y') contour(op$xords, op$yords, op$zden, add=TRUE)
if (par4=='Y') points(x,y)
(r<-lm(y ~ x))
abline(r)
box()
dev.off()
bitmap(file='bidensity2.png')
op <- KernSur(y,z, xgridsize=par1, ygridsize=par2, correlation=cor(y,z), xbandwidth=dpik(y), ybandwidth=dpik(z))
op
image(op$xords, op$yords, op$zden, col=terrain.colors(100), axes=TRUE,main='Bivariate Kernel Density Plot (y,z)',xlab=par6,ylab=par7)
if (par3=='Y') contour(op$xords, op$yords, op$zden, add=TRUE)
if (par4=='Y') points(y,z)
(r<-lm(z ~ y))
abline(r)
box()
dev.off()
bitmap(file='bidensity3.png')
op <- KernSur(x,z, xgridsize=par1, ygridsize=par2, correlation=cor(x,z), xbandwidth=dpik(x), ybandwidth=dpik(z))
op
image(op$xords, op$yords, op$zden, col=terrain.colors(100), axes=TRUE,main='Bivariate Kernel Density Plot (x,z)',xlab=par5,ylab=par7)
if (par3=='Y') contour(op$xords, op$yords, op$zden, add=TRUE)
if (par4=='Y') points(x,z)
(r<-lm(z ~ x))
abline(r)
box()
dev.off()