Free Statistics

of Irreproducible Research!

Author's title

Author*The author of this computation has been verified*
R Software Modulerwasp_bidensity.wasp
Title produced by softwareBivariate Kernel Density Estimation
Date of computationTue, 11 Nov 2008 06:51:35 -0700
Cite this page as followsStatistical Computations at FreeStatistics.org, Office for Research Development and Education, URL https://freestatistics.org/blog/index.php?v=date/2008/Nov/11/t1226411607pcetzpxnk00syip.htm/, Retrieved Sun, 19 May 2024 12:39:45 +0000
Statistical Computations at FreeStatistics.org, Office for Research Development and Education, URL https://freestatistics.org/blog/index.php?pk=23481, Retrieved Sun, 19 May 2024 12:39:45 +0000
QR Codes:

Original text written by user:
IsPrivate?No (this computation is public)
User-defined keywords
Estimated Impact163
Family? (F = Feedback message, R = changed R code, M = changed R Module, P = changed Parameters, D = changed Data)
F     [Notched Boxplots] [workshop 3] [2007-10-26 13:31:48] [e9ffc5de6f8a7be62f22b142b5b6b1a8]
F    D  [Notched Boxplots] [Q1 - Notched Boxplot] [2008-11-03 09:57:32] [a7f04e0e73ce3683561193958d653479]
F RMPD    [Bivariate Kernel Density Estimation] [Various EDA topic...] [2008-11-11 13:04:27] [a7f04e0e73ce3683561193958d653479]
F    D        [Bivariate Kernel Density Estimation] [Various EDA topic...] [2008-11-11 13:51:35] [f1a30f1149cef3ef3ef69d586c6c3c1c] [Current]
Feedback Forum
2008-11-20 09:16:54 [An De Koninck] [reply
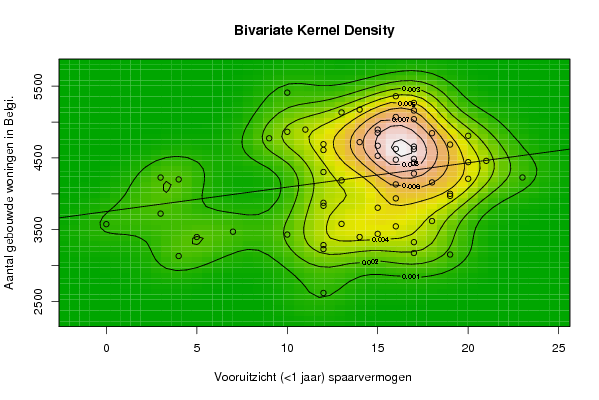
Deze grafiek is ongeveer hetzelfde verhaal als de grafiek die het verband weergeeft tussen het aantal gebouwde woningen in België en de totale werkloosheid.
Het is correct dat er sprake is van een vrij lage correlatie (0.2446809612763). Dit zie je aan de grafiek. Er is weer sprake van 1 cluster, maar aan de linkerkant loopt deze uit in een staart.
De hoogtelijnen liggen verder uit elkaar en de punten zijn niet zo gecentraliseerd.
Als je kijkt naar de diagnoaal die getrokken is door de grafiek zie je dat er weinig punten zijn die op of dicht tegen de rechte aanleunen.


Post a new message
Dataseries X:
10
12
12
13
17
12
15
12
14
19
16
17
16
19
17
17
20
18
16
19
18
23
20
20
15
17
16
15
10
13
10
19
21
17
16
17
14
18
17
14
15
16
11
15
13
17
16
9
17
15
12
12
12
12
4
7
4
3
3
0
5
Dataseries Y:
3431
3874
2617
3580
5267
3832
3441
3228
3397
3971
4625
4486
4131
4686
3174
4282
4209
4159
3936
3153
3620
4227
4441
4808
4850
5040
3546
4669
5410
5134
4864
3999
4459
4622
5360
4658
5173
4845
3325
4720
4895
5071
4895
3805
4187
4435
4475
4774
5161
4529
3284
4303
4610
4691
4200
3471
3132
4226
3723
3576
3397


Summary of computational transaction
Raw Inputview raw input (R code)
Raw Outputview raw output of R engine
Computing time3 seconds
R Server'Herman Ole Andreas Wold' @ 193.190.124.10:1001

\begin{tabular}{lllllllll}
\hline
Summary of computational transaction \tabularnewline
Raw Input & view raw input (R code)  \tabularnewline
Raw Output & view raw output of R engine  \tabularnewline
Computing time & 3 seconds \tabularnewline
R Server & 'Herman Ole Andreas Wold' @ 193.190.124.10:1001 \tabularnewline
\hline
\end{tabular}
%Source: https://freestatistics.org/blog/index.php?pk=23481&T=0

[TABLE]
[ROW][C]Summary of computational transaction[/C][/ROW]
[ROW][C]Raw Input[/C][C]view raw input (R code) [/C][/ROW]
[ROW][C]Raw Output[/C][C]view raw output of R engine [/C][/ROW]
[ROW][C]Computing time[/C][C]3 seconds[/C][/ROW]
[ROW][C]R Server[/C][C]'Herman Ole Andreas Wold' @ 193.190.124.10:1001[/C][/ROW]
[/TABLE]
Source: https://freestatistics.org/blog/index.php?pk=23481&T=0

Globally Unique Identifier (entire table): ba.freestatistics.org/blog/index.php?pk=23481&T=0

As an alternative you can also use a QR Code:  

The GUIDs for individual cells are displayed in the table below:

Summary of computational transaction
Raw Inputview raw input (R code)
Raw Outputview raw output of R engine
Computing time3 seconds
R Server'Herman Ole Andreas Wold' @ 193.190.124.10:1001


Bandwidth
x axis1.55385919601336
y axis287.611513510986
Correlation
correlation used in KDE0.2446809612763
correlation(x,y)0.2446809612763

\begin{tabular}{lllllllll}
\hline
Bandwidth \tabularnewline
x axis & 1.55385919601336 \tabularnewline
y axis & 287.611513510986 \tabularnewline
Correlation \tabularnewline
correlation used in KDE & 0.2446809612763 \tabularnewline
correlation(x,y) & 0.2446809612763 \tabularnewline
\hline
\end{tabular}
%Source: https://freestatistics.org/blog/index.php?pk=23481&T=1

[TABLE]
[ROW][C]Bandwidth[/C][/ROW]
[ROW][C]x axis[/C][C]1.55385919601336[/C][/ROW]
[ROW][C]y axis[/C][C]287.611513510986[/C][/ROW]
[ROW][C]Correlation[/C][/ROW]
[ROW][C]correlation used in KDE[/C][C]0.2446809612763[/C][/ROW]
[ROW][C]correlation(x,y)[/C][C]0.2446809612763[/C][/ROW]
[/TABLE]
Source: https://freestatistics.org/blog/index.php?pk=23481&T=1

Globally Unique Identifier (entire table): ba.freestatistics.org/blog/index.php?pk=23481&T=1

As an alternative you can also use a QR Code:  

The GUIDs for individual cells are displayed in the table below:

Bandwidth
x axis1.55385919601336
y axis287.611513510986
Correlation
correlation used in KDE0.2446809612763
correlation(x,y)0.2446809612763


Parameters (Session):
par1 = 50 ; par2 = 50 ; par3 = 0 ; par4 = 0 ; par5 = 0 ; par6 = Y ; par7 = Y ;
Parameters (R input):
par1 = 50 ; par2 = 50 ; par3 = 0 ; par4 = 0 ; par5 = 0 ; par6 = Y ; par7 = Y ;
R code (references can be found in the software module):
par1 <- as(par1,'numeric')
par2 <- as(par2,'numeric')
par3 <- as(par3,'numeric')
par4 <- as(par4,'numeric')
par5 <- as(par5,'numeric')
library('GenKern')
if (par3==0) par3 <- dpik(x)
if (par4==0) par4 <- dpik(y)
if (par5==0) par5 <- cor(x,y)
if (par1 > 500) par1 <- 500
if (par2 > 500) par2 <- 500
bitmap(file='bidensity.png')
op <- KernSur(x,y, xgridsize=par1, ygridsize=par2, correlation=par5, xbandwidth=par3, ybandwidth=par4)
image(op$xords, op$yords, op$zden, col=terrain.colors(100), axes=TRUE,main=main,xlab=xlab,ylab=ylab)
if (par6=='Y') contour(op$xords, op$yords, op$zden, add=TRUE)
if (par7=='Y') points(x,y)
(r<-lm(y ~ x))
abline(r)
box()
dev.off()
load(file='createtable')
a<-table.start()
a<-table.row.start(a)
a<-table.element(a,'Bandwidth',2,TRUE)
a<-table.row.end(a)
a<-table.row.start(a)
a<-table.element(a,'x axis',header=TRUE)
a<-table.element(a,par3)
a<-table.row.end(a)
a<-table.row.start(a)
a<-table.element(a,'y axis',header=TRUE)
a<-table.element(a,par4)
a<-table.row.end(a)
a<-table.row.start(a)
a<-table.element(a,'Correlation',2,TRUE)
a<-table.row.end(a)
a<-table.row.start(a)
a<-table.element(a,'correlation used in KDE',header=TRUE)
a<-table.element(a,par5)
a<-table.row.end(a)
a<-table.row.start(a)
a<-table.element(a,'correlation(x,y)',header=TRUE)
a<-table.element(a,cor(x,y))
a<-table.row.end(a)
a<-table.end(a)
table.save(a,file='mytable.tab')