Free Statistics

of Irreproducible Research!

Author's title

Author*The author of this computation has been verified*
R Software Modulerwasp_hierarchicalclustering.wasp
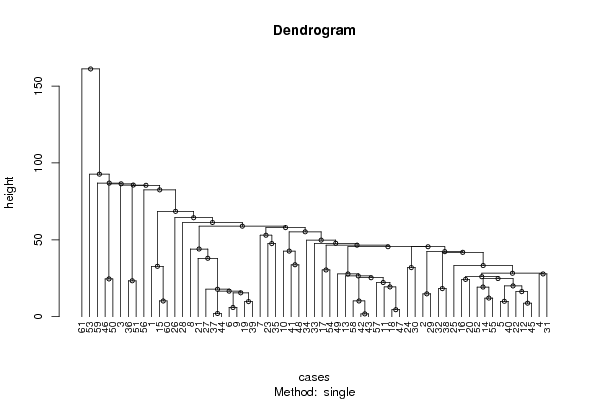
Title produced by softwareHierarchical Clustering
Date of computationTue, 11 Nov 2008 05:32:12 -0700
Cite this page as followsStatistical Computations at FreeStatistics.org, Office for Research Development and Education, URL https://freestatistics.org/blog/index.php?v=date/2008/Nov/11/t1226406790wt52ipvdiim9lcb.htm/, Retrieved Sun, 19 May 2024 08:42:02 +0000
Statistical Computations at FreeStatistics.org, Office for Research Development and Education, URL https://freestatistics.org/blog/index.php?pk=23391, Retrieved Sun, 19 May 2024 08:42:02 +0000
QR Codes:

Original text written by user:
IsPrivate?No (this computation is public)
User-defined keywords
Estimated Impact114
Family? (F = Feedback message, R = changed R code, M = changed R Module, P = changed Parameters, D = changed Data)
-       [Hierarchical Clustering] [Q2 Hierarchical C...] [2008-11-11 12:32:12] [21d7d81e7693ad6dde5aadefb1046611] [Current]
Feedback Forum

Post a new message
Dataseries X:
604.4	882.5	1.1663
883.9	789.6	1.1372
527.9	773.3	1.1139
756.2	804.3	1.1222
812.9	817.8	1.1692
655.6	836.7	1.1702
707.6	721.8	1.2286
612.6	760.8	1.2613
659.2	841.4	1.2646
833.4	1045.6	1.2262
727.8	949.2	1.1985
797.2	850.1	1.2007
753	957.4	1.2138
762	851.8	1.2266
613.7	913.9	1.2176
759.2	888	1.2218
816.4	973.8	1.249
736.8	927.6	1.2991
680.1	833	1.3408
736.5	879.5	1.3119
637.2	797.3	1.3014
801.9	834.5	1.3201
772.3	735.1	1.2938
897.3	835	1.2694
792.1	892.8	1.2165
826.8	697.2	1.2037
666.8	821.1	1.2292
906.6	732.7	1.2256
871.4	797.6	1.2015
891	866.3	1.1786
739.2	826.3	1.1856
833.6	778.6	1.2103
715.6	779.2	1.1938
871.6	951	1.202
751.6	692.3	1.2271
1005.5	841.4	1.277
681.2	857.3	1.265
837.3	760.7	1.2684
674.7	841.2	1.2811
806.3	810.3	1.2727
860.2	1007.4	1.2611
689.8	931.3	1.2881
691.6	931.2	1.3213
682.6	855.8	1.2999
800.1	858.4	1.3074
1023.7	925.9	1.3242
733.5	930.7	1.3516
875.3	1037.6	1.3511
770.2	979.2	1.3419
1005.7	942.6	1.3716
982.3	843.9	1.3622
742.9	854.3	1.3896
974.2	1029.8	1.4227
822.3	944	1.4684
773.2	856.4	1.457
750.9	1059.4	1.4718
708	959.3	1.4748
690	941.5	1.5527
652.8	1026.4	1.575
620.7	921.3	1.5557
461.9	968	1.5553


Summary of computational transaction
Raw Inputview raw input (R code)
Raw Outputview raw output of R engine
Computing time1 seconds
R Server'Gwilym Jenkins' @ 72.249.127.135

\begin{tabular}{lllllllll}
\hline
Summary of computational transaction \tabularnewline
Raw Input & view raw input (R code)  \tabularnewline
Raw Output & view raw output of R engine  \tabularnewline
Computing time & 1 seconds \tabularnewline
R Server & 'Gwilym Jenkins' @ 72.249.127.135 \tabularnewline
\hline
\end{tabular}
%Source: https://freestatistics.org/blog/index.php?pk=23391&T=0

[TABLE]
[ROW][C]Summary of computational transaction[/C][/ROW]
[ROW][C]Raw Input[/C][C]view raw input (R code) [/C][/ROW]
[ROW][C]Raw Output[/C][C]view raw output of R engine [/C][/ROW]
[ROW][C]Computing time[/C][C]1 seconds[/C][/ROW]
[ROW][C]R Server[/C][C]'Gwilym Jenkins' @ 72.249.127.135[/C][/ROW]
[/TABLE]
Source: https://freestatistics.org/blog/index.php?pk=23391&T=0

Globally Unique Identifier (entire table): ba.freestatistics.org/blog/index.php?pk=23391&T=0

As an alternative you can also use a QR Code:  

The GUIDs for individual cells are displayed in the table below:

Summary of computational transaction
Raw Inputview raw input (R code)
Raw Outputview raw output of R engine
Computing time1 seconds
R Server'Gwilym Jenkins' @ 72.249.127.135


Summary of Dendrogram
LabelHeight
11.80308131818846
22.05212524227931
34.52799693573216
45.92105660841032
58.79268928656069
69.8185316667005
79.9910315908819
810.1918747838658
910.2053913771105
1012.1100406341185
1114.8409613735095
1215.5012990504022
1316.2930738769577
1416.6003118476731
1517.8469172284740
1618.2784948945475
1719.2636073724524
1819.3588078044595
1919.9978191513475
2022.2289527798769
2123.3344650472215
2224.2393918655151
2324.5538641920167
2424.8144250324282
2525.3149376536858
2626.0001161014716
2726.5005704483885
2827.7686227532084
2927.802949835584
3028.2441430388674
3130.3792385743948
3231.9278600072100
3332.7483225782635
3433.2483086500652
3533.764746408051
3637.9816431034783
3741.8351992197958
3842.3065015977450
3942.6570697541451
4044.01603807716
4145.4925775309555
4245.4964391495643
4346.514606635013
4447.5429747585277
4547.732327897977
4649.7951902191367
4752.9740502722795
4855.2032620993543
4957.9548204297107
5058.8803884498056
5161.2609811752962
5264.362288539874
5368.5000705320076
5482.489677378506
5585.4647214459861
5685.61753165538
5786.4377939783287
5886.8876288089393
5992.7151153329919
60161.152611028460

\begin{tabular}{lllllllll}
\hline
Summary of Dendrogram \tabularnewline
Label & Height \tabularnewline
1 & 1.80308131818846 \tabularnewline
2 & 2.05212524227931 \tabularnewline
3 & 4.52799693573216 \tabularnewline
4 & 5.92105660841032 \tabularnewline
5 & 8.79268928656069 \tabularnewline
6 & 9.8185316667005 \tabularnewline
7 & 9.9910315908819 \tabularnewline
8 & 10.1918747838658 \tabularnewline
9 & 10.2053913771105 \tabularnewline
10 & 12.1100406341185 \tabularnewline
11 & 14.8409613735095 \tabularnewline
12 & 15.5012990504022 \tabularnewline
13 & 16.2930738769577 \tabularnewline
14 & 16.6003118476731 \tabularnewline
15 & 17.8469172284740 \tabularnewline
16 & 18.2784948945475 \tabularnewline
17 & 19.2636073724524 \tabularnewline
18 & 19.3588078044595 \tabularnewline
19 & 19.9978191513475 \tabularnewline
20 & 22.2289527798769 \tabularnewline
21 & 23.3344650472215 \tabularnewline
22 & 24.2393918655151 \tabularnewline
23 & 24.5538641920167 \tabularnewline
24 & 24.8144250324282 \tabularnewline
25 & 25.3149376536858 \tabularnewline
26 & 26.0001161014716 \tabularnewline
27 & 26.5005704483885 \tabularnewline
28 & 27.7686227532084 \tabularnewline
29 & 27.802949835584 \tabularnewline
30 & 28.2441430388674 \tabularnewline
31 & 30.3792385743948 \tabularnewline
32 & 31.9278600072100 \tabularnewline
33 & 32.7483225782635 \tabularnewline
34 & 33.2483086500652 \tabularnewline
35 & 33.764746408051 \tabularnewline
36 & 37.9816431034783 \tabularnewline
37 & 41.8351992197958 \tabularnewline
38 & 42.3065015977450 \tabularnewline
39 & 42.6570697541451 \tabularnewline
40 & 44.01603807716 \tabularnewline
41 & 45.4925775309555 \tabularnewline
42 & 45.4964391495643 \tabularnewline
43 & 46.514606635013 \tabularnewline
44 & 47.5429747585277 \tabularnewline
45 & 47.732327897977 \tabularnewline
46 & 49.7951902191367 \tabularnewline
47 & 52.9740502722795 \tabularnewline
48 & 55.2032620993543 \tabularnewline
49 & 57.9548204297107 \tabularnewline
50 & 58.8803884498056 \tabularnewline
51 & 61.2609811752962 \tabularnewline
52 & 64.362288539874 \tabularnewline
53 & 68.5000705320076 \tabularnewline
54 & 82.489677378506 \tabularnewline
55 & 85.4647214459861 \tabularnewline
56 & 85.61753165538 \tabularnewline
57 & 86.4377939783287 \tabularnewline
58 & 86.8876288089393 \tabularnewline
59 & 92.7151153329919 \tabularnewline
60 & 161.152611028460 \tabularnewline
\hline
\end{tabular}
%Source: https://freestatistics.org/blog/index.php?pk=23391&T=1

[TABLE]
[ROW][C]Summary of Dendrogram[/C][/ROW]
[ROW][C]Label[/C][C]Height[/C][/ROW]
[ROW][C]1[/C][C]1.80308131818846[/C][/ROW]
[ROW][C]2[/C][C]2.05212524227931[/C][/ROW]
[ROW][C]3[/C][C]4.52799693573216[/C][/ROW]
[ROW][C]4[/C][C]5.92105660841032[/C][/ROW]
[ROW][C]5[/C][C]8.79268928656069[/C][/ROW]
[ROW][C]6[/C][C]9.8185316667005[/C][/ROW]
[ROW][C]7[/C][C]9.9910315908819[/C][/ROW]
[ROW][C]8[/C][C]10.1918747838658[/C][/ROW]
[ROW][C]9[/C][C]10.2053913771105[/C][/ROW]
[ROW][C]10[/C][C]12.1100406341185[/C][/ROW]
[ROW][C]11[/C][C]14.8409613735095[/C][/ROW]
[ROW][C]12[/C][C]15.5012990504022[/C][/ROW]
[ROW][C]13[/C][C]16.2930738769577[/C][/ROW]
[ROW][C]14[/C][C]16.6003118476731[/C][/ROW]
[ROW][C]15[/C][C]17.8469172284740[/C][/ROW]
[ROW][C]16[/C][C]18.2784948945475[/C][/ROW]
[ROW][C]17[/C][C]19.2636073724524[/C][/ROW]
[ROW][C]18[/C][C]19.3588078044595[/C][/ROW]
[ROW][C]19[/C][C]19.9978191513475[/C][/ROW]
[ROW][C]20[/C][C]22.2289527798769[/C][/ROW]
[ROW][C]21[/C][C]23.3344650472215[/C][/ROW]
[ROW][C]22[/C][C]24.2393918655151[/C][/ROW]
[ROW][C]23[/C][C]24.5538641920167[/C][/ROW]
[ROW][C]24[/C][C]24.8144250324282[/C][/ROW]
[ROW][C]25[/C][C]25.3149376536858[/C][/ROW]
[ROW][C]26[/C][C]26.0001161014716[/C][/ROW]
[ROW][C]27[/C][C]26.5005704483885[/C][/ROW]
[ROW][C]28[/C][C]27.7686227532084[/C][/ROW]
[ROW][C]29[/C][C]27.802949835584[/C][/ROW]
[ROW][C]30[/C][C]28.2441430388674[/C][/ROW]
[ROW][C]31[/C][C]30.3792385743948[/C][/ROW]
[ROW][C]32[/C][C]31.9278600072100[/C][/ROW]
[ROW][C]33[/C][C]32.7483225782635[/C][/ROW]
[ROW][C]34[/C][C]33.2483086500652[/C][/ROW]
[ROW][C]35[/C][C]33.764746408051[/C][/ROW]
[ROW][C]36[/C][C]37.9816431034783[/C][/ROW]
[ROW][C]37[/C][C]41.8351992197958[/C][/ROW]
[ROW][C]38[/C][C]42.3065015977450[/C][/ROW]
[ROW][C]39[/C][C]42.6570697541451[/C][/ROW]
[ROW][C]40[/C][C]44.01603807716[/C][/ROW]
[ROW][C]41[/C][C]45.4925775309555[/C][/ROW]
[ROW][C]42[/C][C]45.4964391495643[/C][/ROW]
[ROW][C]43[/C][C]46.514606635013[/C][/ROW]
[ROW][C]44[/C][C]47.5429747585277[/C][/ROW]
[ROW][C]45[/C][C]47.732327897977[/C][/ROW]
[ROW][C]46[/C][C]49.7951902191367[/C][/ROW]
[ROW][C]47[/C][C]52.9740502722795[/C][/ROW]
[ROW][C]48[/C][C]55.2032620993543[/C][/ROW]
[ROW][C]49[/C][C]57.9548204297107[/C][/ROW]
[ROW][C]50[/C][C]58.8803884498056[/C][/ROW]
[ROW][C]51[/C][C]61.2609811752962[/C][/ROW]
[ROW][C]52[/C][C]64.362288539874[/C][/ROW]
[ROW][C]53[/C][C]68.5000705320076[/C][/ROW]
[ROW][C]54[/C][C]82.489677378506[/C][/ROW]
[ROW][C]55[/C][C]85.4647214459861[/C][/ROW]
[ROW][C]56[/C][C]85.61753165538[/C][/ROW]
[ROW][C]57[/C][C]86.4377939783287[/C][/ROW]
[ROW][C]58[/C][C]86.8876288089393[/C][/ROW]
[ROW][C]59[/C][C]92.7151153329919[/C][/ROW]
[ROW][C]60[/C][C]161.152611028460[/C][/ROW]
[/TABLE]
Source: https://freestatistics.org/blog/index.php?pk=23391&T=1

Globally Unique Identifier (entire table): ba.freestatistics.org/blog/index.php?pk=23391&T=1

As an alternative you can also use a QR Code:  

The GUIDs for individual cells are displayed in the table below:

Summary of Dendrogram
LabelHeight
11.80308131818846
22.05212524227931
34.52799693573216
45.92105660841032
58.79268928656069
69.8185316667005
79.9910315908819
810.1918747838658
910.2053913771105
1012.1100406341185
1114.8409613735095
1215.5012990504022
1316.2930738769577
1416.6003118476731
1517.8469172284740
1618.2784948945475
1719.2636073724524
1819.3588078044595
1919.9978191513475
2022.2289527798769
2123.3344650472215
2224.2393918655151
2324.5538641920167
2424.8144250324282
2525.3149376536858
2626.0001161014716
2726.5005704483885
2827.7686227532084
2927.802949835584
3028.2441430388674
3130.3792385743948
3231.9278600072100
3332.7483225782635
3433.2483086500652
3533.764746408051
3637.9816431034783
3741.8351992197958
3842.3065015977450
3942.6570697541451
4044.01603807716
4145.4925775309555
4245.4964391495643
4346.514606635013
4447.5429747585277
4547.732327897977
4649.7951902191367
4752.9740502722795
4855.2032620993543
4957.9548204297107
5058.8803884498056
5161.2609811752962
5264.362288539874
5368.5000705320076
5482.489677378506
5585.4647214459861
5685.61753165538
5786.4377939783287
5886.8876288089393
5992.7151153329919
60161.152611028460


Parameters (Session):
par1 = single ; par2 = ALL ; par3 = FALSE ; par4 = FALSE ;
Parameters (R input):
par1 = single ; par2 = ALL ; par3 = FALSE ; par4 = FALSE ;
R code (references can be found in the software module):
par3 <- as.logical(par3)
par4 <- as.logical(par4)
if (par3 == 'TRUE'){
dum = xlab
xlab = ylab
ylab = dum
}
x <- t(y)
hc <- hclust(dist(x),method=par1)
d <- as.dendrogram(hc)
str(d)
mysub <- paste('Method: ',par1)
bitmap(file='test1.png')
if (par4 == 'TRUE'){
plot(d,main=main,ylab=ylab,xlab=xlab,horiz=par3, nodePar=list(pch = c(1,NA), cex=0.8, lab.cex = 0.8),type='t',center=T, sub=mysub)
} else {
plot(d,main=main,ylab=ylab,xlab=xlab,horiz=par3, nodePar=list(pch = c(1,NA), cex=0.8, lab.cex = 0.8), sub=mysub)
}
dev.off()
if (par2 != 'ALL'){
if (par3 == 'TRUE'){
ylab = 'cluster'
} else {
xlab = 'cluster'
}
par2 <- as.numeric(par2)
memb <- cutree(hc, k = par2)
cent <- NULL
for(k in 1:par2){
cent <- rbind(cent, colMeans(x[memb == k, , drop = FALSE]))
}
hc1 <- hclust(dist(cent),method=par1, members = table(memb))
de <- as.dendrogram(hc1)
bitmap(file='test2.png')
if (par4 == 'TRUE'){
plot(de,main=main,ylab=ylab,xlab=xlab,horiz=par3, nodePar=list(pch = c(1,NA), cex=0.8, lab.cex = 0.8),type='t',center=T, sub=mysub)
} else {
plot(de,main=main,ylab=ylab,xlab=xlab,horiz=par3, nodePar=list(pch = c(1,NA), cex=0.8, lab.cex = 0.8), sub=mysub)
}
dev.off()
str(de)
}
load(file='createtable')
a<-table.start()
a<-table.row.start(a)
a<-table.element(a,'Summary of Dendrogram',2,TRUE)
a<-table.row.end(a)
a<-table.row.start(a)
a<-table.element(a,'Label',header=TRUE)
a<-table.element(a,'Height',header=TRUE)
a<-table.row.end(a)
num <- length(x[,1])-1
for (i in 1:num)
{
a<-table.row.start(a)
a<-table.element(a,hc$labels[i])
a<-table.element(a,hc$height[i])
a<-table.row.end(a)
}
a<-table.end(a)
table.save(a,file='mytable1.tab')
if (par2 != 'ALL'){
a<-table.start()
a<-table.row.start(a)
a<-table.element(a,'Summary of Cut Dendrogram',2,TRUE)
a<-table.row.end(a)
a<-table.row.start(a)
a<-table.element(a,'Label',header=TRUE)
a<-table.element(a,'Height',header=TRUE)
a<-table.row.end(a)
num <- par2-1
for (i in 1:num)
{
a<-table.row.start(a)
a<-table.element(a,i)
a<-table.element(a,hc1$height[i])
a<-table.row.end(a)
}
a<-table.end(a)
table.save(a,file='mytable2.tab')
}