Free Statistics

of Irreproducible Research!

Author's title

Author*The author of this computation has been verified*
R Software Modulerwasp_boxcoxlin.wasp
Title produced by softwareBox-Cox Linearity Plot
Date of computationMon, 10 Nov 2008 05:01:47 -0700
Cite this page as followsStatistical Computations at FreeStatistics.org, Office for Research Development and Education, URL https://freestatistics.org/blog/index.php?v=date/2008/Nov/10/t1226318886ch0azhrwaakq54i.htm/, Retrieved Sun, 19 May 2024 08:00:48 +0000
Statistical Computations at FreeStatistics.org, Office for Research Development and Education, URL https://freestatistics.org/blog/index.php?pk=22982, Retrieved Sun, 19 May 2024 08:00:48 +0000
QR Codes:

Original text written by user:
IsPrivate?No (this computation is public)
User-defined keywords
Estimated Impact147
Family? (F = Feedback message, R = changed R code, M = changed R Module, P = changed Parameters, D = changed Data)
F       [Box-Cox Linearity Plot] [Various EDA Topic...] [2008-11-10 12:01:47] [dafd615cb3e0decc017580d68ecea30a] [Current]
Feedback Forum
2008-11-14 11:13:32 [Tamara Witters] [reply
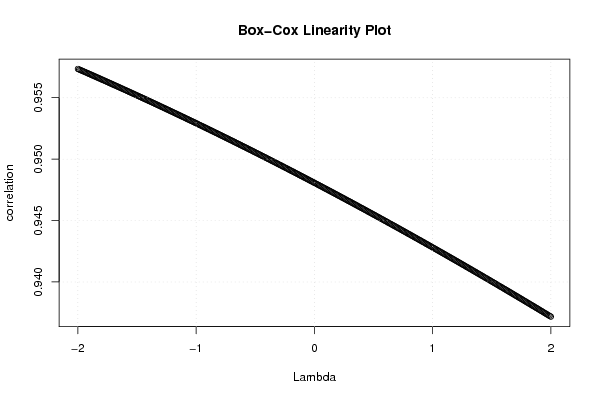
De conclusie is niet helemaal juist. We kunnen nl niet met zekerheid zeggen dat de correlatie het hoogst is bij lambda 2.
Uitleg:
Met deze formule kan je een tijdreeks transformeren en op die manier problemen oplossen. VB: De scatterplot doet denken dat er een lineair verband bestaat, maar eigenlijk is er geen verband.
Met deze formule probeert de PC alle transformaties voor de verschillende lambda-waarden en op die manier ervoor te zorgen dat de correlatie het grootst wordt.
We moeten afleiden uit onze grafiek waar het maximum bereikt word, want daar is de correlatie het grootst.
In dit geval zouden we kunnen stellen dat de correlatie het grootst is bij lambda 2 nl: 0.957343565830438. MAAR indien we de grenzen zouden vergroten kunnen we zien dat de grafiek nog even zou stijgen en dan pas zou dalen. En daar wordt pas het maximum bereikt. Bijgevolg kunnen we geen besluit maken want het maximum is niet bereikt.
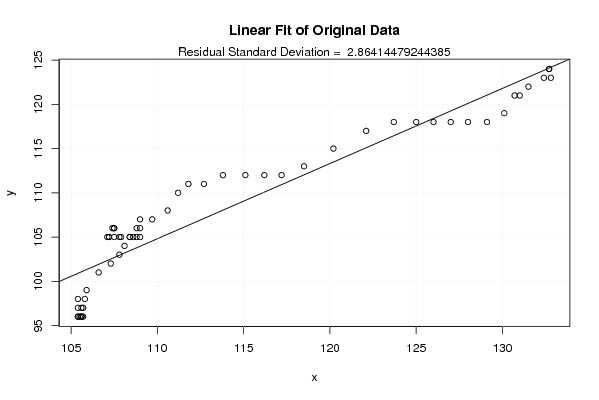
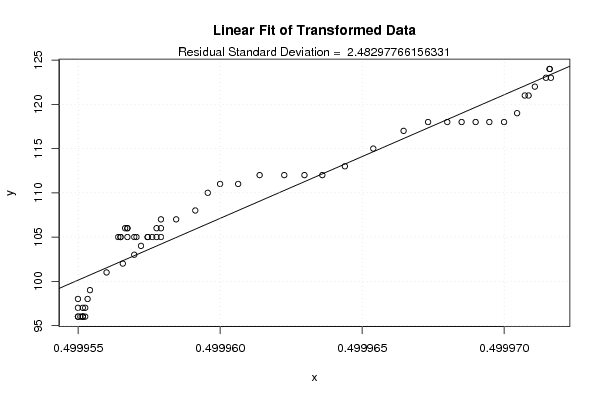
De twee volgende grafieken geven ook de correlatie weer. Indien de verschillende puntjes (observaties) gelijk zouden vallen op de rechte dan kunnen we spreken van een grote correlatie.

2008-11-22 09:46:19 [Jeroen Michel] [reply
Net zoals de vorige student zegt is de conclusie niet 100% juist.

Het is niet met zekerheid te zeggen dat de correlatie het grootste is bij lambda 2. Op deze manier kan een tijdreeks getransformeerd worden, zo kan de scatterplot weergeven waar er een lineair verband bestaat, maar er is echter geen verband tussen de variabelen.

Uit de grafische weergave moet kunnen worden afgeleid waar het maximum wordt bereikt omdat de correlatie daar de grootste is.
Dat is echter niet het geval zoals men vermeld bij lambda twee, want als we de grenzen zouden vergroten zou de grafiek nog kunnen stijgen en plots dalen.

Bij de andere grafische weergaves moeten we de volgende interpretatie maken. Indien de puntjes op de rechte samenvallen betekent dit dat er een grote correlatie bestaat.

Post a new message
Dataseries X:
105.8
105.7
105.5
105.4
105.4
105.6
105.7
105.6
105.6
105.6
105.4
105.4
105.9
106.6
107.3
107.8
108.1
108.4
108.8
109
109
109
108.8
108.4
107.9
107.5
107.2
107.1
107.2
107.4
107.5
107.5
107.8
108.6
109.7
110.6
111.2
111.8
112.7
113.8
115.1
116.2
117.2
118.5
120.2
122.1
123.7
125
126
127
128
129.1
130.1
130.7
131
131.5
132.4
132.8
132.7
132.7
Dataseries Y:
98
97
96
96
96
96
96
96
96
97
97
98
99
101
102
103
104
105
106
107
106
105
105
105
105
105
105
105
105
106
106
106
105
105
107
108
110
111
111
112
112
112
112
113
115
117
118
118
118
118
118
118
119
121
121
122
123
123
124
124


Summary of computational transaction
Raw Inputview raw input (R code)
Raw Outputview raw output of R engine
Computing time2 seconds
R Server'Gwilym Jenkins' @ 72.249.127.135

\begin{tabular}{lllllllll}
\hline
Summary of computational transaction \tabularnewline
Raw Input & view raw input (R code)  \tabularnewline
Raw Output & view raw output of R engine  \tabularnewline
Computing time & 2 seconds \tabularnewline
R Server & 'Gwilym Jenkins' @ 72.249.127.135 \tabularnewline
\hline
\end{tabular}
%Source: https://freestatistics.org/blog/index.php?pk=22982&T=0

[TABLE]
[ROW][C]Summary of computational transaction[/C][/ROW]
[ROW][C]Raw Input[/C][C]view raw input (R code) [/C][/ROW]
[ROW][C]Raw Output[/C][C]view raw output of R engine [/C][/ROW]
[ROW][C]Computing time[/C][C]2 seconds[/C][/ROW]
[ROW][C]R Server[/C][C]'Gwilym Jenkins' @ 72.249.127.135[/C][/ROW]
[/TABLE]
Source: https://freestatistics.org/blog/index.php?pk=22982&T=0

Globally Unique Identifier (entire table): ba.freestatistics.org/blog/index.php?pk=22982&T=0

As an alternative you can also use a QR Code:  

The GUIDs for individual cells are displayed in the table below:

Summary of computational transaction
Raw Inputview raw input (R code)
Raw Outputview raw output of R engine
Computing time2 seconds
R Server'Gwilym Jenkins' @ 72.249.127.135


Box-Cox Linearity Plot
# observations x60
maximum correlation0.957343565830438
optimal lambda(x)-2
Residual SD (orginial)2.86414479244385
Residual SD (transformed)2.48297766156331

\begin{tabular}{lllllllll}
\hline
Box-Cox Linearity Plot \tabularnewline
# observations x & 60 \tabularnewline
maximum correlation & 0.957343565830438 \tabularnewline
optimal lambda(x) & -2 \tabularnewline
Residual SD (orginial) & 2.86414479244385 \tabularnewline
Residual SD (transformed) & 2.48297766156331 \tabularnewline
\hline
\end{tabular}
%Source: https://freestatistics.org/blog/index.php?pk=22982&T=1

[TABLE]
[ROW][C]Box-Cox Linearity Plot[/C][/ROW]
[ROW][C]# observations x[/C][C]60[/C][/ROW]
[ROW][C]maximum correlation[/C][C]0.957343565830438[/C][/ROW]
[ROW][C]optimal lambda(x)[/C][C]-2[/C][/ROW]
[ROW][C]Residual SD (orginial)[/C][C]2.86414479244385[/C][/ROW]
[ROW][C]Residual SD (transformed)[/C][C]2.48297766156331[/C][/ROW]
[/TABLE]
Source: https://freestatistics.org/blog/index.php?pk=22982&T=1

Globally Unique Identifier (entire table): ba.freestatistics.org/blog/index.php?pk=22982&T=1

As an alternative you can also use a QR Code:  

The GUIDs for individual cells are displayed in the table below:

Box-Cox Linearity Plot
# observations x60
maximum correlation0.957343565830438
optimal lambda(x)-2
Residual SD (orginial)2.86414479244385
Residual SD (transformed)2.48297766156331


Parameters (Session):
par1 = ward ; par2 = ALL ; par3 = FALSE ; par4 = FALSE ;
Parameters (R input):
R code (references can be found in the software module):
n <- length(x)
c <- array(NA,dim=c(401))
l <- array(NA,dim=c(401))
mx <- 0
mxli <- -999
for (i in 1:401)
{
l[i] <- (i-201)/100
if (l[i] != 0)
{
x1 <- (x^l[i] - 1) / l[i]
} else {
x1 <- log(x)
}
c[i] <- cor(x1,y)
if (mx < abs(c[i]))
{
mx <- abs(c[i])
mxli <- l[i]
}
}
c
mx
mxli
if (mxli != 0)
{
x1 <- (x^mxli - 1) / mxli
} else {
x1 <- log(x)
}
r<-lm(y~x)
se <- sqrt(var(r$residuals))
r1 <- lm(y~x1)
se1 <- sqrt(var(r1$residuals))
bitmap(file='test1.png')
plot(l,c,main='Box-Cox Linearity Plot',xlab='Lambda',ylab='correlation')
grid()
dev.off()
bitmap(file='test2.png')
plot(x,y,main='Linear Fit of Original Data',xlab='x',ylab='y')
abline(r)
grid()
mtext(paste('Residual Standard Deviation = ',se))
dev.off()
bitmap(file='test3.png')
plot(x1,y,main='Linear Fit of Transformed Data',xlab='x',ylab='y')
abline(r1)
grid()
mtext(paste('Residual Standard Deviation = ',se1))
dev.off()
load(file='createtable')
a<-table.start()
a<-table.row.start(a)
a<-table.element(a,'Box-Cox Linearity Plot',2,TRUE)
a<-table.row.end(a)
a<-table.row.start(a)
a<-table.element(a,'# observations x',header=TRUE)
a<-table.element(a,n)
a<-table.row.end(a)
a<-table.row.start(a)
a<-table.element(a,'maximum correlation',header=TRUE)
a<-table.element(a,mx)
a<-table.row.end(a)
a<-table.row.start(a)
a<-table.element(a,'optimal lambda(x)',header=TRUE)
a<-table.element(a,mxli)
a<-table.row.end(a)
a<-table.row.start(a)
a<-table.element(a,'Residual SD (orginial)',header=TRUE)
a<-table.element(a,se)
a<-table.row.end(a)
a<-table.row.start(a)
a<-table.element(a,'Residual SD (transformed)',header=TRUE)
a<-table.element(a,se1)
a<-table.row.end(a)
a<-table.end(a)
table.save(a,file='mytable.tab')