Free Statistics

of Irreproducible Research!

Author's title

Author*Unverified author*
R Software Modulerwasp_boxcoxnorm.wasp
Title produced by softwareBox-Cox Normality Plot
Date of computationSun, 09 Nov 2008 13:08:16 -0700
Cite this page as followsStatistical Computations at FreeStatistics.org, Office for Research Development and Education, URL https://freestatistics.org/blog/index.php?v=date/2008/Nov/09/t1226261366ec5gz2085ilysvw.htm/, Retrieved Sun, 19 May 2024 09:09:38 +0000
Statistical Computations at FreeStatistics.org, Office for Research Development and Education, URL https://freestatistics.org/blog/index.php?pk=22858, Retrieved Sun, 19 May 2024 09:09:38 +0000
QR Codes:

Original text written by user:
IsPrivate?No (this computation is public)
User-defined keywordsVan Dooren Leen
Estimated Impact183
Family? (F = Feedback message, R = changed R code, M = changed R Module, P = changed Parameters, D = changed Data)
F       [Box-Cox Normality Plot] [Various EDA topic...] [2008-11-09 20:08:16] [d175f84d503eb4f2a43145d5e67795b5] [Current]
F    D    [Box-Cox Normality Plot] [Various EDA topic...] [2008-11-12 17:02:45] [9c2d53170eb755e9ae5fcf19d2174a32]
Feedback Forum
2008-11-16 15:51:24 [Steven Vercammen] [reply
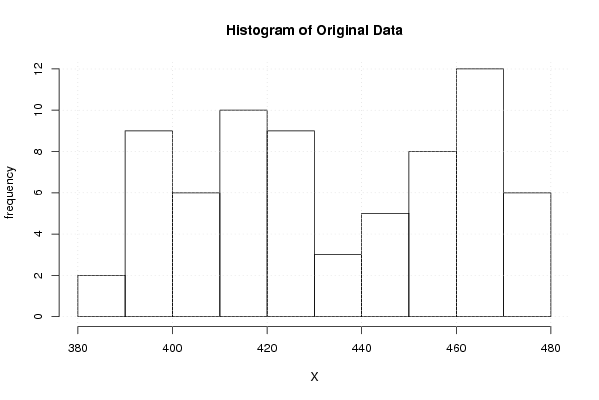
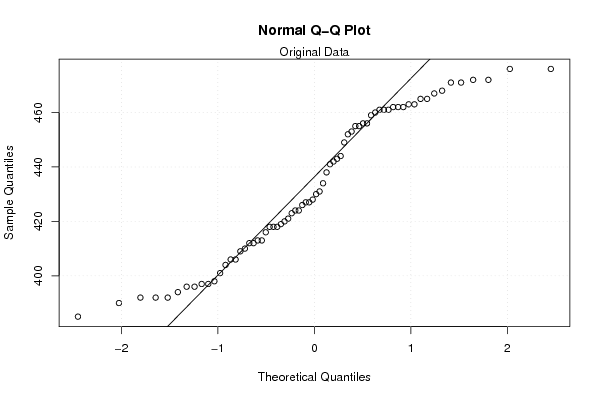
Ook hier worden te weinig grafieken opgenomen in de oplossing en is de conclusie te beperkt. Het doel van deze box-cox normality is om de data te transformeren zodat ze normaler verdeeld worden. Het is veel gemakkelijker om berekeningen te doen op normaal verdeelde data. De volgende formule wordt toegpast om de data te transformeren: T(Y) = (Y^lambda -1) / lambda waarbij lambda de transformatieparameter is. Op de box-cox normality plot wordt een curve weergegeven waarvan het maximum de optimale lambda vormt. Omdat het effect van de transformatie na te gaan kan men de histogrammen en QQ-plots voor en na transformatie vergelijken. In dit geval is de optimale lambda 2 en heeft de transformatie een zeer sterk effect. Wanneer men vergelijkt met de box-cox linearity blijkt dat we een andere optimale waarde voor lambda verkrijgen.
2008-11-16 16:05:12 [074508d5a5a3592082de3e836d27af7d] [reply
Steven Vercammen heeft je een perfecte uitleg gegeven over deze vraag. Meer kan ik daar niet aan toevoegen.
2008-11-16 16:40:42 [006ad2c49b6a7c2ad6ab685cfc1dae56] [reply
Het doel van deze box-cox normality is om de data te transformeren zodat ze normaler verdeeld worden. Net zoals bij de box-cox linearity plot wordt er een maximum bereikt bij de optimale lambda-waarde voor transformatie. In dit geval is de grafiek maximaal bij 2 maar dit kan je niet als een maximum beschouwen omdat de grafiek na lambda=2 duidelijk nog stijgt. Om het maximum te kennen moet je dus een andere grafieken maken met grotere lambda-waarden. De transformatie heeft een zeer sterk effect. De grafiek is helemaal veranderd.
2008-11-24 11:54:53 [Anouk Greeve] [reply
Wanneer we kunnen spreken van lineariteit in de Normality Plot is er een normale verdeling. Het doel van deze box-cox normality is om de data te transformeren zodat ze normaler verdeeld worden. We moeten een optimale keuze maken voor lambda. Zo zien we dat de transformatie hier een sterk effect zal hebben.

Post a new message
Dataseries X:
392
394
392
396
392
396
419
421
420
418
410
418
426
428
430
424
423
427
441
449
452
462
455
461
461
463
462
456
455
456
472
472
471
465
459
465
468
467
463
460
462
461
476
476
471
453
443
442
444
438
427
424
416
406
431
434
418
412
404
409
412
406
398
397
385
390
413
413
401
397


Summary of computational transaction
Raw Inputview raw input (R code)
Raw Outputview raw output of R engine
Computing time2 seconds
R Server'Gwilym Jenkins' @ 72.249.127.135

\begin{tabular}{lllllllll}
\hline
Summary of computational transaction \tabularnewline
Raw Input & view raw input (R code)  \tabularnewline
Raw Output & view raw output of R engine  \tabularnewline
Computing time & 2 seconds \tabularnewline
R Server & 'Gwilym Jenkins' @ 72.249.127.135 \tabularnewline
\hline
\end{tabular}
%Source: https://freestatistics.org/blog/index.php?pk=22858&T=0

[TABLE]
[ROW][C]Summary of computational transaction[/C][/ROW]
[ROW][C]Raw Input[/C][C]view raw input (R code) [/C][/ROW]
[ROW][C]Raw Output[/C][C]view raw output of R engine [/C][/ROW]
[ROW][C]Computing time[/C][C]2 seconds[/C][/ROW]
[ROW][C]R Server[/C][C]'Gwilym Jenkins' @ 72.249.127.135[/C][/ROW]
[/TABLE]
Source: https://freestatistics.org/blog/index.php?pk=22858&T=0

Globally Unique Identifier (entire table): ba.freestatistics.org/blog/index.php?pk=22858&T=0

As an alternative you can also use a QR Code:  

The GUIDs for individual cells are displayed in the table below:

Summary of computational transaction
Raw Inputview raw input (R code)
Raw Outputview raw output of R engine
Computing time2 seconds
R Server'Gwilym Jenkins' @ 72.249.127.135


Box-Cox Normality Plot
# observations x70
maximum correlation0
optimal lambda-999

\begin{tabular}{lllllllll}
\hline
Box-Cox Normality Plot \tabularnewline
# observations x & 70 \tabularnewline
maximum correlation & 0 \tabularnewline
optimal lambda & -999 \tabularnewline
\hline
\end{tabular}
%Source: https://freestatistics.org/blog/index.php?pk=22858&T=1

[TABLE]
[ROW][C]Box-Cox Normality Plot[/C][/ROW]
[ROW][C]# observations x[/C][C]70[/C][/ROW]
[ROW][C]maximum correlation[/C][C]0[/C][/ROW]
[ROW][C]optimal lambda[/C][C]-999[/C][/ROW]
[/TABLE]
Source: https://freestatistics.org/blog/index.php?pk=22858&T=1

Globally Unique Identifier (entire table): ba.freestatistics.org/blog/index.php?pk=22858&T=1

As an alternative you can also use a QR Code:  

The GUIDs for individual cells are displayed in the table below:

Box-Cox Normality Plot
# observations x70
maximum correlation0
optimal lambda-999


Parameters (Session):
Parameters (R input):
R code (references can be found in the software module):
n <- length(x)
c <- array(NA,dim=c(401))
l <- array(NA,dim=c(401))
mx <- 0
mxli <- -999
for (i in 1:401)
{
l[i] <- (i-201)/100
if (l[i] != 0)
{
x1 <- (x^l[i] - 1) / l[i]
} else {
x1 <- log(x)
}
c[i] <- cor(qnorm(ppoints(x), mean=0, sd=1),x1)
if (mx < c[i])
{
mx <- c[i]
mxli <- l[i]
}
}
c
mx
mxli
if (mxli != 0)
{
x1 <- (x^mxli - 1) / mxli
} else {
x1 <- log(x)
}
bitmap(file='test1.png')
plot(l,c,main='Box-Cox Normality Plot',xlab='Lambda',ylab='correlation')
mtext(paste('Optimal Lambda =',mxli))
grid()
dev.off()
bitmap(file='test2.png')
hist(x,main='Histogram of Original Data',xlab='X',ylab='frequency')
grid()
dev.off()
bitmap(file='test3.png')
hist(x1,main='Histogram of Transformed Data',xlab='X',ylab='frequency')
grid()
dev.off()
bitmap(file='test4.png')
qqnorm(x)
qqline(x)
grid()
mtext('Original Data')
dev.off()
bitmap(file='test5.png')
qqnorm(x1)
qqline(x1)
grid()
mtext('Transformed Data')
dev.off()
load(file='createtable')
a<-table.start()
a<-table.row.start(a)
a<-table.element(a,'Box-Cox Normality Plot',2,TRUE)
a<-table.row.end(a)
a<-table.row.start(a)
a<-table.element(a,'# observations x',header=TRUE)
a<-table.element(a,n)
a<-table.row.end(a)
a<-table.row.start(a)
a<-table.element(a,'maximum correlation',header=TRUE)
a<-table.element(a,mx)
a<-table.row.end(a)
a<-table.row.start(a)
a<-table.element(a,'optimal lambda',header=TRUE)
a<-table.element(a,mxli)
a<-table.row.end(a)
a<-table.end(a)
table.save(a,file='mytable.tab')