Free Statistics

of Irreproducible Research!

Author's title

Author*The author of this computation has been verified*
R Software Modulerwasp_notchedbox1.wasp
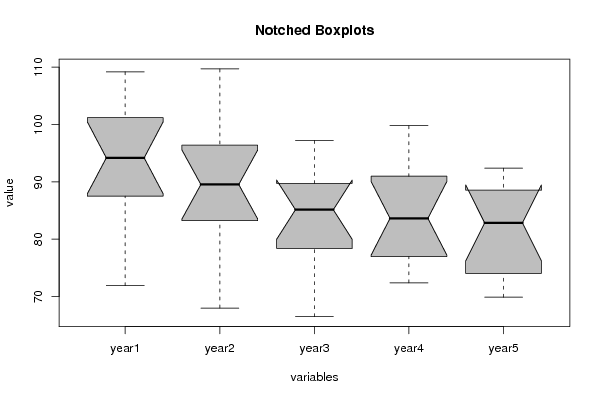
Title produced by softwareNotched Boxplots
Date of computationSun, 09 Nov 2008 13:05:46 -0700
Cite this page as followsStatistical Computations at FreeStatistics.org, Office for Research Development and Education, URL https://freestatistics.org/blog/index.php?v=date/2008/Nov/09/t1226261195on5cgmg59lqg9ar.htm/, Retrieved Sun, 19 May 2024 09:22:48 +0000
Statistical Computations at FreeStatistics.org, Office for Research Development and Education, URL https://freestatistics.org/blog/index.php?pk=22855, Retrieved Sun, 19 May 2024 09:22:48 +0000
QR Codes:

Original text written by user:
IsPrivate?No (this computation is public)
User-defined keywords
Estimated Impact160
Family? (F = Feedback message, R = changed R code, M = changed R Module, P = changed Parameters, D = changed Data)
F       [Notched Boxplots] [vraag 1] [2008-11-09 20:05:46] [3dc594a6c62226e1e98766c4d385bfaa] [Current]
Feedback Forum
2008-11-19 15:49:11 [] [reply
De student heeft deze vraag correct opgelost en de juiste berekeningsmethode toegepast.
2008-11-19 16:00:02 [Nathalie Koulouris] [reply
De student heeft deze vraag correct opgelost en de juiste berekeningsmethode toegepast.
2008-11-19 21:07:32 [Michaël De Kuyer] [reply
Deze vraag heb ik gedeeltelijk juist beantwoord. Ik heb een vergelijking gedaan tussen de eerste vijf jaar, maar heb geen vergelijking gedaan met het basisjaar. Zo had ik kunnen vaststellen dat vanaf jaar 2 de uiterste waarde van het betrouwbaarheidsinterval lager dan 100 is. Hierdoor kunnen we vanaf jaar 2 spreken over een significant verschil ten opzichte van het basisjaar.

Post a new message
Dataseries X:
109.20	96.40	90.00	99.60	91.00
88.60	91.10	88.00	84.20	80.10
94.30	84.40	76.10	75.10	73.60
98.30	86.40	82.50	92.00	86.40
86.40	88.00	81.40	80.80	74.50
80.60	75.10	66.50	73.10	71.20
104.10	109.70	97.20	99.80	92.40
108.20	103.00	94.10	90.00	81.50
93.40	82.10	80.70	83.10	85.30
71.90	68.00	70.50	72.40	69.90
94.10	96.40	87.80	78.80	84.20
94.90	94.30	89.50	87.30	90.70


Summary of computational transaction
Raw Inputview raw input (R code)
Raw Outputview raw output of R engine
Computing time1 seconds
R Server'Gwilym Jenkins' @ 72.249.127.135

\begin{tabular}{lllllllll}
\hline
Summary of computational transaction \tabularnewline
Raw Input & view raw input (R code)  \tabularnewline
Raw Output & view raw output of R engine  \tabularnewline
Computing time & 1 seconds \tabularnewline
R Server & 'Gwilym Jenkins' @ 72.249.127.135 \tabularnewline
\hline
\end{tabular}
%Source: https://freestatistics.org/blog/index.php?pk=22855&T=0

[TABLE]
[ROW][C]Summary of computational transaction[/C][/ROW]
[ROW][C]Raw Input[/C][C]view raw input (R code) [/C][/ROW]
[ROW][C]Raw Output[/C][C]view raw output of R engine [/C][/ROW]
[ROW][C]Computing time[/C][C]1 seconds[/C][/ROW]
[ROW][C]R Server[/C][C]'Gwilym Jenkins' @ 72.249.127.135[/C][/ROW]
[/TABLE]
Source: https://freestatistics.org/blog/index.php?pk=22855&T=0

Globally Unique Identifier (entire table): ba.freestatistics.org/blog/index.php?pk=22855&T=0

As an alternative you can also use a QR Code:  

The GUIDs for individual cells are displayed in the table below:

Summary of computational transaction
Raw Inputview raw input (R code)
Raw Outputview raw output of R engine
Computing time1 seconds
R Server'Gwilym Jenkins' @ 72.249.127.135


Boxplot statistics
Variablelower whiskerlower hingemedianupper hingeupper whisker
year171.987.594.2101.2109.2
year26883.2589.5596.4109.7
year366.578.485.1589.7597.2
year472.476.9583.659199.8
year569.974.0582.8588.5592.4

\begin{tabular}{lllllllll}
\hline
Boxplot statistics \tabularnewline
Variable & lower whisker & lower hinge & median & upper hinge & upper whisker \tabularnewline
year1 & 71.9 & 87.5 & 94.2 & 101.2 & 109.2 \tabularnewline
year2 & 68 & 83.25 & 89.55 & 96.4 & 109.7 \tabularnewline
year3 & 66.5 & 78.4 & 85.15 & 89.75 & 97.2 \tabularnewline
year4 & 72.4 & 76.95 & 83.65 & 91 & 99.8 \tabularnewline
year5 & 69.9 & 74.05 & 82.85 & 88.55 & 92.4 \tabularnewline
\hline
\end{tabular}
%Source: https://freestatistics.org/blog/index.php?pk=22855&T=1

[TABLE]
[ROW][C]Boxplot statistics[/C][/ROW]
[ROW][C]Variable[/C][C]lower whisker[/C][C]lower hinge[/C][C]median[/C][C]upper hinge[/C][C]upper whisker[/C][/ROW]
[ROW][C]year1[/C][C]71.9[/C][C]87.5[/C][C]94.2[/C][C]101.2[/C][C]109.2[/C][/ROW]
[ROW][C]year2[/C][C]68[/C][C]83.25[/C][C]89.55[/C][C]96.4[/C][C]109.7[/C][/ROW]
[ROW][C]year3[/C][C]66.5[/C][C]78.4[/C][C]85.15[/C][C]89.75[/C][C]97.2[/C][/ROW]
[ROW][C]year4[/C][C]72.4[/C][C]76.95[/C][C]83.65[/C][C]91[/C][C]99.8[/C][/ROW]
[ROW][C]year5[/C][C]69.9[/C][C]74.05[/C][C]82.85[/C][C]88.55[/C][C]92.4[/C][/ROW]
[/TABLE]
Source: https://freestatistics.org/blog/index.php?pk=22855&T=1

Globally Unique Identifier (entire table): ba.freestatistics.org/blog/index.php?pk=22855&T=1

As an alternative you can also use a QR Code:  

The GUIDs for individual cells are displayed in the table below:

Boxplot statistics
Variablelower whiskerlower hingemedianupper hingeupper whisker
year171.987.594.2101.2109.2
year26883.2589.5596.4109.7
year366.578.485.1589.7597.2
year472.476.9583.659199.8
year569.974.0582.8588.5592.4


Boxplot Notches
Variablelower boundmedianupper bound
year187.951338036560794.2100.448661963439
year283.552196728523689.5595.5478032714764
year379.973188811311285.1590.3268111886888
year477.241700687129883.6590.0582993128703
year576.236452666432882.8589.4635473335672

\begin{tabular}{lllllllll}
\hline
Boxplot Notches \tabularnewline
Variable & lower bound & median & upper bound \tabularnewline
year1 & 87.9513380365607 & 94.2 & 100.448661963439 \tabularnewline
year2 & 83.5521967285236 & 89.55 & 95.5478032714764 \tabularnewline
year3 & 79.9731888113112 & 85.15 & 90.3268111886888 \tabularnewline
year4 & 77.2417006871298 & 83.65 & 90.0582993128703 \tabularnewline
year5 & 76.2364526664328 & 82.85 & 89.4635473335672 \tabularnewline
\hline
\end{tabular}
%Source: https://freestatistics.org/blog/index.php?pk=22855&T=2

[TABLE]
[ROW][C]Boxplot Notches[/C][/ROW]
[ROW][C]Variable[/C][C]lower bound[/C][C]median[/C][C]upper bound[/C][/ROW]
[ROW][C]year1[/C][C]87.9513380365607[/C][C]94.2[/C][C]100.448661963439[/C][/ROW]
[ROW][C]year2[/C][C]83.5521967285236[/C][C]89.55[/C][C]95.5478032714764[/C][/ROW]
[ROW][C]year3[/C][C]79.9731888113112[/C][C]85.15[/C][C]90.3268111886888[/C][/ROW]
[ROW][C]year4[/C][C]77.2417006871298[/C][C]83.65[/C][C]90.0582993128703[/C][/ROW]
[ROW][C]year5[/C][C]76.2364526664328[/C][C]82.85[/C][C]89.4635473335672[/C][/ROW]
[/TABLE]
Source: https://freestatistics.org/blog/index.php?pk=22855&T=2

Globally Unique Identifier (entire table): ba.freestatistics.org/blog/index.php?pk=22855&T=2

As an alternative you can also use a QR Code:  

The GUIDs for individual cells are displayed in the table below:

Boxplot Notches
Variablelower boundmedianupper bound
year187.951338036560794.2100.448661963439
year283.552196728523689.5595.5478032714764
year379.973188811311285.1590.3268111886888
year477.241700687129883.6590.0582993128703
year576.236452666432882.8589.4635473335672


Parameters (Session):
par1 = grey ;
Parameters (R input):
par1 = grey ;
R code (references can be found in the software module):
z <- as.data.frame(t(y))
bitmap(file='test1.png')
(r<-boxplot(z ,xlab=xlab,ylab=ylab,main=main,notch=TRUE,col=par1))
dev.off()
load(file='createtable')
a<-table.start()
a<-table.row.start(a)
a<-table.element(a,hyperlink('overview.htm','Boxplot statistics','Boxplot overview'),6,TRUE)
a<-table.row.end(a)
a<-table.row.start(a)
a<-table.element(a,'Variable',1,TRUE)
a<-table.element(a,hyperlink('lower_whisker.htm','lower whisker','definition of lower whisker'),1,TRUE)
a<-table.element(a,hyperlink('lower_hinge.htm','lower hinge','definition of lower hinge'),1,TRUE)
a<-table.element(a,hyperlink('central_tendency.htm','median','definitions about measures of central tendency'),1,TRUE)
a<-table.element(a,hyperlink('upper_hinge.htm','upper hinge','definition of upper hinge'),1,TRUE)
a<-table.element(a,hyperlink('upper_whisker.htm','upper whisker','definition of upper whisker'),1,TRUE)
a<-table.row.end(a)
for (i in 1:length(y[,1]))
{
a<-table.row.start(a)
a<-table.element(a,dimnames(t(x))[[2]][i],1,TRUE)
for (j in 1:5)
{
a<-table.element(a,r$stats[j,i])
}
a<-table.row.end(a)
}
a<-table.end(a)
table.save(a,file='mytable.tab')
a<-table.start()
a<-table.row.start(a)
a<-table.element(a,'Boxplot Notches',4,TRUE)
a<-table.row.end(a)
a<-table.row.start(a)
a<-table.element(a,'Variable',1,TRUE)
a<-table.element(a,'lower bound',1,TRUE)
a<-table.element(a,'median',1,TRUE)
a<-table.element(a,'upper bound',1,TRUE)
a<-table.row.end(a)
for (i in 1:length(y[,1]))
{
a<-table.row.start(a)
a<-table.element(a,dimnames(t(x))[[2]][i],1,TRUE)
a<-table.element(a,r$conf[1,i])
a<-table.element(a,r$stats[3,i])
a<-table.element(a,r$conf[2,i])
a<-table.row.end(a)
}
a<-table.end(a)
table.save(a,file='mytable1.tab')