Free Statistics

of Irreproducible Research!

Author's title

Author*Unverified author*
R Software Modulerwasp_bootstrapplot1.wasp
Title produced by softwareBootstrap Plot - Central Tendency
Date of computationThu, 06 Nov 2008 06:05:53 -0700
Cite this page as followsStatistical Computations at FreeStatistics.org, Office for Research Development and Education, URL https://freestatistics.org/blog/index.php?v=date/2008/Nov/06/t122597678083ah9ge2decxlfw.htm/, Retrieved Sun, 19 May 2024 06:42:33 +0000
Statistical Computations at FreeStatistics.org, Office for Research Development and Education, URL https://freestatistics.org/blog/index.php?pk=22101, Retrieved Sun, 19 May 2024 06:42:33 +0000
QR Codes:

Original text written by user:
IsPrivate?No (this computation is public)
User-defined keywords
Estimated Impact136
Family? (F = Feedback message, R = changed R code, M = changed R Module, P = changed Parameters, D = changed Data)
F       [Bootstrap Plot - Central Tendency] [] [2008-11-06 13:05:53] [0bc7a7cb481099ab86d953798dce52bf] [Current]
Feedback Forum
2008-11-10 16:55:50 [Gert-Jan Geudens] [reply
Uit het antwoord van de student(e) blijkt niet duidelijk welke volgens hem/haar de beste indicator is.
Ik citeer ook even het antwoord van de student(e) :
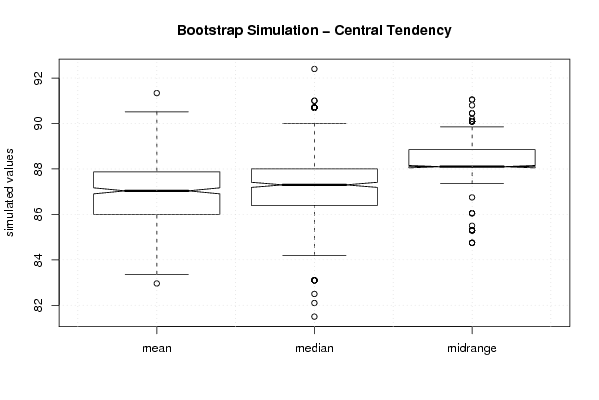
'De student zegt in zijn conclusie dat de mediaan de beste benadering zou zijn omdat deze de kleinste spreiding en dus de het kleinste foutenmarge vertoond.'

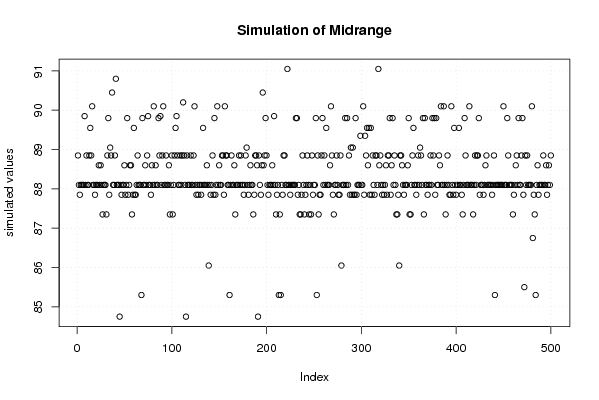
Dit zeker niet waar ! De midrange heeft de kleinste spreiding en lijkt op het eerste zicht het beste. De vele outliers maken van deze -zoals de student(e) reeds zelf beschreef- echter toch geen goede indicator.
Daardoor lijkt het gemiddelde het beste. De spreiding is net iets groter maar de outliers zijn minder talrijk.

Welke nu net het beste is blijft een kwestie van afweging maar toch durven we voorzichtig te stellen dat het gemiddelde -in dit geval- de beste indicator is.
2008-11-11 23:20:37 [5faab2fc6fb120339944528a32d48a04] [reply
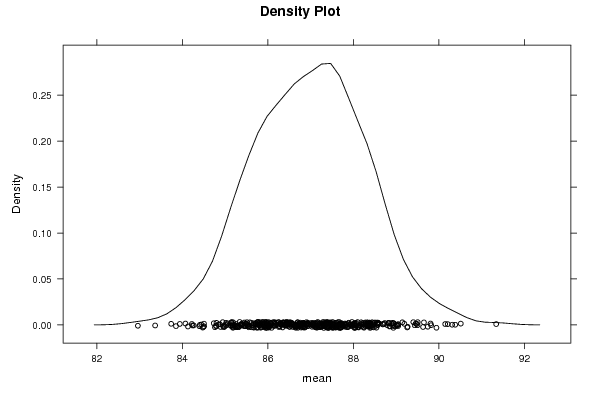
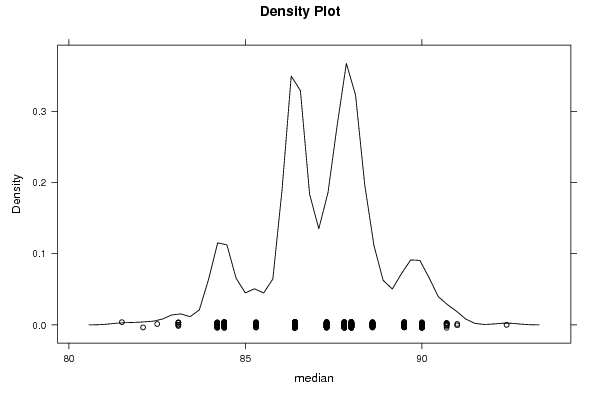
De bootstrapping methode maakt gebruik van alle gemiddeldes om een algemene uitspraak te doen over het rekenkundig gemiddelde, de mediaan en de midrange. Dus we zijn niet meer met de oorspronkelijke dataset bezig. De zogenaamde outliers zijn hier berekeningen van een bepaald gemiddelde dat buiten de verdeling valt. Hierbij moet men een keuze maken wat men de veiligste schatter vindt. Midrange heeft een kleine spreiding maar ook veel metingen die buiten de verdeling vallen en die dus kunnen zorgen voor een foutieve conclusie. Het rekenkundig gemiddelde wordt hier meer gebruikt. Het heeft wel een grotere spreiding maar het aantal metingen die buiten de verdeling vallen zijn minder.

Post a new message
Dataseries X:
109,20
88,60
94,30
98,30
86,40
80,60
104,10
108,20
93,40
71,90
94,10
94,90
96,40
91,10
84,40
86,40
88,00
75,10
109,70
103,00
82,10
68,00
96,40
94,30
90,00
88,00
76,10
82,50
81,40
66,50
97,20
94,10
80,70
70,50
87,80
89,50
99,60
84,20
75,10
92,00
80,80
73,10
99,80
90,00
83,10
72,40
78,80
87,30
91,00
80,10
73,60
86,40
74,50
71,20
92,40
81,50
85,30
69,90
84,20
90,70
100,30


Summary of computational transaction
Raw Inputview raw input (R code)
Raw Outputview raw output of R engine
Computing time3 seconds
R Server'Gwilym Jenkins' @ 72.249.127.135
R Framework error message
Warning: there are blank lines in the 'Data' field.
Please, use NA for missing data - blank lines are simply
 deleted and are NOT treated as missing values.

\begin{tabular}{lllllllll}
\hline
Summary of computational transaction \tabularnewline
Raw Input & view raw input (R code)  \tabularnewline
Raw Output & view raw output of R engine  \tabularnewline
Computing time & 3 seconds \tabularnewline
R Server & 'Gwilym Jenkins' @ 72.249.127.135 \tabularnewline
R Framework error message & 
Warning: there are blank lines in the 'Data' field.
Please, use NA for missing data - blank lines are simply
 deleted and are NOT treated as missing values.
\tabularnewline \hline \end{tabular} %Source: https://freestatistics.org/blog/index.php?pk=22101&T=0

[TABLE]
[ROW][C]Summary of computational transaction[/C][/ROW]
[ROW][C]Raw Input[/C][C]view raw input (R code) [/C][/ROW]
[ROW][C]Raw Output[/C][C]view raw output of R engine [/C][/ROW]
[ROW][C]Computing time[/C][C]3 seconds[/C][/ROW]
[ROW][C]R Server[/C][C]'Gwilym Jenkins' @ 72.249.127.135[/C][/ROW]
[ROW][C]R Framework error message[/C][C]
Warning: there are blank lines in the 'Data' field.
Please, use NA for missing data - blank lines are simply
 deleted and are NOT treated as missing values.
[/C][/ROW] [/TABLE] Source: https://freestatistics.org/blog/index.php?pk=22101&T=0

Globally Unique Identifier (entire table): ba.freestatistics.org/blog/index.php?pk=22101&T=0

As an alternative you can also use a QR Code:  

The GUIDs for individual cells are displayed in the table below:

Summary of computational transaction
Raw Inputview raw input (R code)
Raw Outputview raw output of R engine
Computing time3 seconds
R Server'Gwilym Jenkins' @ 72.249.127.135
R Framework error message
Warning: there are blank lines in the 'Data' field.
Please, use NA for missing data - blank lines are simply
 deleted and are NOT treated as missing values.


Estimation Results of Bootstrap
statisticQ1EstimateQ3S.D.IQR
mean86.00286885245986.893442622950887.8721311475411.309290983913891.86926229508197
median86.487.3881.662826817817211.59999999999999
midrange88.188.188.850.8603030178751750.75

\begin{tabular}{lllllllll}
\hline
Estimation Results of Bootstrap \tabularnewline
statistic & Q1 & Estimate & Q3 & S.D. & IQR \tabularnewline
mean & 86.002868852459 & 86.8934426229508 & 87.872131147541 & 1.30929098391389 & 1.86926229508197 \tabularnewline
median & 86.4 & 87.3 & 88 & 1.66282681781721 & 1.59999999999999 \tabularnewline
midrange & 88.1 & 88.1 & 88.85 & 0.860303017875175 & 0.75 \tabularnewline
\hline
\end{tabular}
%Source: https://freestatistics.org/blog/index.php?pk=22101&T=1

[TABLE]
[ROW][C]Estimation Results of Bootstrap[/C][/ROW]
[ROW][C]statistic[/C][C]Q1[/C][C]Estimate[/C][C]Q3[/C][C]S.D.[/C][C]IQR[/C][/ROW]
[ROW][C]mean[/C][C]86.002868852459[/C][C]86.8934426229508[/C][C]87.872131147541[/C][C]1.30929098391389[/C][C]1.86926229508197[/C][/ROW]
[ROW][C]median[/C][C]86.4[/C][C]87.3[/C][C]88[/C][C]1.66282681781721[/C][C]1.59999999999999[/C][/ROW]
[ROW][C]midrange[/C][C]88.1[/C][C]88.1[/C][C]88.85[/C][C]0.860303017875175[/C][C]0.75[/C][/ROW]
[/TABLE]
Source: https://freestatistics.org/blog/index.php?pk=22101&T=1

Globally Unique Identifier (entire table): ba.freestatistics.org/blog/index.php?pk=22101&T=1

As an alternative you can also use a QR Code:  

The GUIDs for individual cells are displayed in the table below:

Estimation Results of Bootstrap
statisticQ1EstimateQ3S.D.IQR
mean86.00286885245986.893442622950887.8721311475411.309290983913891.86926229508197
median86.487.3881.662826817817211.59999999999999
midrange88.188.188.850.8603030178751750.75


Parameters (Session):
par1 = 500 ;
Parameters (R input):
par1 = 500 ;
R code (references can be found in the software module):
par1 <- as.numeric(par1)
if (par1 < 10) par1 = 10
if (par1 > 5000) par1 = 5000
library(lattice)
library(boot)
boot.stat <- function(s,i)
{
s.mean <- mean(s[i])
s.median <- median(s[i])
s.midrange <- (max(s[i]) + min(s[i])) / 2
c(s.mean, s.median, s.midrange)
}
(r <- boot(x,boot.stat, R=par1, stype='i'))
bitmap(file='plot1.png')
plot(r$t[,1],type='p',ylab='simulated values',main='Simulation of Mean')
grid()
dev.off()
bitmap(file='plot2.png')
plot(r$t[,2],type='p',ylab='simulated values',main='Simulation of Median')
grid()
dev.off()
bitmap(file='plot3.png')
plot(r$t[,3],type='p',ylab='simulated values',main='Simulation of Midrange')
grid()
dev.off()
bitmap(file='plot4.png')
densityplot(~r$t[,1],col='black',main='Density Plot',xlab='mean')
dev.off()
bitmap(file='plot5.png')
densityplot(~r$t[,2],col='black',main='Density Plot',xlab='median')
dev.off()
bitmap(file='plot6.png')
densityplot(~r$t[,3],col='black',main='Density Plot',xlab='midrange')
dev.off()
z <- data.frame(cbind(r$t[,1],r$t[,2],r$t[,3]))
colnames(z) <- list('mean','median','midrange')
bitmap(file='plot7.png')
boxplot(z,notch=TRUE,ylab='simulated values',main='Bootstrap Simulation - Central Tendency')
grid()
dev.off()
load(file='createtable')
a<-table.start()
a<-table.row.start(a)
a<-table.element(a,'Estimation Results of Bootstrap',6,TRUE)
a<-table.row.end(a)
a<-table.row.start(a)
a<-table.element(a,'statistic',header=TRUE)
a<-table.element(a,'Q1',header=TRUE)
a<-table.element(a,'Estimate',header=TRUE)
a<-table.element(a,'Q3',header=TRUE)
a<-table.element(a,'S.D.',header=TRUE)
a<-table.element(a,'IQR',header=TRUE)
a<-table.row.end(a)
a<-table.row.start(a)
a<-table.element(a,'mean',header=TRUE)
q1 <- quantile(r$t[,1],0.25)[[1]]
q3 <- quantile(r$t[,1],0.75)[[1]]
a<-table.element(a,q1)
a<-table.element(a,r$t0[1])
a<-table.element(a,q3)
a<-table.element(a,sqrt(var(r$t[,1])))
a<-table.element(a,q3-q1)
a<-table.row.end(a)
a<-table.row.start(a)
a<-table.element(a,'median',header=TRUE)
q1 <- quantile(r$t[,2],0.25)[[1]]
q3 <- quantile(r$t[,2],0.75)[[1]]
a<-table.element(a,q1)
a<-table.element(a,r$t0[2])
a<-table.element(a,q3)
a<-table.element(a,sqrt(var(r$t[,2])))
a<-table.element(a,q3-q1)
a<-table.row.end(a)
a<-table.row.start(a)
a<-table.element(a,'midrange',header=TRUE)
q1 <- quantile(r$t[,3],0.25)[[1]]
q3 <- quantile(r$t[,3],0.75)[[1]]
a<-table.element(a,q1)
a<-table.element(a,r$t0[3])
a<-table.element(a,q3)
a<-table.element(a,sqrt(var(r$t[,3])))
a<-table.element(a,q3-q1)
a<-table.row.end(a)
a<-table.end(a)
table.save(a,file='mytable.tab')